
Abstract
Background:
Body weight reduction (BWR) of at least 3% in obese Japanese individuals through lifestyle interventions has improved the risk factors for cardiovascular disease (CVD). We aimed to assess the relation between body weight change (BWC) and CVD risk change and to identify lifestyle improvement related to BWR in obese Japanese individuals.
Methods:
Subjects were 2579 health checkup examinees without medicated diabetes, hypertension or dyslipidemia, and a body mass index ≥25 kg/m2 who completed lifestyle questionnaires in 2008 and 2012. The 4-year changes in fasting plasma glucose (FPG), glycated hemoglobin (HbA1c), lipids, and blood pressure (BP) levels were compared across the five groups based on the 4-year BWC, and presented as <−5%, −5% to −3%, −3% to −1%, −1% to 1%, and ≥1%. Multivariable logistic regression models were used to calculate odds ratios (ORs) and 95% confidence intervals (CI) for lifestyle improvement related to BWR.
Results:
Comparing the groups to the reference group (BWC ranging from −1% to +1%), we observed that FPG and HbA1c levels were lower in women in the <−5% group; BP levels were also lower in the <−5% group; triglyceride levels had improved in the <−3% group, and low-density lipoprotein cholesterol levels in the <−5% group; high-density lipoprotein cholesterol levels had improved in men in the <−5% group. In men, the adjusted OR (95% CI) for BWR related to lifestyle improvement pertaining to “over 30 min exercise” was 2.6 (2.0–3.6). In women, the adjusted ORs for BWR related to “walking or physical activity,” “drinking alcohol,” and “drinking more than a glass of sake” were 1.7 (1.1–2.7), 1.9 (1.1–3.5), and 1.8 (1.1–3.0), respectively.
Conclusions:
A 5% BWR improved FPG and HbA1c levels in obese women, and BP and lipid levels in obese men. Improvements in exercise and alcohol consumption habits were associated with BWR in this population.
Introduction
Obesity leads to metabolic disturbances and the development of conditions associated with metabolic syndrome (MetS), such as hypertension, insulin resistance, impaired glucose tolerance, and dyslipidemia, which are risk factors for cardiovascular disease (CVD). 1,2 The proportion of obese people is on the rise, worldwide, making it a serious problem. 3 In Japan, people with body mass index (BMI) ≥25 kg/m2 are defined as being obese. 4 In addition, about 30% of men and 20% of women are obese and the prevalence of metabolic disturbances has continuously increased in the past seven decades. 5 The maintenance of adequate body weight (BW) is key to the prevention of metabolic disturbances. BW reduction (BWR) through lifestyle modifications, including diet and exercise can protect against metabolic disturbances. 6 –8 The Japan Society for the Study of Obesity (JASSO) defines “obesity disease” as the coexistence of BMI ≥25 kg/m2 with one or more lifestyle-related diseases and encourage BWR among patients with “obesity disease.” 4
The American College of Cardiology/American Heart Association Task Force on Practice Guidelines has reported a BWR of as little as 3%–5% of body weight may lead to clinically meaningful reductions in some cardiovascular risk factors, with larger BWR (loss of 5%–10% of baseline weight within 6 months) producing greater benefits among patients with a BMI ≥25 kg/m2 and some CVD risk factors. 9 In Japan a BWR of 3% through structured, intensive, and organized lifestyle intervention programs successfully improved obesity-related parameters among Japanese individuals with obesity disease or MetS risk. 10 Therefore, the JASSO defined the treatment target for “obesity disease” as at least 3% reduction from the pre-existing BW in 3–6 months. 11 However, not all obese or overweight people participate in individualized intervention programs aimed at reducing BW. No previous study has examined the influence of BWR on CVD risk factors in a large cohort of obese Japanese individuals without metabolic abnormalities. In addition, the extent of BWR required for the improvement of CVD risk factors remains to be fully assessed.
In Japan, annual health checkups are held for the early detection of MetS and to provide specific health guidance on lifestyle for participants at risk. 12 Therefore, it was necessary to understand how BWC affects CVD risk and identify the lifestyle improvements related to BWR in obese Japanese individuals. Thus, the aim of the study was to assess the relation between BWC and CVD risk change and to identify lifestyle improvement related to BWR in obese Japanese individuals.
Materials and Methods
Participants
Figure 1 shows the flow diagram of participants analyzed in the study. This study recruited 89,096 Japanese people who underwent annual health checkups at Josai Hospital (Tokyo, Japan) in 2008. Participants with missing data (n = 42,517), those younger than 20 years (n = 836), treated with medications for hypertension, dyslipidemia, or diabetes (n = 5564), and with a BMI <25 kg/m2 (n = 70,162) in 2008 were excluded. Among the remaining 7991 of the participants, 2579 repeated checkups in 2012 (follow-up rate 32.3%) and were analyzed in this study.
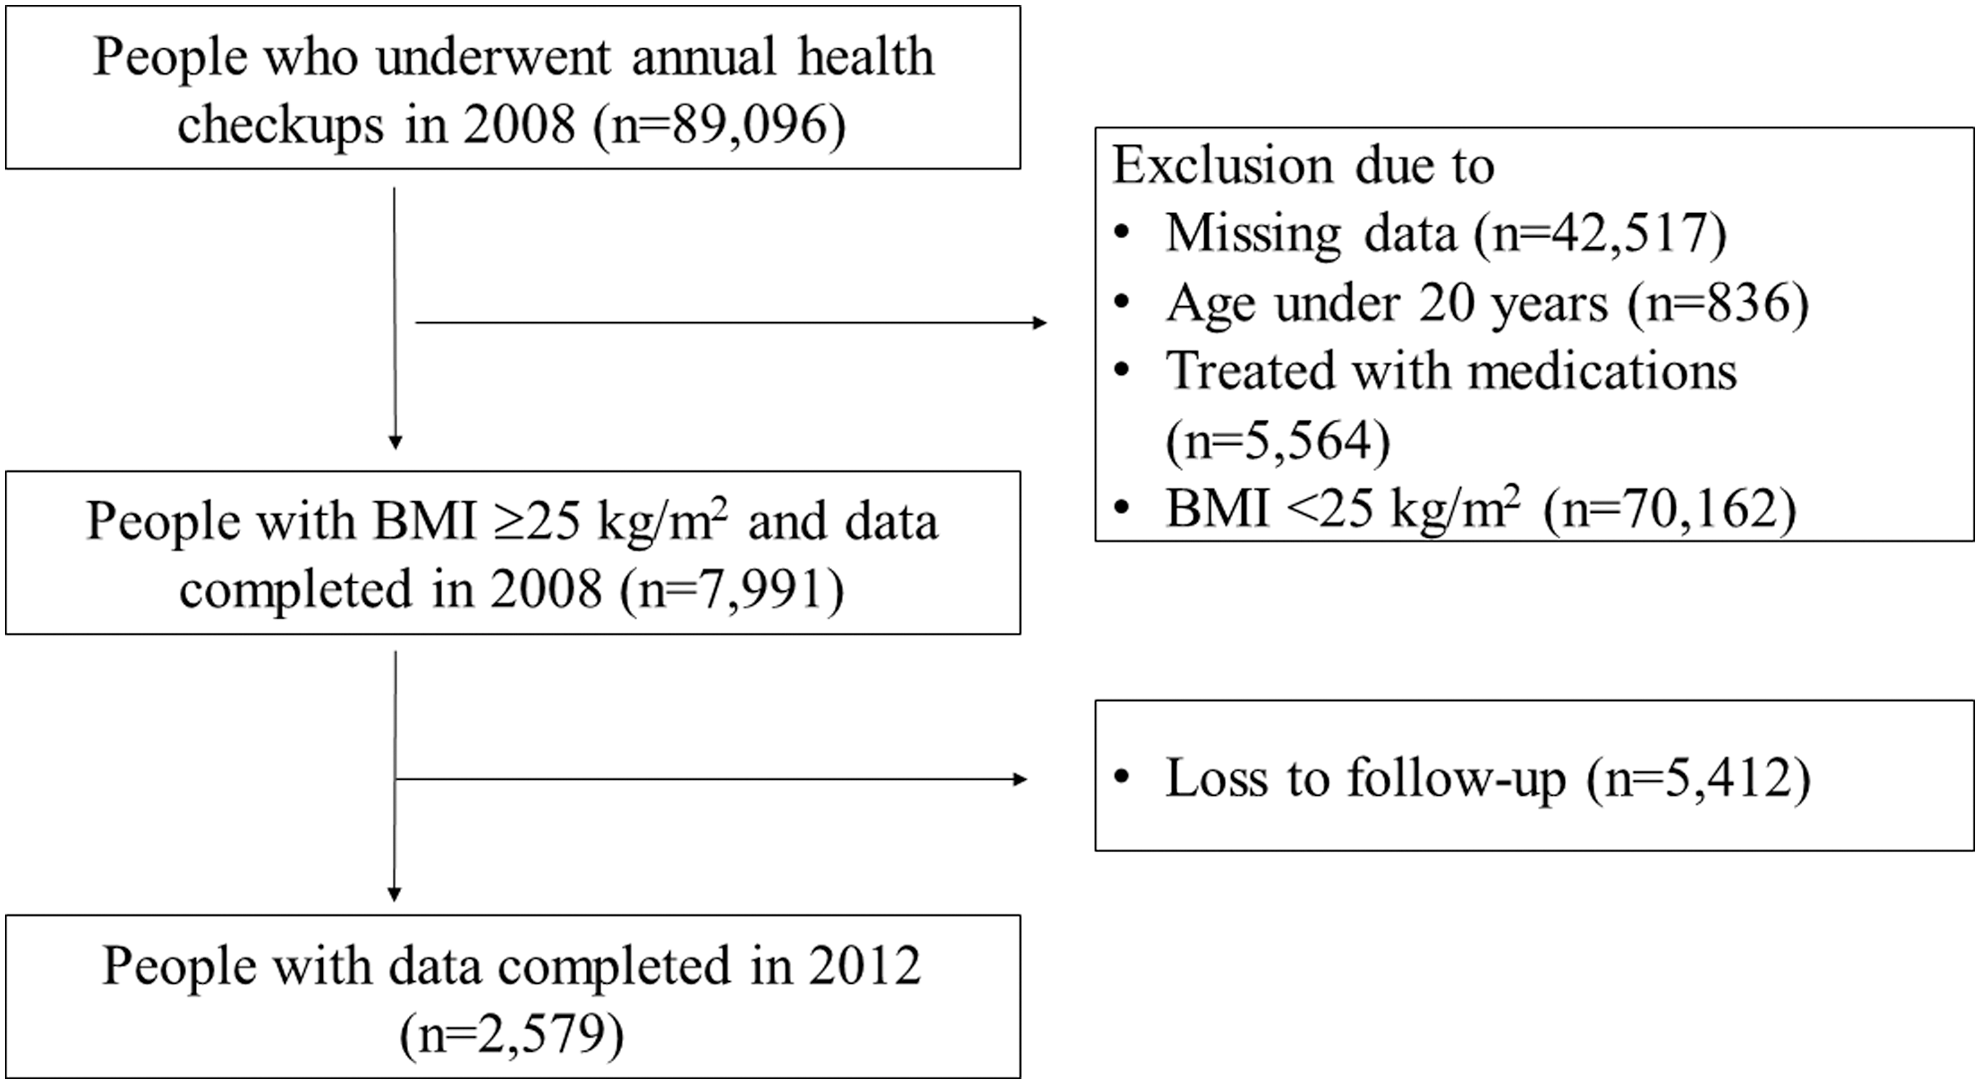
Flow diagram of participants analyzed for the study. BMI, body mass index.
All data were analyzed separately for sex, since, in 2008 among health checkup examinees in Tokyo, there were more obese subjects in men than in women (31.0% of men and 17.2% of women were BMI ≥25 kg/m2) and the secular trend in the proportion of obesity increased in men but decreased in women (men: 31.9% and women: 16.7% in 2010). 12 Since the study comprised enough number of subjects, we analyzed our data stratified by sex instead of adjusting for sex.
Study participants were divided into five groups according to the rate of BWC (%BWC) (<−5%, −5% to −3%, −3% to −1%, −1% to 1%, and ≥1%) calculated as [(weight in 2012 − weight in 2008)/weight in 2008] × 100 (%) for each participant.
Biochemical analysis
All biochemical assessments were conducted at two commercial laboratories in 2008 and 2012 (SRL or BML, Tokyo). Venous blood samples were obtained in the morning after an overnight fast. Fasting plasma glucose (FPG; hexokinase UV method), glycated hemoglobin (HbA1c; latex coagulating method), triglyceride (TG; enzymatic method), high-density lipoprotein cholesterol (HDL-C; direct method), and low-density lipoprotein cholesterol (LDL-C; direct method) levels were measured.
Anthropometric and body composition measurements and questionnaires
Anthropometric and body compositions were evaluated based on participants' heights and BWs. Height was measured to the nearest 0.1 cm with the participant standing without shoes, using a digital stadiometer (AD-6400; A&D, Tokyo). BW was measured to the nearest 0.1 kg with the participant dressed in light indoor clothing using a digital scale (WB-150; Tanita, Tokyo). BMI was calculated by dividing the BW by the square of height (kg/m2).
Systolic and diastolic blood pressure (BP) levels were measured using a sphygmomanometer (ES-H55; Terumo, Tokyo) with participants in the sitting position after at least 10 min of rest.
All participants completed questionnaires related to their lifestyle (Supplementary Table S1), pharmacological history, and smoking and alcohol consumption habits in the years 2008 and 2012. Three questions regarding exercise: Q10–12, four questions regarding dietary habits: Q14–17, one question regarding smoking habits: Q8, two questions regarding alcohol habits: Q18–19, and one question regarding sleep: Q20 were used to examine the association with change in BWR.
Statistical analyses
A paired t-test was used to compare continuous variables with a normal distribution in 2008 and 2012. Due to the skewed TG distribution, we used Wilcoxon's rank test in the analyses and presented the medians and interquartile ranges. The frequency and percentage of each categorical variable were reported, and a Pearson's chi-square test or Fisher's exact test was used for the comparisons in 2008 and 2012.
The 4-year percentage (%) change in HbA1c, TG, HDL-C, and BP levels were calculated for each participant, and the respective means were displayed in five %BWC groups as described above. Analysis of variance was used to compare means across five %BWC groups, and Bonferroni's method was used to compare means between the reference group (%BWC group ranging from −1% to +1%) and the other four %BWC groups.
Logistic regression analysis was performed to calculate the odds ratios (ORs) and their 95% confidence intervals (CIs) of the improved lifestyle-related behaviors in the prediction of BWR. In the current study, BWR was defined as the condition that BW has not changed or increased for 4 years. Regarding lifestyle, we defined lifestyles to have improved if the reply to questions on lifestyle changed from “not good or bad” in 2008 to “good” in 2012. “Good” lifestyles included the following: exercise, walking fast, eating slowly, eating breakfast, eating supper early, not eating after supper, not drinking alcohol much, and sleeping well. Since BWR had a significant relation with age in men and BMI in women, identified significant behaviors in the univariable model were adjusted for age in men and for BMI in women in the multivariable model.
All statistical analyses were conducted using SPSS version 21.0 (IBM Corp., Chicago, IL). All reported P values were two-tailed, and P < 0.05 was considered statistically significant.
The study protocol was approved by the Institutional Review Boards of Josai Hospital and Tokyo Women's Medical University, and written informed consent was obtained from the study participants.
Results
Comparison of the clinical parameters between the baseline and follow-up for men and women
The mean ages at the baseline were 40 and 39 years for men and women, respectively (Table 1). The mean BMI, FPG, HbA1c, BPs, and HDL-C levels were significantly worse at the follow-up than at the baseline in both sexes. The mean LDL-C level was significantly improved during the 4-year period in men but did not change in women. The median TG level did not change during the 4-year period in both sexes.
Comparison of the Clinical Parameters in Men and Women Between the Baseline (2008) and Follow-up (2012)
Values are shown as mean ± standard deviations and medians (interquartile range) for TG.
P values, data at the baseline (2008) and follow-up (2012); BMI, body mass index; FPG, fasting plasma glucose; HbA1c, glycated hemoglobin; SBP, systolic blood pressure; DBP, diastolic blood pressure; HDL-C, high-density lipoprotein cholesterol; LDL-C, low-density lipoprotein cholesterol; TG, triglyceride.
Comparison of lifestyle-related behaviors between the baseline and follow-up for men and women
The percentages of participants who smoked significantly decreased during the 4-year period in both sexes (Table 2).
Comparison of Lifestyle-Related Behaviors in Men and Women Between the Baseline (2008) and Follow-up (2012)
Values are shown as proportions (%), as appropriate.
P values, data at the baseline (2008) and follow-up (2012).
The percentages of participants who “Q10: exercised at least 2 days per week, at least 30 min each at an intensity that causes a slight sweat, for at least 1 year (exercised at least 30 min, 2 days/week)” significantly increased during the 4-year period in both sexes. The number of participants who “Q12: walked faster than people of their age and sex (walked faster than others)” was lower in men.
The proportions of participants who “Q15: had an evening meal within 2 hr before bedtime 3 days or more per week (had supper late)” and “Q17: skipped breakfast 3 days or more per week (skipped breakfast)” significantly decreased during the 4-year period only in men.
The percentages of participants who “Q18: drank alcoholic beverages such as sake, shochu, beer, and liquor, every day or sometimes (drank alcohol)” was significantly increased at 4 years only in women.
Four-year percentage change in the mean for the metabolic parameters according to the body weight change percentage
Figure 2a, b shows the relationship between the 4-year %change in HbA1c, FPG, BP, and serum lipid levels and the five groups of 4-year %BWC. The 4-year %change in FPG and HbA1c levels was not significantly different between the five groups of %BWC in men (P = 0.724 and 0.072, respectively), but FPG and HbA1c levels in women and %change in the BP and serum lipid levels was significantly ameliorated with %BWC deterioration in both sexes (all P < 0.001).

Four-year percentage change in the mean for cardiovascular risk factors according to the percentage body weight reduction in obese men
Next, each 4-year %change group of FPG, HbA1c, BP, and lipids was compared based on the %BWC with the −1% to 1% group as the reference (Table 3). The 4-year %change in the FPG and HbA1c levels had significantly decreased in the group with a %BWC < −5% in women. The 4-year %change in the systolic BP had significantly increased in the group with a %BWC ≥ +1% and decreased only in men in the group with a %BWC < −5%. Similarly, the 4-year change in diastolic BP for men had significantly increased in the group with a %BWC ≥ +1%, and decreased in the group with a %BWC < −5%. The 4-year %change in the TG levels for men had significantly increased in the group with a %BWC ≥ +1% and decreased in the group with a %BWC ranging from −3% to −5% and <−5% compared with that in the reference group. The 4-year %change in the HDL-C levels for men had significantly deteriorated in the group with a %BWC ≥ +1% and ameliorated in the group with a %BWC < −5%. For women, the level of TG had significantly decreased in the group with a %BWC < −5% and −3% to −5%.
Four-Year % Change in the Mean for Cardiovascular Risk Factors According to the % Change in Body Weight in Men and Women
Statistical difference was tested by comparison with a reference group (−1% to 1%).
SE, standard error.
Improvement in the lifestyle behaviors related to BWR
The univariable analysis showed that the improvement of lifestyle behaviors regarding Q10: “Exercising at least 30 min, 2 days/week” for men (OR [95% CI]: 2.63 [1.96–3.54], P < 0.001), and in women behaviors under Q11: “Walking or physical activity” (1.68 [1.04–2.70], P = 0.033), Q18: “Drinking alcohol” (1.94 [1.07–3.53], P = 0.030), and Q19: “Drinking more than a glass of refined sake a day” (1.71 [1.02–2.85], P = 0.041) were related to BWR (Table 4).
Logistic Regression Analysis of the Lifestyle-Related Behaviors in the Prediction of Body Weight Reduction at Four Years in Men and Women
OR, odds ratio; CI, confidence interval.
These results did not change after adjustment for age in men or adjustment for BMI at baseline in women.
Discussion
This study shows that a BWR of at least 5% over a 4-year period was associated with improved BP and serum lipid levels in obese Japanese men, and improved FPG and HbA1c levels in obese Japanese women. In addition, a BWR of at least 3% was associated with improved serum TG levels in men and LDL-C levels in women.
Muramoto et al. conducted a lifestyle modification program among Japanese individuals with obesity disease or MetS and found that greater than 3% of BWR improved obesity-related parameters; therefore, the current guideline recommends BWR greater than 3% as the treatment target for obesity disease. 10,11 Unlike our study, their subjects had obesity disease or MetS and their lifestyles improved through participation in the program. Our subjects were obese, but not all subjects had obesity disease or MetS. We then subanalyzed our subjects with either impaired fasting glucose (FPG ≥110 mg/dL), 13 hypertension (≥140/90 mmHg), 14 or dyslipidemia (HDL-C < 40 mg/dL or LDL-C ≥ 140 mg/dL or TG ≥150 mg/dL), 15 and found almost the same results as their findings; a BWR of 5% ameliorated BP and lipid levels in men and HDL-C level in women (Supplementary Tables 2 and 3 and Supplementary Fig. S1). According to the report from the Ministry of Health, Labor and Welfare, only 5.1%–13.4% of participants who were suspected to have MetS in the national specific screening program undertook the specific health guidance program in Tokyo area from 2008 to 2012. 16 Since most of our subjects were considered not to have received health guidance even if they had obesity disease or MetS, they did not have a chance to take part in structured lifestyle modification programs, even though our results revealed that obesity-related parameters improved with a 5% BWR. Komiya et al. reported that a 3-year BWR in the general Japanese population did not ameliorate blood glucose levels regardless of improvements in the BP and lipid levels. 17 This was in line with our findings on obese Japanese men.
The Diabetes Prevention Program (DPP) reported a 58% reduction in the incidence of type 2 diabetes among people with a high risk of diabetes treated with an intensive lifestyle intervention compared with the placebo group, in the United States. 18 Furthermore, lifestyle modifications (frequent individual instructions and follow-up by medical staff) can reduce BW and aid in the prevention of type 2 diabetes among overweight Japanese with impaired FPG levels. 19 However, in the DPP Study, even though the men in the lifestyle intervention group lost a significantly higher amount of BW and had higher levels of physical activity than the women in the lifestyle intervention group, the progression rate to diabetes was the same in both sexes. 20 Our results showed no significant changes in the FPG and HbA1c levels between any of the %BWC groups in the men. The reason for this was not clear as we did not have the data for visceral fat or insulin resistance. However, the proportion of participants whose lifestyle improved was small. This may explain the sex-related differences in the 4-year FPG and HbA1c level changes.
In our study, the BP levels improved both in men and women with increasing BWR; however, there was no significant difference between any of the %BWC groups and the reference group in women. Truesdale et al. reported that an increase in the BW over 3 years increased BP levels, and the effect was stronger in men than women. 21 This may be due to the fact that the influence of BWR on BP in men was larger than in women.
The serum TG and HDL-C levels improved in both sexes with increasing BWR and in the group with a %BWC < −3% to −5% only in men. In women, serum lipid levels change with age; TG levels rapidly increase after the age of about 50 years in women due to menopause 22 and this may complicate the serum lipid change by BWR in women.
Many previous studies have reported the significant association between physical activity and BWR. 23 We showed that improvements in the status of “exercising at least 30 min, 2 days/week” for men, and “walking at least 1 hr a day or participating in physical activity” for women were associated with BWR, although the proportions of those who improved their exercise habits over the 4-year period was small. While there was a report that women walk for leisure more than men, 24 women in our study did less exercise (“exercising at least 30 min, 2 days/week,” and “walking at least 1 hr a day or participating in physical activity”) than men both in 2008 and 2012. We should encourage exercise among Japanese women.
Eating late, 25,26 eating fast, 27 –29 and skipping breakfast 30 were reported to be related with obesity. However, in our study, improvements in eating habits were not associated with BWR, and few participants changed their eating habits over the period. The eating habits of the youth often continue when they come of age, 31 and it may be difficult to improve their dietary behaviors.
Alcohol consumption can lead to weight gain 32 although there has been no definite positive effect of reduced alcohol intake on BWR in clinical studies. 31 –36 Although the drinking frequency increased in the 4-year period in the present study (Table 3), a decrease in alcohol consumption was significantly associated with BWR only in women. This suggests that women are more susceptible to alcohol than men. Sherwood et al. showed a positive relationship between alcohol intake and BW only in women. 37 In has been reported that alcohol has a greater effect on BW and fatty liver in women than men. 38
There is a specific guidance system focusing on lifestyle change for obese people who are at high risk of developing MetS in Japan. 11 However, less than 20% of those classified as the group needing lifestyle interventions participated in this program. 16 It is a challenge to raise awareness on the importance of improving lifestyle in a larger number of people in the target group.
In this study, age and BMI at baseline did not show significant trends across the five %BWC groups in either sex. Thus, our data could not be adjusted for age or BMI at baseline, as presented in Fig. 2a, b as well as Table 3. We believe that our results showed absolute changes in risk factors associated with BWC groups.
Our study has several limitations. First, the follow-up rate was low (32.3%). Participants who repeated health check-ups were significantly younger and had healthier profiles than those who did not (Supplementary Table S4). Thus, selection bias cannot be excluded and this may lead to the under- or overestimation of the strength of the association between BWR and CVD risk factors or lifestyle behaviors. Second, the measurement of waist circumference (WC) was not mandatory at the baseline and follow-up, and we could not analyze the WC in this study. However, a Japanese study showed that a WC reduction of at least 3 cm might protect against the development of MetS among obese men. 39 Nevertheless, BMI is closely related to WC, and we believe our findings would not significantly change if BMI were replaced with WC. Third, BWR is sometimes associated with malignant neoplasms or other serious medical problems. We could not exclude people who had diseases in the latency period among those with BWR during the observational period. However, our participants were relatively young, and likely had a low risk of such diseases.
Conclusion
A 5% BWR improved the FPG and HbA1c levels in obese women and BP and lipid levels in obese men. Improvements in physical activity and alcohol consumption behaviors were associated with BWR.
Footnotes
Acknowledgments
The authors gratefully acknowledge the contributions of all staff of Josai Hospital Medical Examination Center. Funding: This study was supported by funds granted to T.N. by the Japan Diabetes Society; Japanese Ministry of Health, Labor, and Welfare; the Japan Medical Women's Association; the Tokyo Women's Medical University Association; the Yayoi Yoshioka Research Fund; the Japan Automobile Research Institute Fund; and the Yazuya Food and Health Research Foundation.
Author Disclosure Statement
No competing financial interests exist.
Supplementary Material
Supplementary Figure S1
Supplementary Table S1
Supplementary Table S2
Supplementary Table S3
Supplementary Table S4
References
Supplementary Material
Please find the following supplemental material available below.
For Open Access articles published under a Creative Commons License, all supplemental material carries the same license as the article it is associated with.
For non-Open Access articles published, all supplemental material carries a non-exclusive license, and permission requests for re-use of supplemental material or any part of supplemental material shall be sent directly to the copyright owner as specified in the copyright notice associated with the article.