
Abstract
Background:
Salt is important in the pathogenesis of hypertension (HT). Salt-sensitive hypertension (SSH) accounts for about half of all HT cases. In SSH, sodium/potassium adenosine triphosphatase (Na+/K+-ATPase) activity is impaired. Impaired Na+/K+-ATPase activity in the lens epithelium results in cortical opacities in the peripheral equator of the lens. We investigated the sensitivity of cortical lens opacities in detecting SSH.
Methods:
The study included 191 SSH and 159 non-SSH, salt-resistant HT (SRH) patients (350 HT patients total), aged 40–80 years. One hundred twenty-four sex- and age-matched patients without a HT diagnosis made up the control group. Daily salt intake of all groups was calculated from 24-hr urinary Na excretion. SSH was diagnosed when the difference in mean arterial blood pressure values obtained during high- and low-Na diets was ≥10%. Non-SSH, SRH was diagnosed when the difference was <10%.Two researchers examined the presence of cortical lens opacities biomicroscopically using the diffuse, direct, Scheimpflug, and retroillumination from fundus methods.
Results:
Total lens opacity was predictive of SSH among all cases (P < 0.001), with a sensitivity and specificity of 75.4% [95% confidence interval (CI): 68.6–81.3] and 83.6% (95% CI: 77.0–89.0), respectively. Its positive and negative predictive values were 84.7% (95% CI: 79.4–88.8) and 73.9% (95% CI: 68.6–78.5), respectively.
Conclusions:
Lens opacities can be used as a finding that can be easily observed in the detection of SSH and excess salt intake.
Introduction
Metabolic syndrome, which includes insulin resistance and hyperinsulinemia as two of its conditions, activates the sympathetic nervous and the renin–angiotensin–aldosterone systems (RAAS). Hence, through sodium (Na+) retention and volume expansion, these two systems contribute to hypertension (HT) development. 1
The number of patients with HT worldwide is estimated to reach 1.56 billion by 2025. 2 Roughly half of all hypertensive patients have salt-sensitivity hypertension (SSH), defined as an increase in blood pressure (BP) in response to a change in dietary salt intake. A definitive diagnosis of salt sensitivity is difficult, expensive, and associated with low patient compliance. Sodium/potassium adenosine triphosphatase (Na+/K+-ATPase) activity is impaired in patients with SSH. 3
In addition to elevated BP, high salt intake plays a role in endothelial dysfunction, abnormal cardiovascular structure and function, albuminuria, and kidney disease. As such, high salt intake contributes to cardiovascular morbidity and mortality in the general population. 4
Impaired Na+/K+-ATPase activity in the lens epithelium results in cortical opacities in the peripheral equatorial region of the lens. 5 The Na+/K+-ATPase's physiological function is control of cellular sodium homeostasis. In addition to its ion pump feature, Na+/K+-ATPase acts as a receptor, signal transducer, and scaffold in many protein–protein interactions. 6 The present study is the first to investigate the potential of using lens opacity to detect SSH.
Methods
Study population
The study included 191 SSH and 159 non-SSH salt-resistant HT (SRH) patients (350 HT patients total), aged 40–80 years. One hundred twenty-four sex- and age-matched subjects without a HT diagnosis were included in the control group.
Lens opacities may increase with age. 7 Therefore, HT and control groups were subdivided into age groups of <50, 50–59, 60–69, and ≥70 years. These age groups consisted of 74, 117, 99, and 60 patients and 20, 44, 40, and 20 patients in the HT and control groups, respectively.
Since greater salt intake is associated with a higher body mass index (BMI), patients with similar BMI values were included in the study. 8 Patients who were able to measure their own BP regularly and whose basic biochemical parameters [hemoglobin, glucose, creatinine (Cr), low-density cholesterol, leukocytes, aspartate aminotransferase, and alanine aminotransferase levels] were within normal limits were included in the study.
Study exclusion criteria
Patients with apparent cataracts, diabetes mellitus, smoking, hypo/hypercalcemia, hyperparathyroidism, eye trauma, excessive exposure to sunlight, excessive uptake of heat or radiation, history of corticosteroids or digoxin use, coronary artery disease, cardiac failure, patients suspected of secondary HT, and those with chronic kidney disease [serum Cr ≥133 μmol/L (1.5 mg/dL) or estimated glomerular filtration rate <60 mL/min ·1.73 m2], diuretic-containing antihypertensive use, hyperlipidemia, and/or atrial fibrillation were excluded from the study.
Diagnosis of SSH
The definition of salt sensitivity varies among studies. 3 In our study, patients were first given a low-Na+ diet [51 mmol (3 grams)/day] for 1 week and then switched to a high-Na+ diet [307 mmol (18 grams)/day] for another week. BP was measured in the morning of the 3-day baseline observation, and on days 2, 5, 6, and 7 of each intervention period (three times per day) by the same person using the same aneroid sphygmomanometer to avoid observation variation. During the Na+ (low-Na+ and high-Na+) diet, patients were asked to measure their BP three times at 2-min intervals after resting for 5 min. SSH was diagnosed when the difference in mean arterial BP values obtained during intake of high- and low-Na+ diets was ≥10%. Non-SSH SRH was diagnosed when the difference was <10%. 9
Ophthalmoscopy and echocardiography
The retinal grade of HT was established by ophthalmoscopy based on the classification of Keith–Wagener–Barker. 10 Echocardiography was used to assess the presence of left ventricular hypertrophy (LVH). The diagnosis of LVH was made when the LV mass was >115 grams/m2 in men and 95 grams/m2 in women. 11 The duration and stage of HT and types of medication used were recorded. Na+ levels were recorded.
The study was conducted in accordance with the principles of the Declaration of Helsinki. The study protocol was approved by the Ethics Committee. Written informed consent was obtained from each participant.
Lens examination
The presence of cortical lens opacity was biomicroscopically (İnami L-0240, Japan) examined by two researchers using the diffuse, direct Scheimpflug and retroillumination from the fundus methods. Photographs were taken using a smart phone with a 12-megapixel resolution using an attachment added to the objective. With reference to biomicroscopic pupil measurements, pupil diameters and opacities were measured with the aid of ImageJ software (NIH, Bethesda, MD).The opacities in the equatorial region varied from milky-white, small, isolated, radial, and circular opacities to large, band-like and spoke-like opacities on occasions. Central opacities were not included in the study. Patients with significant cortical cataracts (LOCS II C2–C4), 12 nuclear sclerosis, posterior subcapsular cataracts, and mixed type cataracts were excluded from the study. The presence of at least 2–3 pieces of clearly visible opacity over a 40–50 μm diameter was recorded as positive without indication of opacity size. İntraobserver and interobserver intraclass correlation coefficients were 0.94 [confidence interval (CI) 0.92–0.96] and 0.92 (CI 0.90–0.94), respectively. Examples of cortical lens opacity are shown in Fig. 1.

Examples of cortical lens opacity, top row:
Twenty-four hour urine collection and calculation of NaCl intake
The groups' daily salt intakes were calculated from 24-hr urinary Na excretion based on the assumption that all sodium was ingested as NaCl. The patient was asked to follow his or her usual diet on the day when urine was collected. The first urine of the day was discarded, and all urine samples in the following 24 hr were collected in standard containers. The amount of urine collected was measured. Urine samples were stored at −20°C before being transferred to the laboratory (
In accordance with standard procedures, sodium and Cr concentrations were determined by a Beckman Coulter AU5800 Chemistry analyzer using the ion selective electrode method. Cr concentrations were determined with a Beckman Coulter AU5800 analyzer creatinine reagent kit manufactured by Beckman Coulter AU5800 Biomedical, Lismeehan O'Callaghans Mills, Ireland. For quality control, the coefficients of variation were 3.11% and 1.77% for sodium and Cr, respectively.
The measured 24-hr urinary sodium excretion (mmol/day) = concentration of 24-hr urinary sodium excretion (mmol/L) × 24-hr urine volume (L/day). Salt intake was calculated using the equation: 1 gram salt as 17.1 mmol sodium in a 24-hr urine sample. 15
Statistical analysis
Whether the distributions of continuous variables were normal or not was determined by the Kolmogorov–Smirnov test. Descriptive statistics for continuous variables are expressed as mean ± standard deviation or median (min–max) where appropriate. The number of cases and % were used for categorical data, while the mean differences between groups were compared by Student's t test. Otherwise, the Mann Whitney U test was applied for not normally distributed data. To compare categorical variables in 2 × 2 contingency tables, the continuity corrected chi-squared test was used when one or more of the cells had an expected frequency of 5–25, and the Fisher's exact test was used when one or more of the cells has an expected frequency ≤5. However, the likelihood ratio test was performed using R × C contingency tables; when one or more of the cells has an expected frequency of 5 or less. Otherwise Pearson's chi-squared test was applied for categorical data analyses. Point estimations and 95% CIs of diagnostic indicators (such as sensitivity, specificity, positive and negative predicted values, and accuracy) of total lens opacity for determining salt intensive HT were also calculated. Determining the best predictors that affect the existence of lens opacity among hypertensive patients was evaluated using a multiple logistic regression analysis forward procedure. Any variable whose univariable test had P < 0.25 was accepted as a candidate for the multivariable model along with all variables of known clinical importance. Odds ratios, 95% CIs, and Wald statistics for each independent variable were also calculated. Data analysis was performed by using IBM SPSS Statistics version 17.0 software (IBM Corporation, Armonk, NY). A P-value <0.05 was considered statistically significant.
Results
Subjects' age, sex, and BMI in the control and HT groups were similar. Of the HT patients (n = 350), SSH was identified in 54.5% and SRH in 45.4%. There were 99 male and 92 female subjects (51.8% and 48.2%, respectively) in the SSH group (P = 0.67) and 86 male and 73 female subjects (54.1% and 45.9%, respectively) in the SRH group (P = 0.25).
Lens opacity was higher in the HT group than in the control group, and in the SSH group versus the SRH group (except in the group of males <50 years of age). The results are shown in Tables 1 –3.
Demographic Characteristics of the Cases by the Control and Hypertension Groups According to Age Groups
Student's t test.
Pearson's chi-squared test.
HT, hypertension; BMI, body mass index.
Lens Opacity Incidence by Control and Hypertension Groups According to Age Groups
Continuity corrected chi-squared test.
Pearson's chi-squared test.
Lens Opacity Rates in the Salt-Sensitive and Salt-Resistant Hypertension Groups According to Age Groups
Continuity corrected chi-squared test.
Fisher's exact test.
Pearson's chi-squared test.
The 24 hr urine Na, Cr excretion, and urine volume measurements for the SSH group were 191.6 ± 37.4 mmol, 1222 ± 376 mg, and 1.75 ± 0.48 L, respectively. In the SRH group, these values were 150.3 ± 32.8 mmol, 1234 ± 401 mg, and 1.69 ± 0.53 L, respectively. In the control group, these values were 148.6 ± 33.8 mmol, 1294 ± 442 mg, and 1.79 ± 1.36 L, respectively.
In the control group, the corresponding NaCl values for 24-hr urine Na excretion were 5.2–12; 8.68 ± 1.9g. NaCl values corresponding to 24 hr urinary Na excretion of the SSH and SRH groups are shown in Table 4.
Comparison of Salt-Sensitive and Salt-Resistant Hypertensive Patients Clinical Characteristics
The comparisons between salt-resistant and salt-sensitive groups.
The comparisons within salt-resistant and salt-sensitive groups and overall cases.
Student's t test.
Mann–Whitney U test.
Pearson's chi-squared test.
Continuity corrected chi-squared test.
Fisher's exact test.
Likelihood ratio test.
BP dif., mean blood pressure difference with Na diet; SD, standard deviation; LVH, left ventricular hypertrophy.
BP changes with NaCl intake, 24-hr salt intake differences, HT duration, HT stage, HT retinal grade, and LVH differences in patients with SRH and SSH are shown in Table 4.
Opacity diameters ranged from 20 to 600 μm. The diagnostic performance of using total lens opacity to detect SSH in hypertensive patients is shown in Table 5.
The Diagnostic Performance of Using the Total Lens Opacity to Detect Salt-Sensitive Hypertension in Hypertensive Patients
The values in brackets indicates lower and upper limits of 95% confidence intervals.
Continuity corrected chi-squared test.
Fisher's exact test.
Pearson's chi-squared test.
PPV, positive predictive value; NPV, negative predictive value.
Comparison of cases with and without lens opacities
In the HT group, there was no statistically significant difference in mean age, male–female distribution, BMI, duration of HT, LVH (P > 0.05) between cases with lens opacities and cases with no lens opacities. Salt intake, HT stage, HT retinal grade, Na+, BP change, and SSH ratio were significantly higher in patients with lens opacities compared with those without lens opacities (P < 0.05). The results are summarized in Table 6.
Demographic and Clinical Characteristics in Terms of Total Lens Opacity Among Hypertensive Patients
Student's t test.
Mann–Whitney U test.
Pearson's chi-squared test.
Multivariate logistic regression analysis
In the multivariate forward-looking logistic regression analysis to distinguish cases with no lens opacity and cases with lens opacities, the most significant factors were salt intake, HT stage, HT type, and BP change.
When the effects of other factors were kept constant, every 1 gram increment in salt intake increased the probability of lens opacification by 1.239-fold. Each 1 gram increment in salt intake increased the likelihood of lens opacification by 3.563-fold in those with SSH. Each 1 mmHg change in mean BP under the Na diet was found to increase the probability of opacity by 1.213 times. The results are summarized in Table 7.
The Results of Multiple Logistic Regression Analysis for Determining the Best Predictors Which Effect on the Existence of Lens Opacity Among Hypertensive Patients
OR, odds ratio; CI, confidence interval.
In terms of the selected antihypertensive agents, angiotensin-converting enzyme inhibitors ± Ca antagonists were being used by 146 patients (41.7%), angiotensin receptor blockers ± Ca antagonists by 130 (37.1%), a Ca antagonist alone by 50 (14.2%), and β-blockers by 24 (6.8%). No significant association was detected between the use of antihypertensive agents and lens opacity existence in female or male patients (P > 0.05).
Discussion
Na+/K+-ATPase in lens circulation and SSH
Lens circulation is composed mainly of water, Na+, K+, and lactate. The transparency of the whole lens is largely based on epithelial cell permeability and Na+/K+-ATPase activity. Circulation starts from the anterior and posterior polar regions, passes through the center, and reaches the equatorial region. 16 Circulation is activated by Na+/K+-ATPases, which are present at 20-fold normal concentrations, particularly in the equatorial than in the anterior epithelial cells. The anterior and equatorial regions of the lens differ in terms of Na pump function, gap junction distribution, and growth factor receptor function. 17,18
The impaired enzyme activity disrupts the influx–efflux balance, which may lead to swelling and opacification, particularly in the equatorial peripheral fibers, upon accumulation of water and Na, which must exit. 19 –21
An increase in intracellular Na+, which is induced by inhibiting Na+/K+-ATPases by endogenous cardiotonic steroids (CTSs) released from the adrenal cortex during chronically high salt intake, causes an increase in the cytosolic concentration of Ca2+ and vascular contraction via Na+/Ca2+ exchanger type 1. The same mechanism causes an increase in the cardiac inotropic effect 22 as shown in Fig. 2.
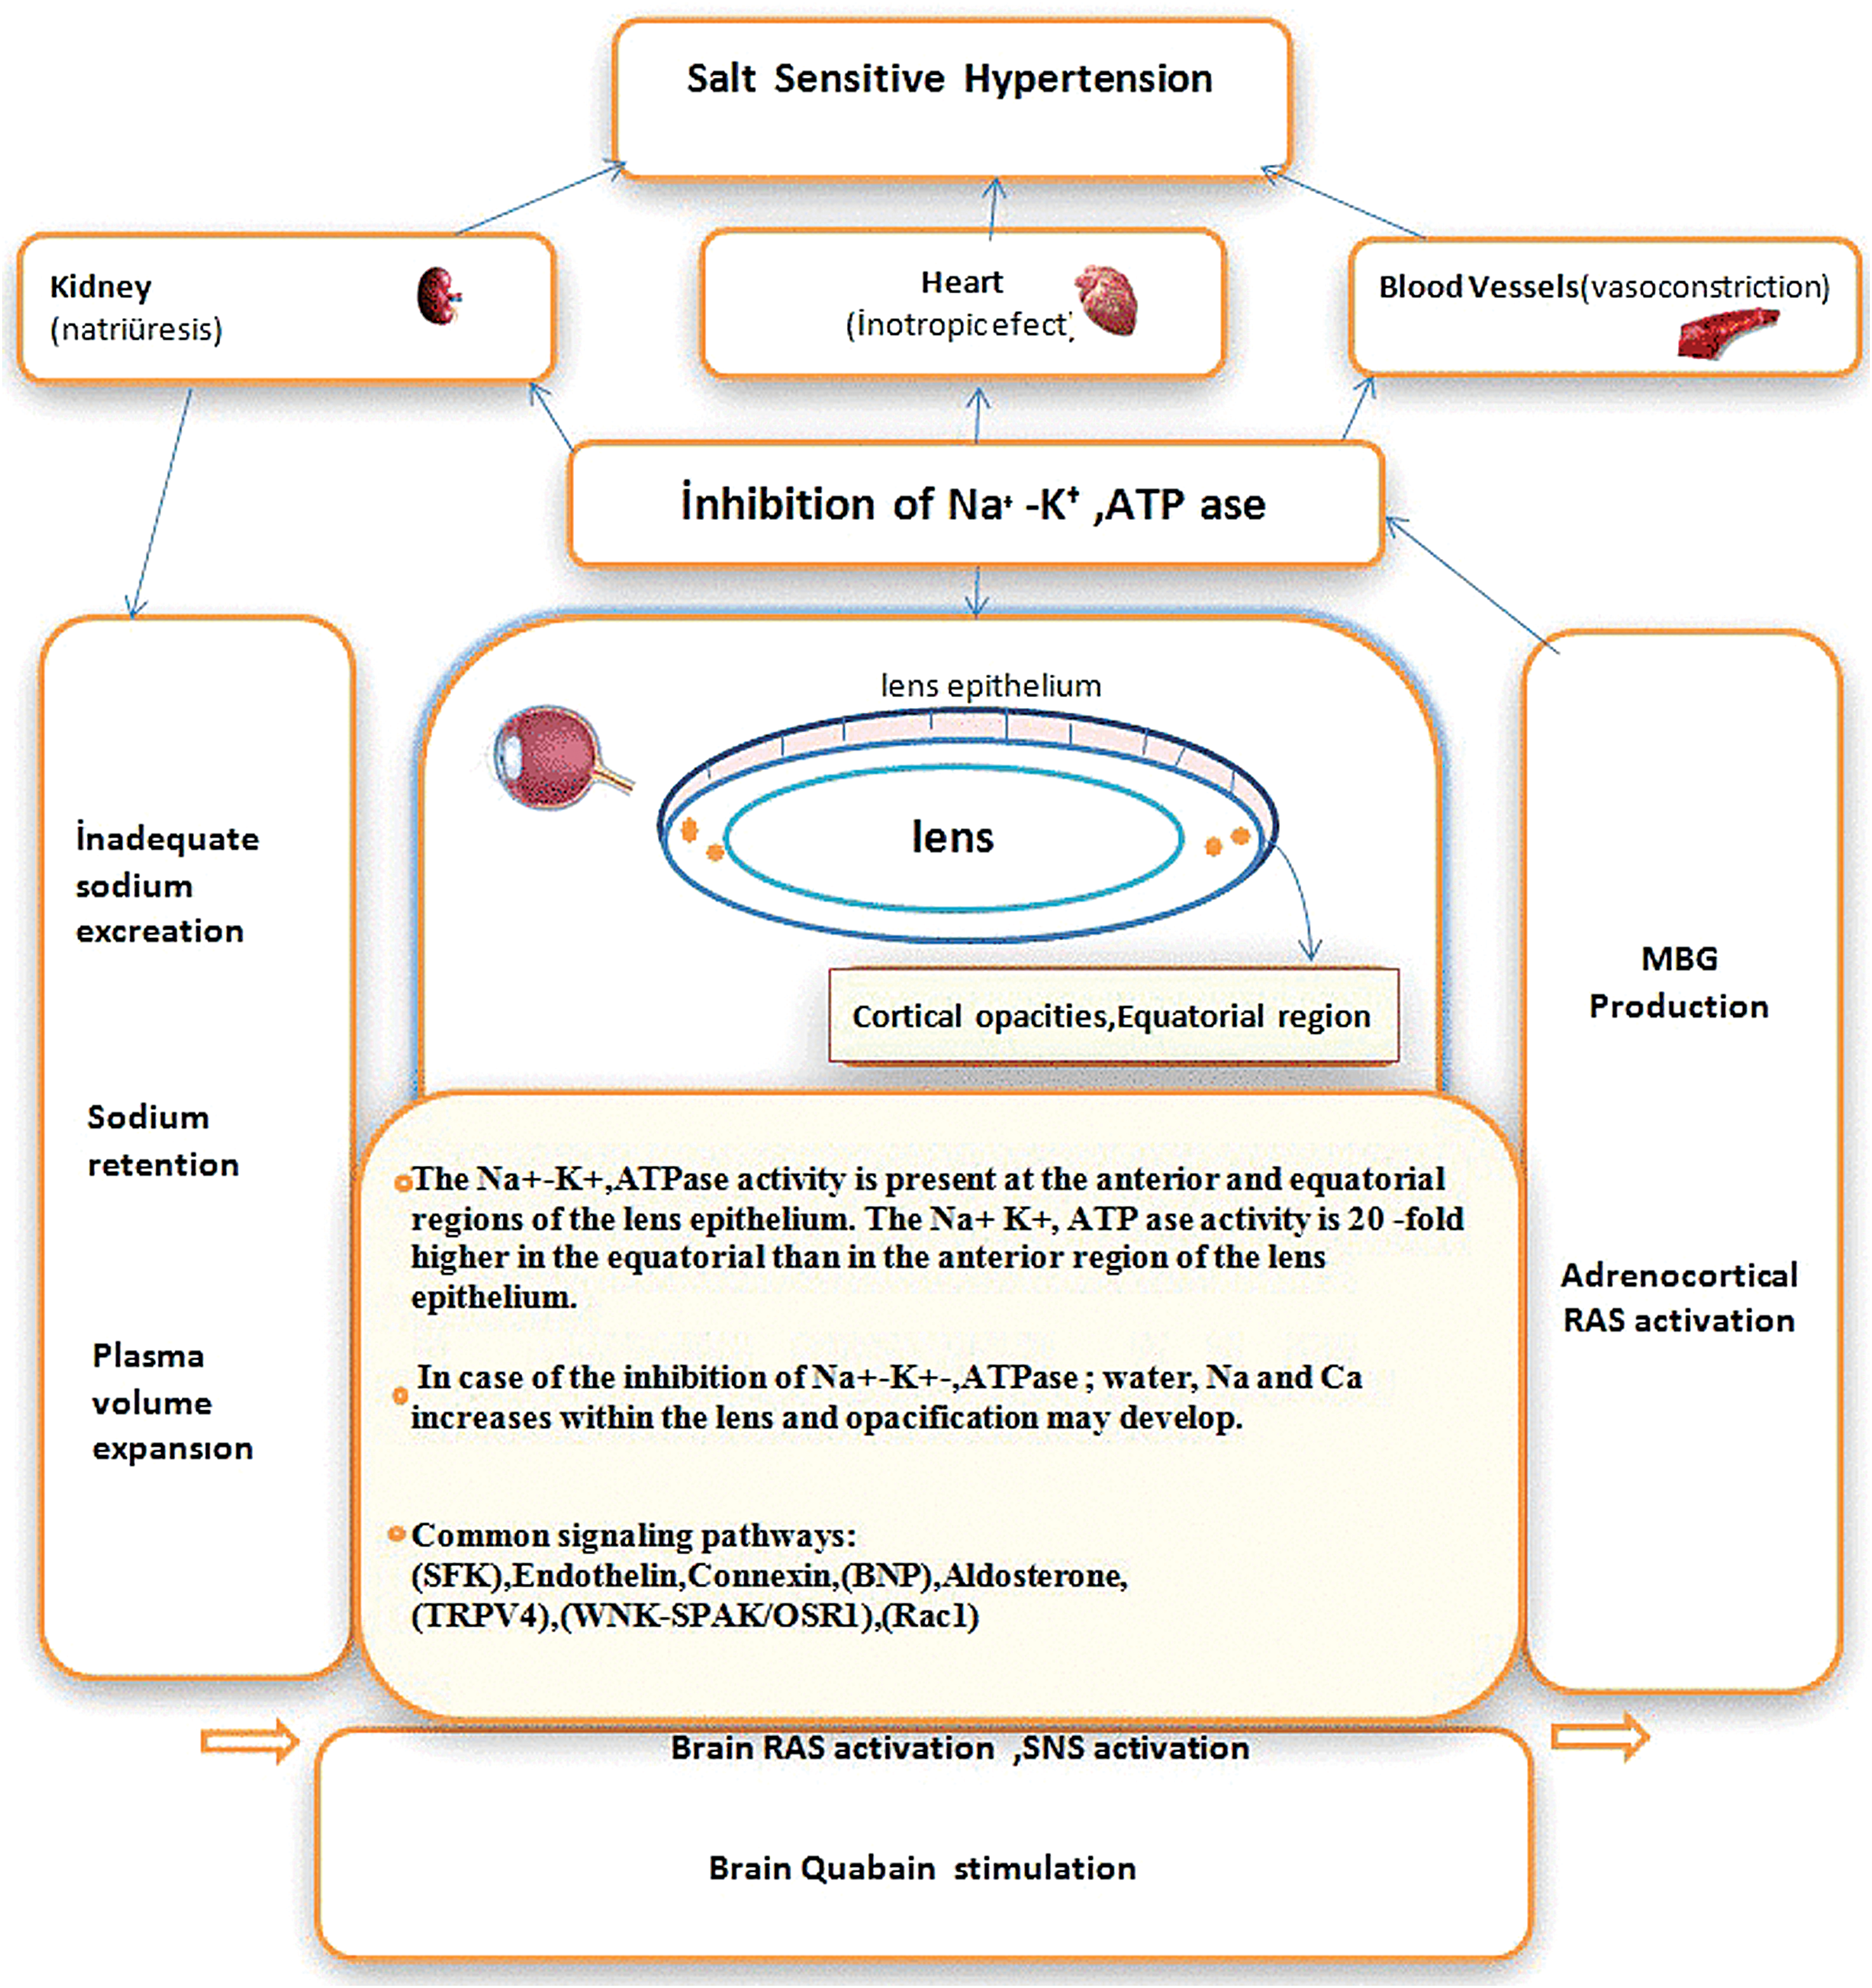
Potential mechanism of salt-sensitive hypertension and lens opacity. SNS, sympathetic nervous system; RAS, renin angiotensin system; MBG, marinobufagenin (cardiotonic steroid). Color images are available online.
Increases in CTS and reactive oxygen species (ROS) may stimulate Na+/K+-ATPase signaling-mediated events such as renal Na handling in proximal tubules, induced uremic cardiomyopathy, and high fat diet-induced adipogenesis. 23
The presence of Ca2+ is important for Na+ permeability in the lens membrane. 24 In rabbits, intracellular Na+ increased 3.5-fold and Ca2+ nine-fold after lens opacity was induced. 25 Small opaque shades develop deep within the equatorial cortex of the lens, starting from the age of 40 to 50 years and gradually develop into segmental and annular opacities. 26 Endogenous CTSs inhibit Na+/K+-ATPases in the lens epithelium. The Na+/K+-ATPase activity in the lens was lower in rabbits feeding on high amounts of salt compared with those feeding on low amounts. 27
Other common mechanisms in the formation of SSH and peripheral lens opacification
The mechanisms associated with SSH pathogenesis 28 are important to the physiology of the lens epithelium.
ROS and second messengers, which are activated by the Src family kinase (SFK), are induced by an endogenous CTS (ouabain) and mediate the regulatory effects of Ca2+ on Na/K-ATPases. 29 SFK regulates an epithelial Na+ channel (ENaC) associated with the pathogenesis of SSH in whole cell currents. 30,31 Endothelin-1 is effective in treating SSH. 32 It increases vascular tonus by inhibiting ENaC and inhibiting Na+/K+-ATPases via SFK activation in the lens epithelium. 33 SFK activity is greater in the lens equatorial than in the anterior region. 34 Zhou and Menko established that SFK activity increases stress-induced signaling pathways in an avian model of spontaneous cataracts. 35 The level of connexin 43, which exists at very high levels in the anterior epithelium of the lens, was increased 3-fold in deoxycorticosterone acetate-salt hypertensive rat aortas. 36
A defect in brain natriuretic peptide identified in salt-sensitive rats is likely to be related to systemic HT. 37 Natriuretic peptide receptors are expressed by lens epithelial cells and may have a potential role in maintaining epithelial cell hemostasis. 38 Aldosterone levels in the lens epithelium are significantly higher in hypertensive patients with cataracts, 39 and a high level of aldosterone and low level of N-terminal-atrial natriuretic peptide are likely salt-sensitive markers. 40
In the lens epithelium, activation of the transient receptor potential cation channel subfamily 4 (TRPV4) ion channel upon osmotic- or damage-induced swelling activates SFKs and increases Na+/K+-ATPase activity. 41 TRPV4 ion channel function is decreased in SSH. 42 The newly defined cation-chloride regulator, the WNK-SPAK/OSR1 signaling pathway, regulates urinary Na+ excretion in addition to arterial tonus in SSH. 43 Inhibition of this pathway, which occurs in human lenses, impairs lens transparency. 44
In salt-sensitive animals, Ras-related C3 botulinum toxin substrate (Rac1) activation due to salt loading activates mineralocorticoid receptors in renal tubules 45 . Rac1 also induces the proliferation of lens epithelial cells, leading to the development of cataracts. 46
Most studies have established that the aqueous Na+ levels are similar to its plasma levels. 47 Increased plasma Na+ (>140 mM) increases vascular tonus although osmolarity may not change. 48 Our results are consistent with studies reporting a close relationship between dietary salt intake and LVH. Sodium is believed to induce LVH by activating the sympathetic nervous system and the RAAS and hence, by increasing preload. 49,50 The presence of LVH had no effect on lens opacity.
The incidence rates of cortical lens opacity in HT patients (n = 4926) within age groups similar to those used in our study were reported to be 0.8%, 6.8%, 18.6%, and 31.2%, respectively. 51 Since salt intake was not included in the study mentioned above, it is not possible to make a comparison with our study.
The significant differences in HT duration, HT stage, HT retinal grade, and LVH parameters in the SSH and SRH groups imply that salt may affect SSH more than it affects SRH.
In the renal proximal tubulus, 60% of the filtered Na + is reabsorbed via the sodium/hydrogen Na+/H+ exchanges (NHE 3; apical Na entry) and the Na+/K+-ATPase (basolateral Na extrusion). The coordinated and coupled regulation of NHE3 and the Na+K+-ATPase is important in maintaining intracellular Na+ homeostasis and extracellular fluid volume. 52 Excessive chronic oxidative stress may create experimental SSH by reducing the Na+/K+-ATPase signaling function. 6,52 In laboratory experiments, hydrogen peroxide, a type of ROS, stimulated Na+/H+ exchange in the lens by 194%. 53 The imbalance between nitric oxide and reactive ROS may induce endothelial dysfunction leading to cardiovascular complications. 54
The presence of opacities in the equatorial cortical region beneath the peripheral iris, in which intense Na+/K+-ATPase activity is observed, eliminates the possibility of a light effect. The distance from the opacity to the nucleocortical junction can give the approximate formation time. 55
Study limitations
Multiple 24-hr urine collections are required to estimate an individual's actual salt consumption. Limitations include patients' measurements of their own BP, changeable diameter selection for opacity positivity, probability of salt leakage from feces and sweat, 56 and probability of salt leakage from inadequate collection of urine.
Conclusions
Peripheral cortical opacities of the lens in hypertensive patients with similar ages and BMIs were found to be related to greater salt intake, increased BP response to salt intake, more advanced HT stage, and HT retinal grade. Lens opacity contributes to the diagnosis of SSH with a sensitivity of 75.4% (95% CI: 68.6–81.3) and specificity of 83.6% (95% CI: 77.0–89.0) at ages between 40 and 80 years.
Footnotes
Acknowledgments
We thank Internal Medicine Specialist Dr. Zuhal Koç and the clinical nurses for their contribution to this study.
Author Disclosure Statement
No conflicting financial interests exist.