
Abstract
Background:
Applying the hyperinsulinemic-euglycemic clamp to estimate insulin resistance (IR) is accurate but time-consuming, so identifying a simple and effective index for IR is vitally important. The present study aimed to compare the lipid accumulation product (LAP), visceral adiposity index (VAI), body mass index (BMI), waist circumference (WC), homeostasis model assessment of insulin resistance (HOMA-IR), and Chinese visceral adiposity index (CVAI) using the hyperinsulinemic-euglycemic clamp as a reference and to screen a simple and effective indicator for IR in Chinese women of childbearing age.
Methods:
The present study included a cross-sectional study of 537 reproductive-aged women and an interventional study of 90 randomly chosen polycystic ovarian syndrome (PCOS) women. Physical, laboratory, and hyperinsulinemic-euglycemic clamp were completed, and the BMI, WC, LAP, VAI, CVAI, and HOMA-IR were calculated. A linear correlation and a receiver operating characteristic curve were performed. After intervention with metformin, the effects were estimated in the third month.
Results:
PCOS women had worse glycometabolism, serum lipid metabolism and IR, and higher prevalence rates of metabolic disorders than those without PCOS. The CVAI was strongly associated with the M value (r = −0.6953, P < 0.0001) and outperformed other parameters with the largest area under the curve (0.903) and Youden index (71.07%) for IR diagnosis in Chinese reproductive-aged women, and the diagnostic point was >28.5. After 3 months of metformin therapy, IR improved with remarkable increases in M value and reductions in the CVAI.
Conclusion:
The CVAI can be used as an appropriate surrogate indicator for the hyperinsulinemic-euglycemic clamp to identify IR in Chinese women of childbearing age. The interventional trial part of this study has been registered as a clinical trial (no. ChiCTR-IIR-16007901).
Introduction
Insulin resistance (IR) has been widely confirmed to be involved in the pathogenesis and development of many diseases, including polycystic ovarian syndrome (PCOS), metabolic syndrome (MetS), and type 2 diabetes mellitus (T2DM). Since IR can precede typical clinical manifestations by many years, screening and estimation of IR are necessary in high-risk populations, such as patients with PCOS, a heterogeneous syndrome with a high risk of IR, and consequent metabolic disorders. 1 –3 The hyperinsulinemic-euglycemic clamp, developed by DeFronzo et al. in 1979, is internationally accepted as the gold standard for estimating IR. 4 Despite its accuracy, the disadvantage of time-consuming obviously limits the hyperinsulinemic-euglycemic clamp's practical use in large populations and community medical centers. 5,6 With an unmet need for surrogate methods to identify IR, simplified indices have been proposed because of their efficiency and lower cost, such as the visceral adiposity index (VAI), lipid accumulation product (LAP), body mass index (BMI), and waist circumference (WC). However, no studies have carefully compared these indices and filtered the best one.
Recently, a novel model for the Chinese population called the Chinese visceral adiposity index (CVAI) was proposed by Xia et al. to reflect the visceral adipose volume. The study showed that the CVAI was superior to other indicators in predicting IR, MetS, hypertension, and prediabetes in a Chinese population aged 53–77 years. 7 However, in these previous studies, the diagnosis of IR was based on homeostasis model assessment of insulin resistance (HOMA-IR) instead of the hyperinsulinemic-euglycemic clamp. The reproductive-aged women with PCOS frequently present IR and are a good model for studying the assessment of IR and treatment effects. Whether these indices can be applied to the Chinese population remains unclear.
This study defines IR using the hyperinsulinemic-euglycemic clamp, compares these popular indicators in Chinese women of childbearing age, and verifies them in Chinese PCOS patients, aiming to determine a more appropriate index and cutoff value of IR for diagnosis and therapeutic monitoring.
Methods
Subjects and diagnostic criteria
We included 537 women of childbearing age (ranging from 16 to 40 years) who first visited the Department of Endocrinology or Gynecology of the Second Affiliated Hospital of Chongqing Medical University. For these women, 387 were newly diagnosed with PCOS (PCOS group), and 150 were not (Non-PCOS group). After enrollment, all participants were directed by the doctors to carry out regular lifestyle interventions. The diagnosis of PCOS was based on the Rotterdam PCOS consensus criteria, 8 and abnormal glucose metabolism included prediabetes and diabetes mellitus and was defined as fasting plasma glucose ≥6.1 mmol/L and/or 2 hours postprandial blood glucose ≥7.8 mmol/L. 9 The diagnostic criteria of MetS was referenced in a previous study. 7
Subjects were excluded if (1) they were pregnant or intended to conceive; (2) they had other similar diseases that mimic the manifestation of PCOS, such as thyroid disease, Cushing syndrome, congenital adrenal-hyperplasia, or type 1 diabetes; (3) they used drugs that might interfere with the results within 1 month; and (4) they had incomplete recorded information.
Study design
All participants underwent a complete physical examination (weight, height, WC, and blood pressure) by two researchers using standardized protocols from the World Health Organization (WHO). Bioelectrical impedance (BIA-101; RJL Systems) was used to measure the percentage of body fat. Blood samples were collected after an overnight fast of at least 8 hrs, and examinations for fasting glucose, fasting insulin, and blood lipid spectra were performed at the laboratory unit of the Second Affiliated Hospital of Chongqing Medical University. The hyperinsulinemic-euglycemic clamp test was performed to assess insulin sensitivity according to the protocol described by DeFronzo et al. 4 The lower end of this rate of glucose disposal (M value <6.28) was used as the quantitative estimate of IR. All clinical data of participants were collected at the initial visit. Then, 90 PCOS women were randomly selected to receive 3 months treatment of oral metformin 850 mg twice a day using a random number table. All the participants signed an informed consent form and were informed of the possible side effects, and treatment was initiated after the baseline assessment.
Definitions
BMI (kg/m2) was calculated as weight (kg) divided by height in meters squared (m2). The LAP, VAI, and CVAI were calculated as follows: VAI (females) = [WC (cm)/(36.58 + [1.89 × BMI])] × [triglyceride, TG (mmol/L)/0.81] × [1.52/high-density lipoprotein cholesterol, HDL-C (mmol/L)] 10 ; LAP (females) = [WC (cm) −58] × TG (mmol/L) 11 ; CVAI (females) = −187.32 + 1.71 × age +4.23 × BMI +1.12 × WC (cm) +39.76 × Log10TG (mmol/L) −11.66 × HDL-C (mmol/L). 7 The HOMA-IR was calculated as follows: HOMA-IR = fasting glucose (mmol/L) × fasting insulin (μU/mL)/22.5. 12
Statistical analysis
Statistical Package for Social Sciences version 23.0 (SPSS, Chicago, IL) was used to perform statistical analyses. The normal distribution of quantitative variables was assessed by the Shapiro–Wilk test, and data with a skewed distribution were presented as median and first to third quartiles. Differences between groups were assessed using independent sample Student's t-test for normally distributed variables and the Mann–Whitney U test for nonnormally distributed variables. Categorical data were expressed as percentages and compared with Fisher's exact test or Pearson's chi-squared test. The differences between baseline and the third month data in the intervention trial were assessed by the Wilcoxon signed-ranks test. The linear correlation was evaluated by Spearman correlation analysis since the data were skewed. A receiver operating characteristic (ROC) curve analysis and areas under the ROC curve (AUCs) were performed by MedCalc version 15.6.1 and applied to compare the diagnostic performance and to determine appropriate cutoff points. In addition, the optimal cutoff values were identified from the maximum Youden index (sensitivity + specificity −1) to determine the appropriate parameters. A two-tailed P value <0.05 was considered indicative of statistical significance.
Results
Baseline characteristics
The present study collected data as completely as possible from 387 PCOS patients and 150 controls without PCOS. Comparisons of the clinical characteristics of the two groups are presented in Table 1. The PCOS group tended to have clearly higher weight, BMI, body fat, WC, waist-to-hip ratio, systolic blood pressure, VAI, CVAI, glucose, insulin, glycosylated hemoglobin (HbA1c), TG, total cholesterol (TC), low-density lipoprotein cholesterol (LDL-C), HOMA-IR, LAP, and lower M values compared with the non-PCOS group (P < 0.05). The mean value of the CVAI in PCOS patients was significantly higher than that in non-PCOS women [56.24 (30.92 to 79.84) vs. 7.00 (−5.69 to 26.09)]. Moreover, the PCOS group showed a higher IR level with a lower M value [4.65 (3.47–6.29) mg/min/kg] than the non-PCOS group [9.02 (7.36–11.48) mg/min/kg]. In comparison to the non-PCOS group, the PCOS group had a higher prevalence of IR, MetS, and abnormal glucose metabolism (P < 0.05).
The Baseline Characteristics of Women With or Without Polycystic Ovarian Syndrome
Quantitative variables: values are represented as the median and first to third quartiles and were analyzed using independent sample Student's t-test or the Mann–Whitney U test. Categorical data: values are represented as percentages and were analyzed using Fisher's exact test or Pearson's chi-squared test.
P < 0.05 compared with controls.
BMI, body mass index; CVAI, Chinese visceral adiposity index; DBP, diastolic blood pressure; FFA, free fatty acid; HbA1c, glycosylated hemoglobin; HDL-C, high-density lipoprotein cholesterol; HOMA-IR, homeostasis model assessment of insulin resistance; IR, insulin resistance; LAP, lipid accumulation product; LDL-C, low-density lipoprotein cholesterol; MetS, metabolic syndrome; PCOS, polycystic ovarian syndrome; SBP, systolic blood pressure; TC, total cholesterol; TG, triglyceride; VAI, visceral adiposity index; WC, waist circumference; WHR, waist-to-hip ratio.
Parameters for predicting IR
Figure 1 provides the correlations of the six parameters with M value in Chinese women of childbearing age. The ROC curves of BMI, WC, VAI, CVAI, LAP, and HOMA-IR for assessing IR in Chinese reproductive-aged women are shown in Fig. 2, and the details of the optimal cutoff values, AUCs, sensitivity, specificity, and Youden index of the six indices are shown in Table 2. We observed that the CVAI was strongly associated with M value (r = −0.6953, P < 0.0001), and the Spearman correlation coefficient was higher than other indices, including BMI, VAI, LAP, WC, and HOMA-IR (Fig. 1). Moreover, the CVAI had the largest AUC [0.903 (95% confidence interval: 0.875–0.927)], followed by BMI, and then HOMA-IR (P > 0.05 both compared with the CVAI). The AUCs of LAP, WC, and VAI were significantly lower than that of the CVAI (P < 0.05). In addition, compared to other indicators, the CVAI had the largest Youden index (71.07%), and the optimal cutoff value of the CVAI was 28.5 (Fig. 2 and Table 2).
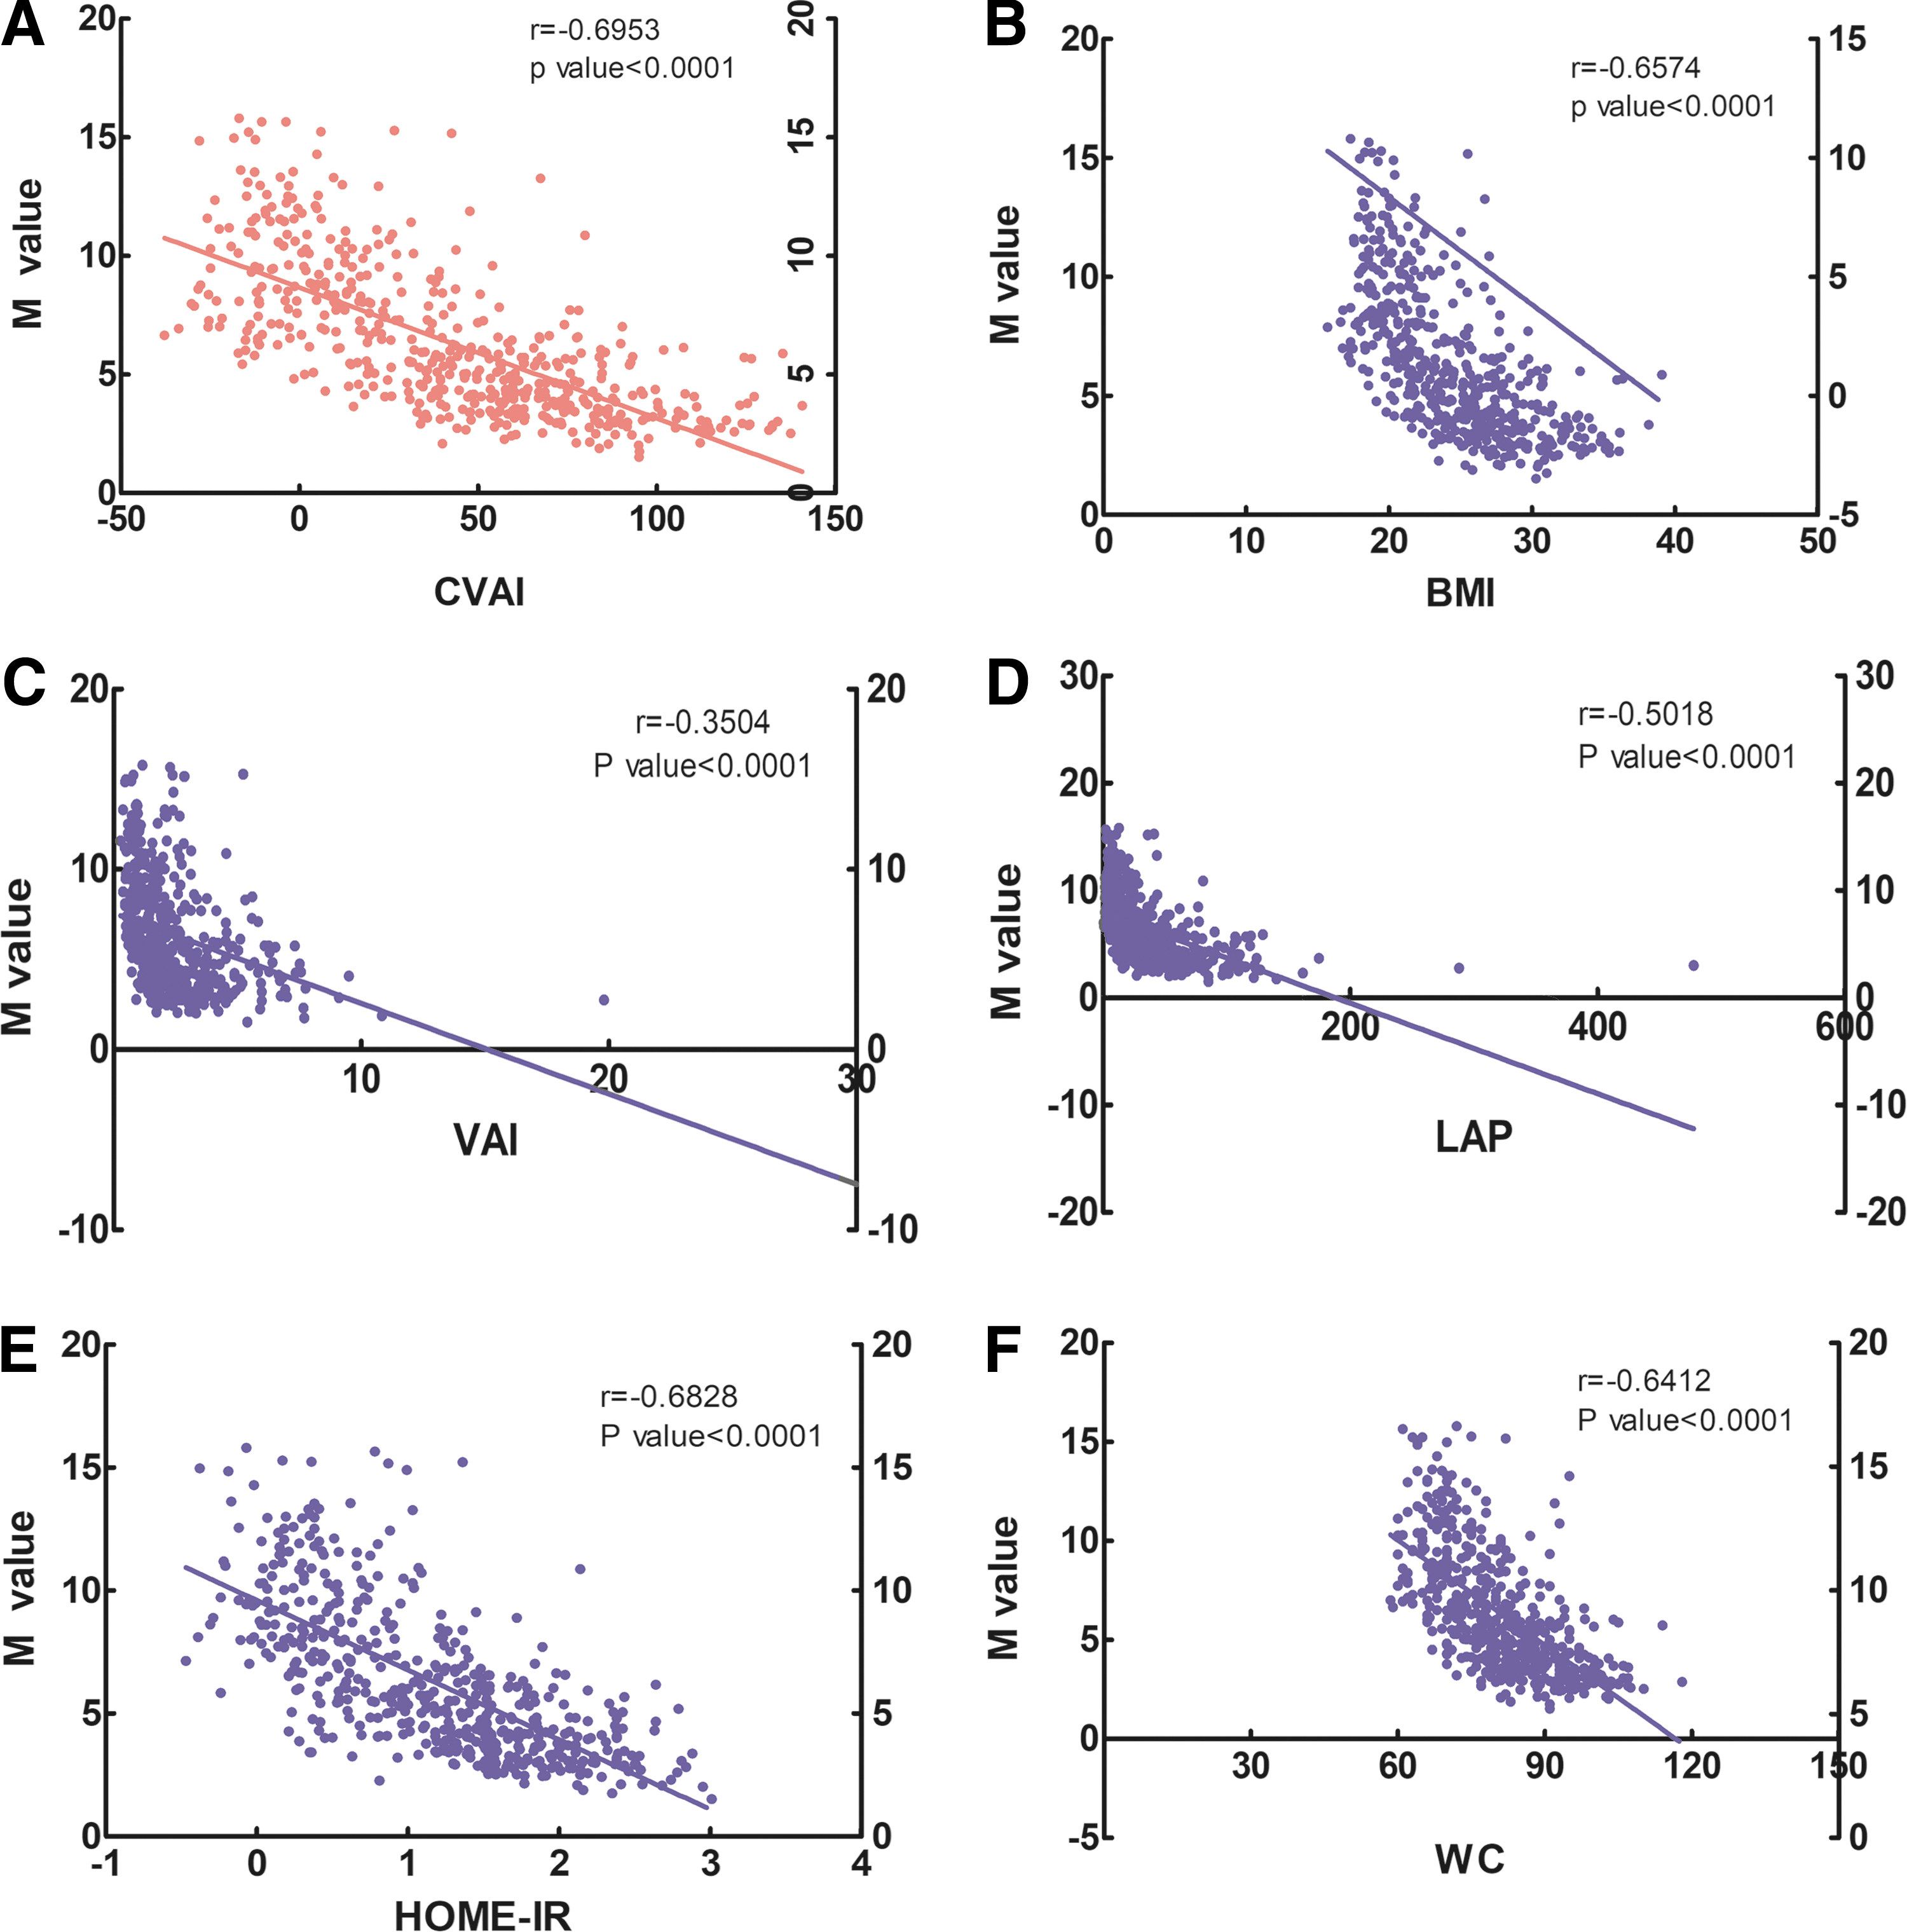
Correlation about the six parameters with the M value in Chinese women of childbearing age r, correlation coefficient P < 0.0001, and analyzed using Spearman correlation analysis. Correlation between CVAI and M value
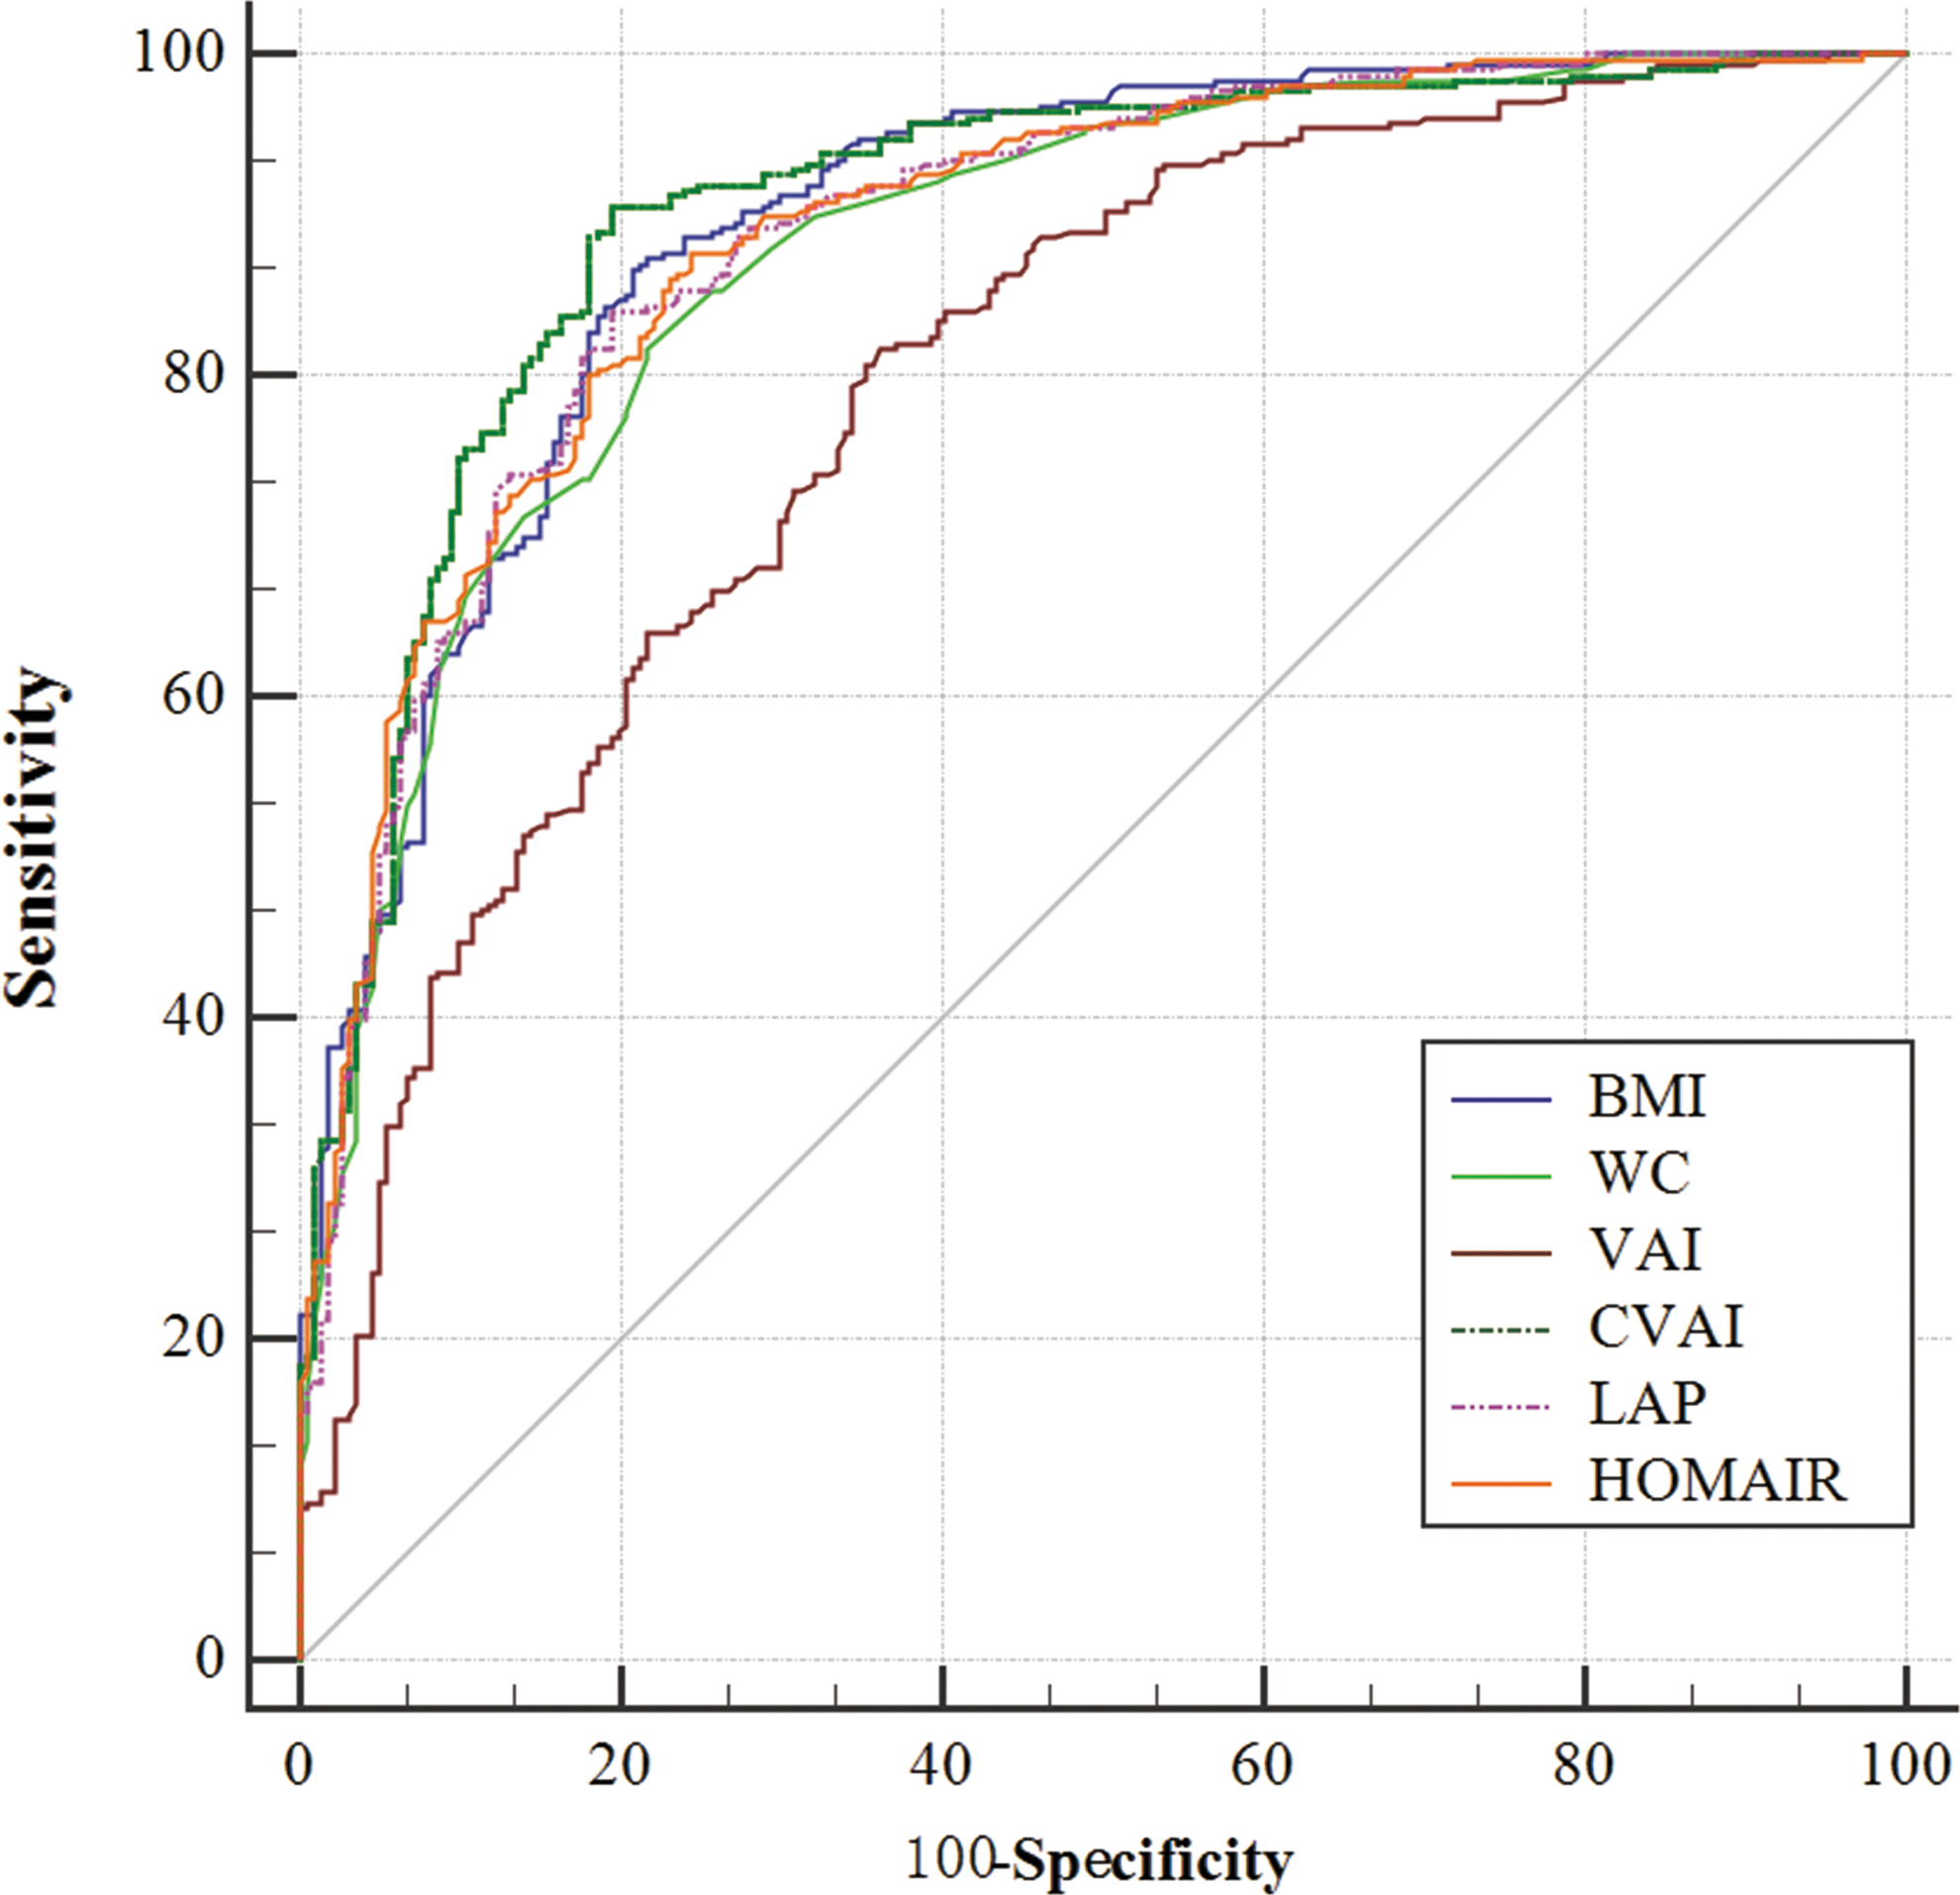
The ROC curves for the six indices to estimate insulin resistance in Chinese reproductive-aged women. Correlation about the six parameters with M value in Chinese women of childbearing age. ROC curve about the six indexes. ROC, receiver operating characteristic. Color images are available online.
The Optimal Cutoff Values, Area Under The Curve, Sensitivity, Specificity, Youden Index of Body Mass Index, Waist Circumference, Visceral Adiposity Index, Chinese Visceral Adiposity Index, Lipid Accumulation Product, and Homeostasis Model Assessment of Insulin Resistance for Estimating Insulin Resistance from Receiver Operating Characteristic Curves
P value of AUCs of other indices compared with CVAI.
P value of the AUC was <0.01.
95% CI, 95% confidence interval; AUCs, areas under the ROC curve; ROC, receiver operating characteristic.
Changes after 3 months of metformin intervention
Eighty participants completed the 3-month single-arm prospective intervention trial. Five subjects discontinued therapy due to pregnancy, and five additional patients dropped out due to poor compliance or loss to follow-up. After 3 months of metformin treatment, the M value significantly increased by +0.73 mg/kg/min, while the CVAI changed by −7.01 (P < 0.05). Regarding other parameters, weight, WC, BMI, body fat, VAI, HOMA-IR, LAP, insulin, HbA1c, LDL-C, TC, and free fatty acid values exhibited distinct reductions with statistically significant differences (Table 3).
Changes from Baseline to the Third Month After Metformin Treatment on Parameters
Values are represented as the median and first to third quartiles; P, analyzed using Wilcoxon signed-ranks tests.
Discussion
In the present study, the results showed that the CVAI, with the largest AUC (0.903) and Youden index (71.07%), performed better than other indices for predicting IR in Chinese women of reproductive age, using the hyperinsulinemic-euglycemic clamp as a reference.
PCOS is the most common endocrinopathy of reproductive-aged women, inducing worse glycometabolism and lipid metabolism and a higher prevalence of metabolic disorders. 13 In addition, excess weight is frequently observed in women with PCOS, with a pooled estimated prevalence of 49% for obesity and 54% for central obesity, as shown by a recent meta-analysis. 14 The results of the present study also observed this worse metabolic characteristic when comparing baseline characteristics of PCOS women with those of women without PCOS. Moreover, obesity and serum lipid metabolism are closely interconnected with IR, and together, they may contribute to the development of T2DM and MetS. 15 Previous studies noted that the volume and proportion of visceral fat and subcutaneous fat determined the impact of obesity on IR. Du et al. proposed that subcutaneous fat might act as a protective depot by storing fat and preventing undesired lipid deposition in vital organs unless serum lipid levels exceed the capacity of the subcutaneous fat. 16 Visceral adipose tissue acts as the “bad” adipose tissue and promotes IR occurred through oxidative damage, excessive secretion of adipocytokines, and elevated levels of fasting TG. 17,18
WC is regarded as an effective indicator of central obesity, yet, it cannot sufficiently discriminate between visceral and subcutaneous fat in the abdominal region. 19 BMI is generally accepted as an index for evaluating the degree of obesity and is believed to be strongly correlated with IR. However, IR can be detected in lean PCOS women, while insulin sensitivity was found in a subset of PCOS women who are overweight or obese. This finding indicated the heterogeneity of obesity and the limitation of BMI in evaluating the risk of IR in the PCOS population. 1,20 HOMA-IR, a model formula calculated from fasting blood glucose and insulin levels, was used as the primary reference in many studies on IR. However, in a healthy nondiabetic population, surrogates of insulin action are not sufficiently efficient and do not appear to offer advantages over fasting plasma insulin concentration. 21 Moreover, the normal glucose-tolerant population had a narrow range of fasting glucose levels and a wide range of insulin sensitivity levels.
The VAI is a model formula calculated from BMI, WC, TG, and HDL and was proposed by Amato et al. to estimate visceral fat content in Italians. 10 LAP, which is composed of WC and TG levels, is another mathematical model established by Kahn based on data from 9180 Americans. 11 Because increased fasting TG can reflect the status of an individual's excess fat over the storage capacity of subcutaneous fat depots in the presence of an elevated WC, the compound indices LAP and VAI are therefore regarded as better indicators of IR. A series of studies validated the IR diagnostic performance of the VAI and LAP in women with PCOS, but only a few provided an optimal cutoff value. Previous studies have shown that both the VAI and LAP are good predictors of IR in PCOS women of different ethnicities and that the cutoff for the VAI was 1.6–2.19, while the cutoff for LAP was 18.24–33.8 when predicting IR. 5,22 The definitions of IR in the two studies above were based on HOMA-IR, while the present study defined IR based on the M value calculated from the hyperinsulinemic-euglycemic clamp.
Our results showed that the cutoff values of the VAI and LAP are 1.58 and 24.38, respectively, in Chinese women of childbearing age. The cutoff values of the VAI and LAP vary in different trials, indicating their heterogeneity in different ethnicities. Moreover, the different reference standards of IR in the documents may result in diversity.
The CVAI is composed of age, BMI, TG, HDL, and WC. The CVAI was established based on data from the Chinese population by multivariate linear regression analyses and was verified in 6495 Chinese subjects aged 53–77 years. 7 The present study focused on a population of reproductive-aged women and attained accordant conclusions. Consistent with the previous study, 7 our results demonstrated that the CVAI was well correlated with the M value in Chinese women of childbearing age. In diagnostic tests of the ROC curve, the CVAI outperformed other parameters in identifying IR in Chinese reproductive-aged women with the largest AUC (0.903), and the differences in AUCs were statistically significant. In addition, we found that the CVAI had the largest Youden index, the highest sensitivity, and higher specificity. On the one hand, PCOS patients are at high risk of metabolic abnormalities, and they must receive further clinical intervention once IR occurs, so screening out those patients with IR sensitively must be the first consideration. On the other hand, PCOS with IR is an aggravating disease that consumes patients' energy, money, and time, and so, it is very important to improve diagnostic accuracy.
In addition, increasing age is a risk factor for diabetes mellitus, which has been proved in Chinese adults based on a representative sample of 46,239 subjects. 23 The CVAI considers the influence of age on IR, so it may be more appropriate for clinical application. The cutoff value of the CVAI in the present study was 28.5 when predicting IR, which was markedly lower than the cutoff value reported by Wu et al. 24 This previous study concluded that the CVAI was effective in predicting diabetes and prediabetes over 5 years in Chinese adults, with cutoff values of 89.65 when predicting diabetes and 71.61 when predicting prediabetes in females, values that are higher than those found in our study. One possible reason for these differences is that the CVAI was used to predict the progressive outcome of diabetes in the previous study, 24 while our study aimed to use the CVAI to screen out subjects with IR. In addition, the previous study excluded younger participants aged <25 years, 24 and the average age in the study was higher than that of our study, which might result in differences in cutoff values. Nevertheless, calculating an exact cutoff value of the CVAI in women of childbearing age is necessary.
Metformin is an insulin-sensitizing agent that has significantly beneficial effects in women with PCOS through weight loss and the improvement of IR. 25 Consistent with previous studies, the results of our interventional study showed that glycolipid metabolism and IR of PCOS patients improved after 3 months of metformin treatment. The LAP and CVAI reached the most pronounced average reduction, prompting the high sensitivity of the LAP and CVAI when monitoring therapeutic efficacy. In addition, combined with our research results, the AUC and Youden index of the CVAI were larger than LAP, and the CVAI was an appropriate indicator in predicting IR.
In this study, we extended the applicable subjects of the CVAI and confirmed its advantages. Moreover, the use of the hyperinsulinemic-euglycemic clamp might contribute to a more accurate and reliable conclusion. There are, however, some limitations in our study that we should mention. First, this study was not a multicenter trial. In addition, subjects included in this trial were Chinese women, and therefore, conclusions from this study should be cautiously applied to other ethnicities. Moreover, we did not set up a control group in the prospective trial; thus, we observed only the variation tendency of the parameters. Further multicenter randomized controlled trials with larger sample sizes and a longer follow-up period are necessary to clarify the future predictive use of the CVAI for diseases.
Conclusion
We used the hyperinsulinemic-euglycemic clamp as a reference for comparing the advantages and disadvantages of those indicators for the assessment of insulin sensitivity and found that the CVAI, with the largest AUC (0.903) and Youden index (71.07%), was an appropriate indicator for estimating IR and monitoring therapeutic effects in Chinese women of reproductive age. Moreover, because the CVAI is based on easily obtainable and simple physical parameters and lipid profiles, it might become a more appropriate surrogate method instead of the complex hyperinsulinemic-euglycemic clamp, namely CVAI readings of 28.5 or greater could assist in confirming IR in Chinese women of childbearing age.
Ethics Approval and Consent to Participate
The study was approved by the Human Research Ethics Committee of Chongqing Medical University, and all participants signed an informed consent form. We certify that all applicable institutional and governmental regulations concerning the ethical use of subjects were followed during this research. All the authors approved the final version of the article and consented to its publication.
Footnotes
Acknowledgments
The authors thank the Department of Endocrinology and the Department of Obstetrics and Gynecology of the Second Affiliated Hospital of Chongqing Medical University for their assistance in conducting this study. Funding: National Natural Science Foundation of China (81370467); Chongqing Population and Family Planning Commission (2016ZDXM011); Natural Science Foundation of CQ (cstc2017shmsA130069).
Author Disclosure Statement
No competing financial interests exist.