
Abstract
Background:
Insulin resistance (IR) is the common pathophysiology of prehypertension and prediabetes. Recognition of IR in one of the two disease states is critical for carrying out preventive strategies of another disease state. This study aimed to explore which simple IR indexes were significantly associated with prehypertension in subjects with normoglycemia.
Methods:
A total of 108,370 adults without elevated fasting plasma glucose and hypertension were included in this study. The three simple IR indexes [triglycerides to high-density lipoprotein cholesterol ratio, the product of fasting triglycerides and glucose, and metabolic score for IR (METS-IR)] were calculated. Partial correlation was used to analyze the correlation between the three indicators and blood pressure (BP) levels, and logistic regression analysis was used to explore their association with prehypertension.
Results:
Among the three indicators, only METS-IR had positive correlations with systolic and diastolic blood pressure levels. Furthermore, METS-IR was also significantly associated with prehypertension, irrespective of the categorization of waist circumference (WC). The odds ratios of the highest quartile were 2.223 (95% confidence interval [CI]: 2.044–2.417) in all subjects, 2.022 (95% CI: 1.501–2.725) in elevated WC subgroup, and 1.815 (95% CI: 1.620–2.034) in normal WC subgroup.
Conclusions:
METS-IR was associated with prehypertension in normoglycemic Chinese subjects, which bypasses the impact of WC and might be valuable for the management of prehypertension and the prevention of prediabetes in different ethnic groups.
Introduction
Hypertension and type 2 diabetes mellitus (T2DM) have become the two most common diseases in the world, which are also major risk factors for cardiovascular disease (CVD). 1 As the precursors to hypertension and diabetes, prehypertension and prediabetes frequently coexist in the same individual and also increase the risk of CVD. 2 –4 One potential factor responsible for the common pathophysiology of prehypertension and prediabetes is insulin resistance (IR), which is one antecedent of progression to the two different clinical states. 5 Therefore, recognition of IR in one of the two disease states will be of substantial clinical importance for carrying out preventive strategies of another disease state.
Traditional insulin-based IR assessment tools, such as hyperinsulinemic/euglycemic clamp (HEC) and homeostasis model assessment for IR (HOMA-IR) index, are not widely used in primary clinical practice because of their invasiveness, complexity, low practicality, and poor reproducibility. 6 The triglycerides (TG) to high-density lipoprotein cholesterol (HDL-C) ratio and the product of fasting TG and glucose (TyG) are the most commonly used non-insulin-based IR indexes, and have been well demonstrated to be in better consistency with HEC and HOMA-IR in different ethnic groups. 7,8 The metabolic score for IR (METS-IR) has been reported as a novel IR surrogate validated against the HEC, which is calculated using fasting plasma glucose (FPG), TG, and HDL-C along with body mass index (BMI). 9 The emergence of these non-insulin-based IR indicators provides more simple and cheaper options for the recognition of IR, especially in primary health institutions.
In this study, we hope to find some simple IR indicators to identify the IR status in those who have prehypertension, but normoglycemia. Then, targeted interventions in IR may delay the progression of prehypertension and prevent prediabetes. Thus, the aim of this large-scale cross-sectional study was to examine which non-insulin-based IR indexes were significantly associated with prehypertension in subjects with normoglycemia.
Methods
Study population
This study was based on the data of general population of the Han Chinese (not included military service personnel), who received routine physical examination between November 2015 and September 2018 in China. Of the 174,695 adults with complete data, individuals with self-reported antihypertensive medication, hypoglycemic agents, statins, and blood pressure (BP) ≥140 and (or) 90 mmHg and FPG ≥6.1 mM were excluded. Finally, 108,370 adults without elevated FPG and hypertension remained eligible for this study. Ethical approval was obtained from the ethics committee of Hangzhou Aeronautical Sanatorium of Chinese Air Force.
Clinical measurements and surveys
Basic medical history and medication use were collected. Height, weight, waist circumference (WC), and hip circumference (HC) were measured by well-trained examiners. Systolic and diastolic blood pressures (SBP/DBP) were obtained three times on the right arm after at least 5-min rest by trained technicians using a standardized automatic electronic sphygmomanometer. The blood samples of subjects were collected after a minimum of 8 hr of overnight fasting. Serum levels of FPG, plasma uric acid (UA), total cholesterol (TC), TG, low-density lipoprotein cholesterol (LDL-C), and HDL-C were determined by a biochemical autoanalyzer.
Definitions
Prehypertension was defined as having either an SBP of 120–139 mmHg and/or DBP of 80–89 mmHg in the absence of antihypertensive medication. World Health Organization (WHO)/International Expert Committee (IEC) defines impaired fasting glucose as FPG 6.1–6.9 mM; so we defined normoglycemia as FPG <6.1 mM. 10 BMI = weight/height 2 (kg/m2); waist to hip ratio (WHR) = WC/HC; and waist to height ratio (WHtR) = WC/height. Abdominal obesity was defined as WC ≥85 cm in men and ≥80 cm in women. 11 Non-insulin-based IR indexes were calculated as following formulas: TyG = Ln [fasting TG (mg/dL)*FPG (mg/dL)/2] 12 ; TG to HDL-C ratio = TG/HDL-C 13 ; and METS-IR = Ln [(2*FPG)+TG]*BMI)/(Ln[HDL-C]). 9
Statistical analysis
Data are expressed as numbers (percentage) or mean ± standard deviation. Statistical analysis was performed using SPSS 18.0 (SPSS, Inc.). Independent sample t-test was used to compare the differences of continuous variables. Partial correlation was applied to examine the correlation between BP levels and three non-insulin-based IR indexes, which was adjusted for age. Logistic regression analyses were applied to explore the association of non-insulin-based IR indexes with prehypertension. TG/HDL-C, TyG, and METS-IR were divided into four quartiles and the lowest quartile was used as a reference, and age, gender, and smoking status were adjusted. P value <0.05 was considered statistically significant.
Results
The clinical characteristics of the study population are shown in Table 1. Of the 108,370 adults without elevated FPG and hypertension, 43.6% were women and 49.2% had prehypertension, the mean age was 43.2 years. Individuals with prehypertension were older and more likely to be male, and they also had higher BMI (24.1 ± 3.1 vs. 22.3 ± 2.8 kg/m2), WC (81.1 ± 9.4 vs. 75.1 ± 8.9 cm), WHR (0.85 ± 0.06 vs. 0.81 ± 0.06), WHtR (0.48 ± 0.05 vs. 0.45 ± 0.04), and METS-IR (33.92 ± 6.70 vs. 31.27 ± 6.35) than those with normotension. However, there was no significant difference in FPG (5.35 ± 0.39 vs. 5.35 ± 0.39 mM), TC (4.70 ± 0.86 vs. 4.71 ± 0.87 mM), TG (1.41 ± 1.08 vs. 1.41 ± 1.11 mM), HDL-C (1.51 ± 0.34 vs. 1.51 ± 0.34 mM), LDL-C (2.66 ± 0.74 vs. 2.66 ± 0.74 mM), UA (336.8 ± 88.4 vs. 336.2 ± 87.8 μM), TG/HDL-C (1.07 ± 1.13 vs. 1.07 ± 1.16), and TyG (8.53 ± 0.56 vs. 8.53 ± 0.56) between prehypertensive and normotensive groups.
Clinical Characteristics of Normoglycemic Individuals According to Blood Pressure Status
BMI, body mass index; DBP, diastolic blood pressure; FPG, fasting plasma glucose; HDL-C, high-density lipoprotein cholesterol; LDL-C, low-density lipoprotein cholesterol; METS-IR, metabolic score for insulin resistance; SBP, systolic blood pressure; TC, total cholesterol; TG, triglyceride; TyG, triglyceride and glucose index; UA, plasma uric acid; WC, waist circumference; WHR, waist to hip ratio; WHtR, waist to height ratio.
There was no significant change in BP value from the bottom to top quartiles of TG/HDL-C and TyG, but the SBP and DBP levels were significantly elevated from the lowest to top quartiles of METS-IR (Fig. 1). The correlation between BP value and the three non-insulin-based IR indexes is shown in Table 2. Among the three non-insulin-based IR indexes, only METS-IR had positive correlations with SBP and DBP levels both in subjects with elevated and normal WC.
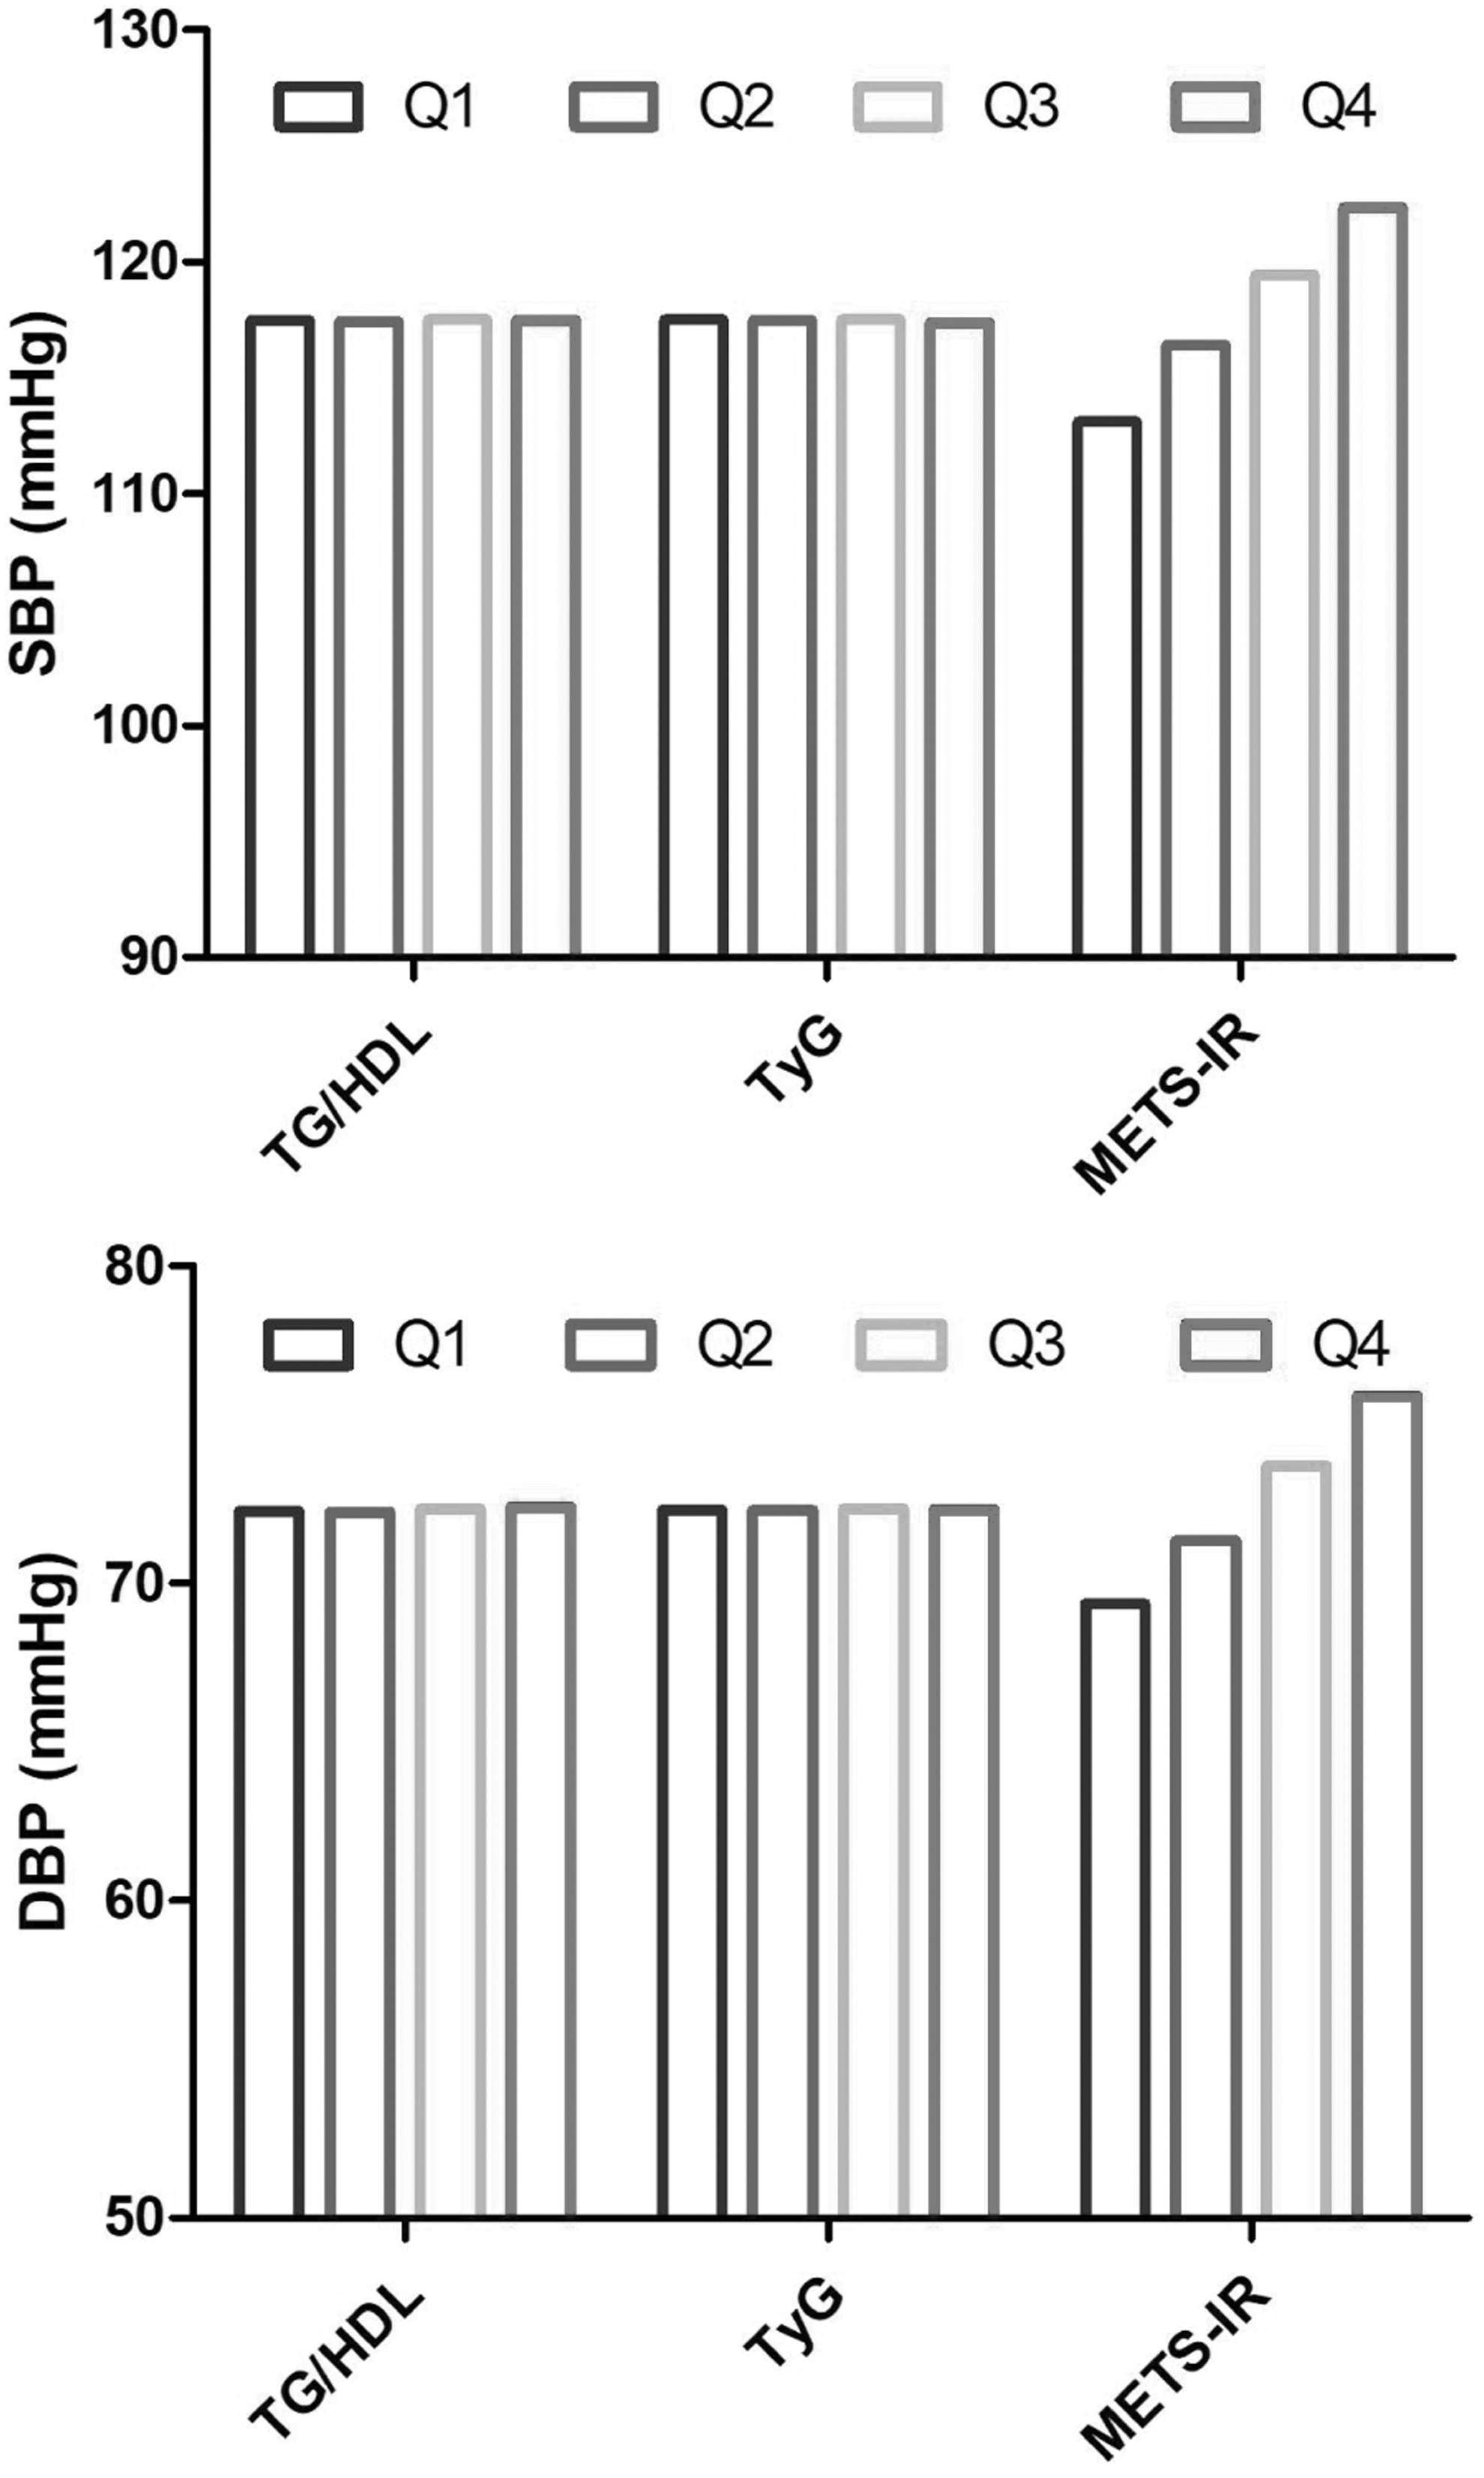
The change in BP level by quartiles of TG/HDL-C, TyG, and METS-IR. The BP level showed a significant trend with stepwise increase across ascending quartiles of METS-IR (P < 0.001). BP, blood pressure; DBP, diastolic BP; HDL-C, high-density lipoprotein cholesterol; SBP, systolic BP; TG, triglyceride; TyG, TG and glucose index; METS-IR, metabolic score for insulin resistance; Q, quartile.
Correlations Between Blood Pressure Value and TG/HDL-C, TyG, and METS-IR
The proportion of prehypertension did not increase with the rise of TG/HDL-C and TyG quartiles, but the proportion of prehypertension showed a significant increase trend as ascending quartiles of METS-IR (Fig. 2). In the logistic regression analysis, the odds ratios (OR) and 95% confidence interval (CI) for prehypertension in the highest quartile of TG/HDL-C, TyG, and METS-IR are shown in Fig. 3. Finally, only METS-IR was significantly associated with prehypertension irrespective of the categorization of WC after being fully adjusted. The OR for prehypertension in the fourth METS-IR quartile was 2.223 (95% CI: 2.044–2.417) in all subjects, was 2.022 (95% CI: 1.501–2.725) in elevated WC subgroup, and was 1.815 (95% CI: 1.620–2.034) in normal WC subgroup, and all P < 0.001.
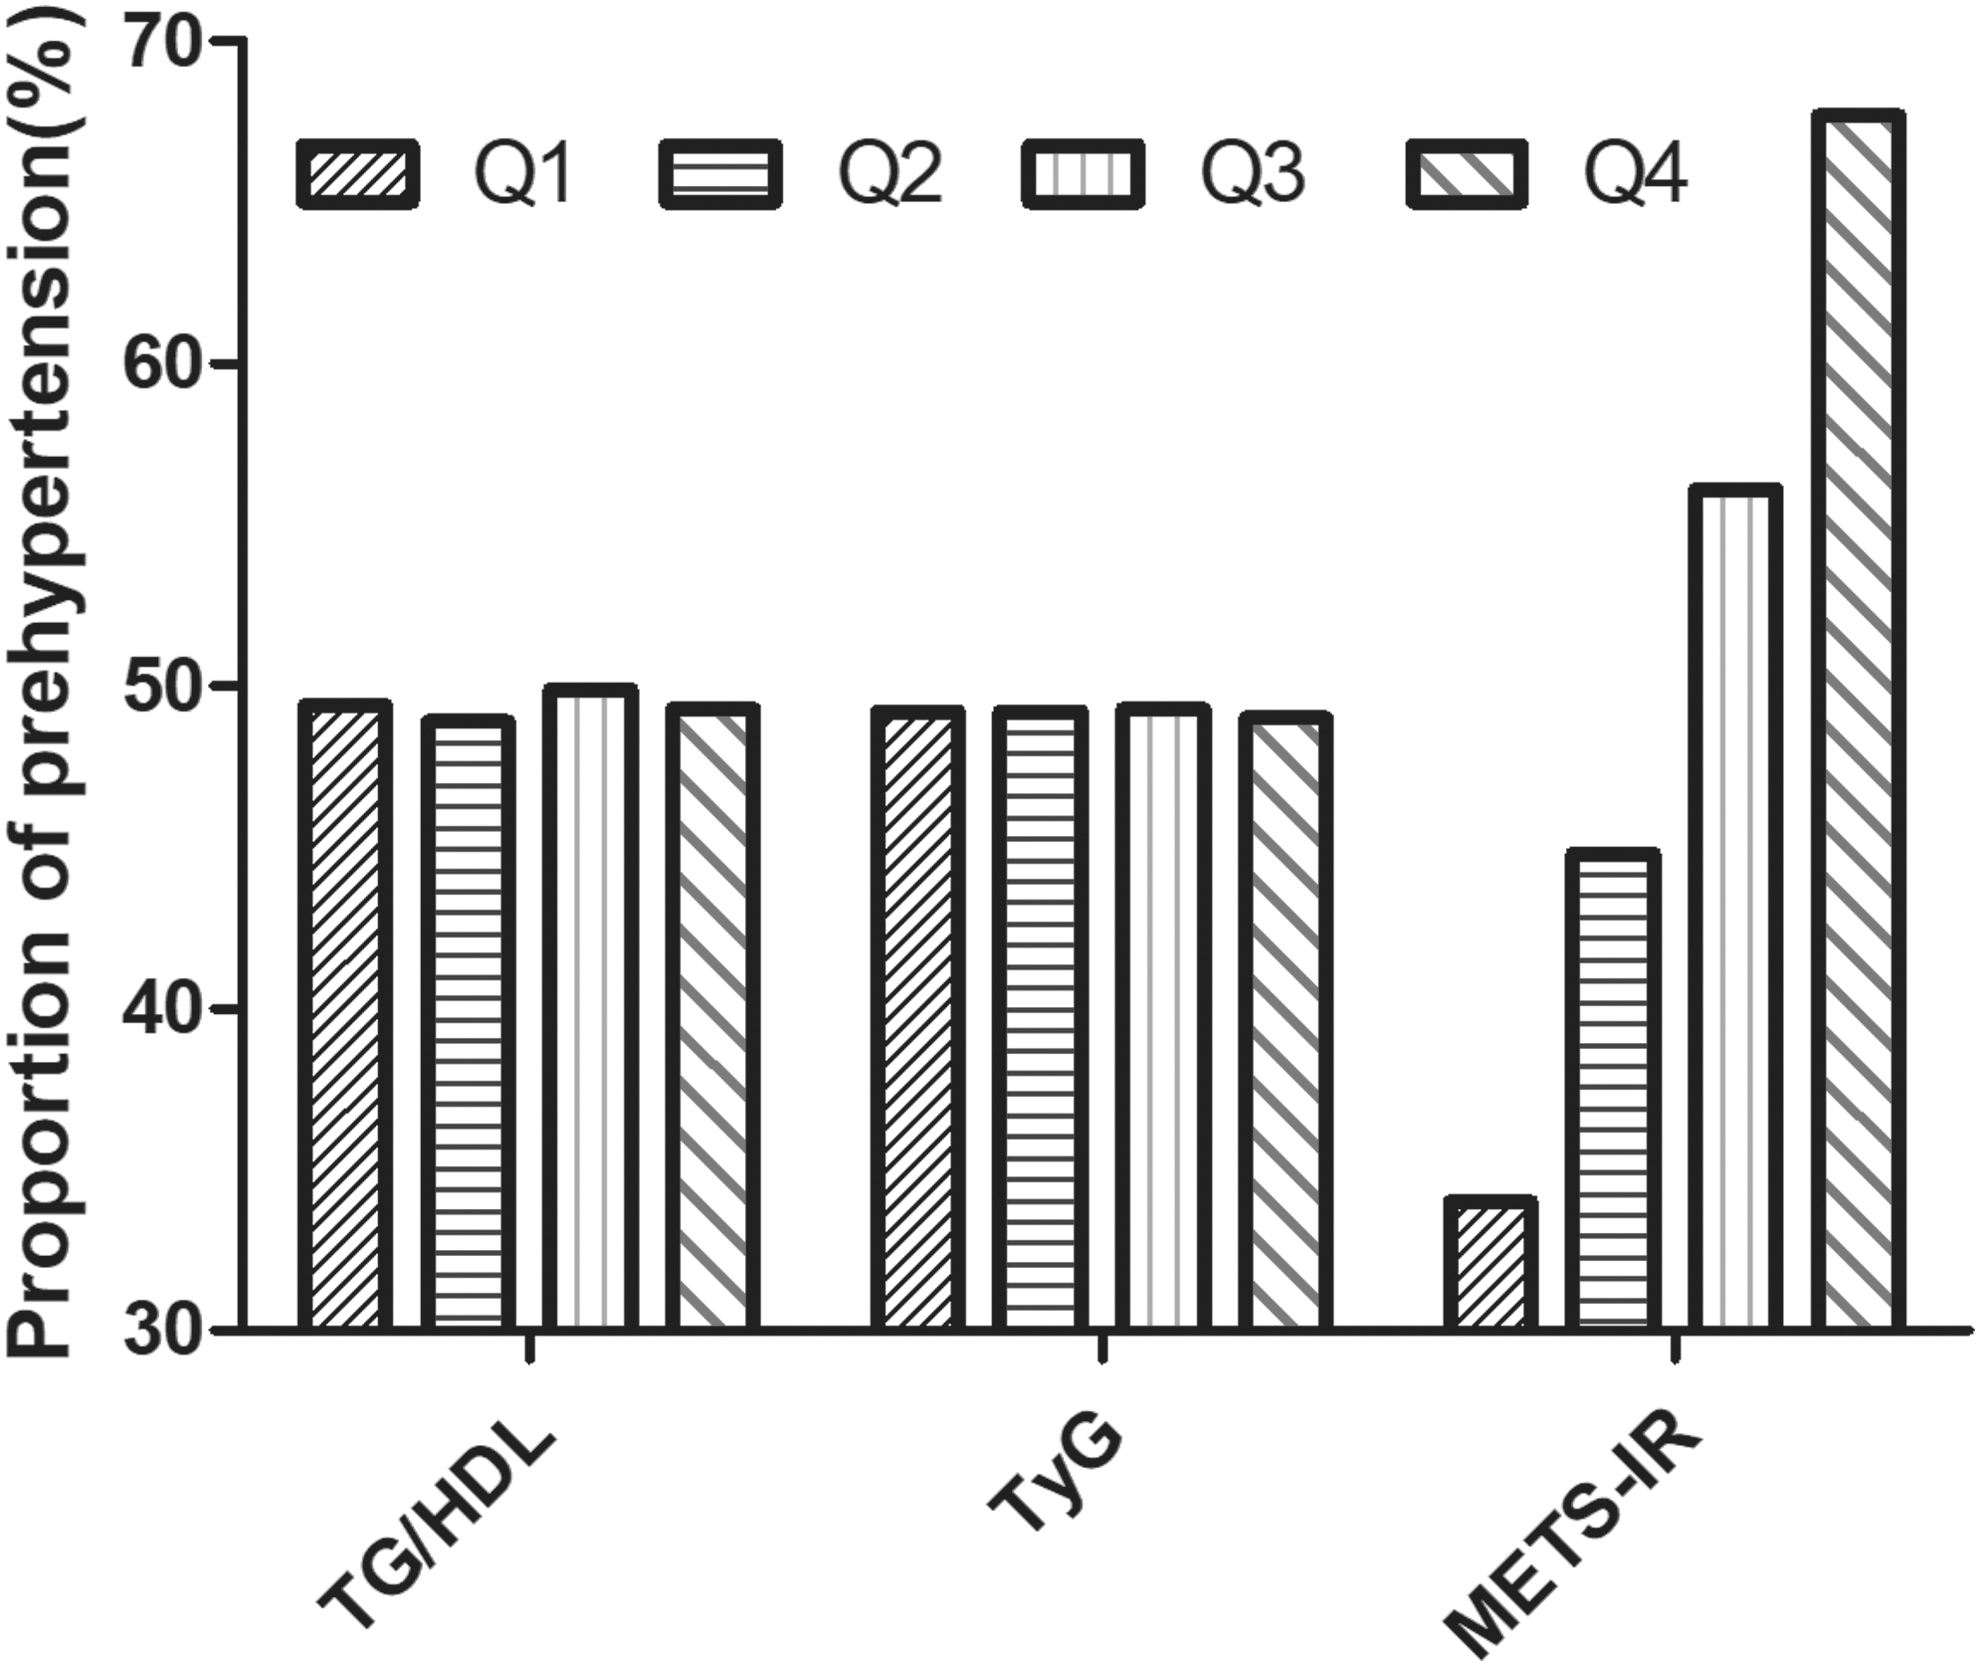
The proportion of prehypertension by quartiles of TG/HDL-C, TyG, and METS-IR. The proportion of prehypertension showed a significant trend with stepwise increase across ascending quartiles of METS-IR (P < 0.001).

Multiple regression analysis of prehypertension with TG/HDL-C, TyG, and METS-IR. Only METS-IR was associated with prehypertension irrespective of the categorization of WC (P < 0.001). WC, waist circumference.
Discussion
In this large-scale cross-sectional study, we compared the association of three non-insulin-based IR surrogates with prehypertension in subjects with normoglycemia. Our results show that only METS-IR was associated with prehypertension irrespective of the categorization of WC. Because IR is the common pathophysiological basis of prehypertension and prediabetes and an antecedent of these two states, 5 METS-IR has important clinical significance not only for the precise management of prehypertension but also for the prevention of prediabetes.
In this study, half of the subjects without elevated FPG and hypertension were prehypertensive. Except significantly fatter, individuals with prehypertension had similar levels of biochemical indicators as those with normotension. So existing CVD risk assessment tools cannot accurately assess the 10-year CVD risk in these prehypertensive populations. 14,15 Therefore, the CVD risk for them is very easy to be ignored and some more accurate and simple monitoring indicators are urgently needed to be developed, especially in primary health institutions.
Although an HEC is the gold standard for assessing IR, it is mainly used for basic research due to its complexity. 16 In clinical and epidemiological studies, the most commonly used IR indicator is HOMA-IR, which is dependent on insulin assay. However the cost of insulin test and jagged insulin kits also limit the clinical application of HOMA-IR, especially in the less developed regions. 17 The TG/HDL-C, TyG, and METS-IR, just need some routine biochemical or anthropometric indicators, have been demonstrated a better correlation with EHC, and could be simpler and suitable IR surrogates. 8,9
Hypertriglyceridemia and low HDL-C are the hallmarks of dyslipidemia and also have been well documented to be associated with IR. 18 When the diet or obesity causes the circulating TG to be at high levels, the level of free fatty acids (FFA) after lipolysis will increase accordingly and impair insulin signaling, and then lead to skeletal and hepatic IR. 19,20 So several studies have reported that TG was the most important factor directly associated with prehypertension, which follows IR. 21,22 However, this study did not show a significant association between prehypertension and TG/HDL-C and TyG, whose calculations were used in TG. This result may be related to racial differences, especially TG/HDL-C was ethnicity dependent. 23 Another reason may be that the mean FPG and TG, biochemical indicators in TG/HDL-C and TyG calculations, in the prehypertensive group were not significantly higher than those in the normotensive group.
It is not difficult to understand that there was no significant difference in FPG between the prehypertensive and normotensive group. The mechanism may be related to the different effect of IR on BP and glycolipid metabolism. In the early stages of IR, the compensatory hyperinsulinemia can cause vascular smooth muscle cell proliferation, which could increase vascular stiffness and BP elevation. 24 In addition, IR leads to activation of sympathetic nervous system and renin angiotensin-aldosterone system can also lead to BP elevation in a short period of time. 25 Unlike BP elevation, when IR occurs, FPG may remain normal for some time because of compensatory hyperinsulinemia. 19 When β-cells cannot respond to IR and afford hyperinsulinemia some day, FPG may ultimately increase significantly, but this process is relatively long. 26 So elevated BP may be an important early manifestation of IR.
METS-IR, just reported by Bello-Chavolla et al. in 2018, was a novel surrogate of IR validated against the EHC and had a better diagnostic and predictive performance of T2DM than TG/HDL-C and TyG. 9 In this study, only METS-IR was significantly associated with prehypertension in normoglycemic subjects among the three indicators. The better performance of METS-IR may be related to the use of BMI in the formula. Overweight/obesity is strongly associated with IR through increased FFA release and chronic low-grade inflammation caused by excess adipose tissue, especially visceral adipose tissue. 27,28 So overweight/obesity is a well-known modifier of the reliability of IR indicator. 29,30 In this study, the mean BMI of the prehypertensive group was 24.1 kg/m2, which had reached the standard for overweight in Asian populations, 11 significantly higher than the 22.3 kg/m2 of the normotensive group. Therefore, controlling weight is still the focus of primary prevention and management strategies of IR state. Interestingly, after we performed a subgroup analysis based on WC, the close association between METS-IR and prehypertension was still significant. The mechanism of METS-IR's performance that is not dependent on WC needs further exploration.
The strength of this study is that, even though we have restricted the study population and excluded those with elevated FPG and hypertension, the sample size was still large. The limitation of this cross-sectional study is that we cannot show a causal association between prehypertension and METS-IR. Second, the study population might limit the generalizability of METS-IR to other ethnic groups. Third, less similar research about the relationship between prehypertension and TG/HDL-C, TyG, and METS-IR in normoglycemic subjects results in a limited possible comparison of results.
In conclusion, our data provide valuable evidence of the strong association between prehypertension and METS-IR irrespective of the categorization of WC in normoglycemic Chinese subjects. In this regard, METS-IR may be a potential monitoring indicator when formulating primary prevention and management strategies of prehypertension and IR-driven metabolic diseases.
Footnotes
Author Disclosure Statement
No conflicting financial interests exist.