




Abstract
Background:
A number of researches have reported that thyroid hormones are associated with obesity. However, the relationship of serum levels of thyroid hormones in the normal range with obesity and parameters of obesity in women of childbearing age remains controversial. The purpose of this study was to examine serum levels of thyroid hormones within the normal range in obese Chinese women of reproductive age and to investigate the relationship between concentration of thyroid hormones and indices of obesity, including body mass index (BMI), waist-to-hip ratio (WHR), insulin resistance, blood glucose, blood lipids, and blood pressure.
Methods:
One hundred fifty-one obese women of reproductive age and 160 nonobese women of reproductive age were enrolled in this study. Serum levels of thyroid-stimulating hormone (TSH) of all subjects were within the normal reference range (0.35–4.94 mIU/L). The serum levels of free triiodothyronine (FT3), free thyroxine (FT4), and TSH, height, body weight, BMI, waist and hip circumferences, WHR, fasting blood glucose (FBG), fasting insulin (FI), homeostasis model assessment of insulin resistance (HOMA-IR), total triglycerides (TG), total cholesterol (TC), low-density lipoprotein cholesterol (LDL-C), high-density lipoprotein cholesterol (HDL-C), systolic blood pressure (SBP), and diastolic blood pressure (DBP) were measured in all subjects. Quantile regression analysis was used to analyze the associations of serum levels of FT3, FT4, and TSH with values of BMI, WHR, FBG, FI, HOMA-IR, TG, TC, LDL-C, HDL-C, SBP, and DBP.
Results:
In the group of obese women, serum levels of FT4 were lower (P < 0.001) and serum levels of TSH were higher (P < 0.001) compared with nonobese controls. After adjusting for covariables, quantile regression analysis showed that serum levels of FT4 were inversely associated with BMI values between the quantile levels of 0.29 and 0.60 of BMI (i.e., BMI level of 22.49 and 28.31 kg/m2, respectively). Meanwhile, we found that serum levels of TSH positively correlated with BMI values after the quantile level of 0.51 (i.e., BMI level of 27.06 kg/m2), positively associated with TC after the quantile level of 0.6 (i.e., TC level of 4.86 mM), and positively associated with LDL-C after the quantile level of 0.39 (i.e., LDL level of 1.96 mM). No significant associations were found between serum levels of thyroid hormones and values of WHR, FBG, FI, HOMA-IR, TG, HDL-C, SBP, and DBP.
Conclusions:
FT4 and TSH play an important role in regulating the weight in women with normal thyroid function during their reproductive years. Women with decreased serum FT4 or increased serum TSH levels have a higher risk of developing obesity. Besides, TSH has a significant influence on metabolism of blood lipids. Women with higher serum levels of TSH have a higher risk of incidence of lipid metabolism disorders.
Introduction
The epidemic of obesity has become a global public health problem. 1 Some studies revealed that overweight and obesity are common among women during their reproductive years, accounting for about 30% to 40% in developing countries. 2,3 Obese women are at high risk for infertility and gestational complications, such as gestational hypertension, gestational diabetes, fetal death, miscarriage, preterm birth, and also increase in the incidence of birth defects and infant mortality. 4 –6 These adverse outcomes seriously jeopardize the physical and mental health of women during their reproductive years. Therefore, it is particularly important to study the etiology of obesity in this special stage of women.
Thyroid hormones play important roles in all major metabolic pathways, including protein, carbohydrate, and lipid metabolism, energy expenditure, and thermogenesis. 7 –9 The contribution of thyroid hormones to regulation of body weight has been reported in many studies. Higher baseline free triiodothyronine (FT3) or free thyroxine (FT4) and lower baseline thyroid-stimulating hormone (TSH) predicted more weight loss. 10,11 In general, overt thyroid dysfunction can lead to obesity or obesity-related diseases, such as metabolic syndrome, hypertension, dyslipidemia, and hyperglycemia. 12 –14 Hypothyroidism is also a recognized risk factor for cardiovascular diseases. The potential mechanisms linking the two conditions are thought to be endothelial dysfunction, blood pressure changes, dyslipidemia, weight gain, and direct effects of thyroid hormones on the myocardium. 15,16
However, there was no definitive conclusion as to whether minor changes of serum thyroid hormone levels are associated with obesity or metabolic disorders. 17 –19 One cross-sectional population-based study performed in euthyroid obese people concluded that FT4 and TSH showed associations with weight, insulin resistance, blood pressure, and blood lipids. 20 Other studies have also confirmed an increased incidence of subclinical hypothyroidism in obese people. 21,22 However, these findings did not necessary imply an association between the concentration of thyroid hormones within the normal range and obesity in women of reproductive age because their weight and metabolic status may be affected by many other factors, such as age, race, socioeconomic status, ovarian function, nutrition, and exercise. 23,24
Moreover, normal ovarian function and blood estradiol concentration may prevent women from becoming severely obese during their reproductive years. 25 The metabolic disorders were also relatively mild in this part of the population and tend to become obvious with age, especially after menopause. 26,27 Therefore, there was very little research that directly examined the association of serum levels of thyroid hormones within the euthyroid range with obesity in women of reproductive age.
Based on this background, we sought to assess serum levels of thyroid hormones in obese Chinese women of childbearing age and to explore the relationship between serum levels of thyroid hormones within the normal range and indices of obesity, including the severity of obesity, insulin resistance, blood glucose, blood lipids, and values of blood pressure.
Subjects and Methods
Subjects
From April 2017 to October 2018, 151 obese women of childbearing age (18–45 years) were randomly selected among outpatients from Heilongjiang Provincial Hospital, Harbin, China. One hundred sixty nonobese women controls, aged 18–45 years, were randomly selected from the physical examination center at the same time in the same hospital. Subjects were excluded for any of the following abnormal thyroid conditions: having hyperthyroidism (TSH >4.94 mIU/L) or hypothyroidism (TSH <0.35 mIU/L) and receiving treatment for previous or present thyroid diseases (i.e., thyroid hormone drugs, antithyroid drugs, thyroid surgery, and thyroid radiotherapy). Those with a history of adrenal diseases, pituitary diseases, ovarian diseases, heart failure, severe hepatic or renal diseases, severe gastrointestinal diseases, malignant tumor, hypertension, diabetes mellitus, or mental illness were excluded from this study. Pregnant or lactating women were also excluded from this study.
Definition
Women of childbearing age were defined as those aged 18–45 years with a normal menstrual cycle. Body mass index (BMI) values were classified into the following three categories: 18.5–23.9 kg/m2 (normal weight), 24.0–27.9 kg/m2 (overweight), and ≥28.0 kg/m2 (obesity). 28 In this study, we excluded all pathological obesity cases caused by metabolic or endocrine diseases. Euthyroidism was defined as serum levels of TSH in the range of 0.35–4.94 mIU/L, regardless of the serum FT3 and FT4 levels.
Anthropometric and laboratory measurements
Values of height and weight were measured using an ultrasonic electronic height- and weight-measuring instrument (Umron, Co., Beijing, China), then BMI was calculated according to the following formula: weight (kg)/height (m2). Waist circumference was measured around subjects' unclothed abdomen at the midpoint level of the line between the anterior superior iliac spine and the lower margin of the 12th rib. Hip circumference was measured in subjects wearing light clothing at the level of the widest diameter around the buttocks, then waist-to-hip ratio (WHR) was calculated according to the following formula: waist circumference (cm)/hip circumference (cm). Fasting blood samples were obtained after an overnight fast of at least 8 hr from all subjects. Serum levels of FT3, FT4, TSH, and fasting insulin (FI) were measured using supersensitive electrochemiluminescence immunoassays (Roche Diagnostics, Mannheim, Germany). In our laboratory, the normal reference range for serum levels of TSH is 0.35–4.94 mIU/L, for FT3 is 2.60–5.70 pM, and for FT4 is 9.0–19.0 pM. The intra-assay coefficients of indices were 1.3%, 6.3%, and 2.4%, respectively. The interassay coefficients of indices were 2.8%, 5.5%, and 3.9%, respectively. The normal reference range of FI is 16.5–206.6 pM. The intra- and interassay coefficients of the index were 1.3% and 2.4%. FPG, triglycerides (TG), total cholesterol (TC), low-density lipoprotein cholesterol (LDL-C), and high-density lipoprotein cholesterol (HDL-C) were measured by an automatic biochemical analyzer (Hitachi, Ltd., Tokyo, Japan). The normal reference ranges of these indices are 3.57–6.16 mM, 0.34–1.86 mM, 2–5.2 mM, 1.9–3.8 mM, and 0.89–1.96 mM, respectively. Homeostasis model assessment of insulin resistance (HOMA-IR) was calculated according to the following formula: FI (mIU/L) × FPG (mM)/22.5. The normal reference range of HOMA-IR is <2.7. The values of blood pressure were measured from the right arm in a sitting position after participants had rested for at least 30 min, using an electronic sphygmomanometer (Umron, Co.).
Medical ethics approval
This study was approved by the medical ethics committee of Heilongjiang Provincial Hospital. Written consent to participate in this study was obtained from all participants. Only those who signed the consent form were enrolled in the study. All study protocols were carried out in accordance with the Declaration of Helsinki. 29
Statistical analysis
Statistical Package for the Social Sciences, version 22.0 (SPSS, Inc., Chicago, IL), was used for statistical analysis. The variables of subjects across the two study groups (i.e., groups of obese women and nonobese women) obey normal distributions with variance uniformity. Thus, they are expressed as means and standard deviations. The variables were compared using a two-sample t-test. Differences were considered significant at P < 0.05 for the two sides. Quantile regression analysis was used to analyze associations of serum thyroid hormone levels with indices of obesity in the two groups. 30 The regression coefficients of variables (FT3, FT4, and TSH) in the quantile regression model differ across varying quantile levels of BMI, WHR, FPG, FI, HOMA-IR, TC, TG, LDL-C, HDL-C, systolic blood pressure (SBP), and diastolic blood pressure (DBP). The figures in this study were drawn using GraphPad Prism, version 7 (GraphPad Software, Inc., La Jolla, CA).
Results
Characteristics of the two study groups
For the total 311 participants, there were 151 subjects (48.55%) in the group of obese women and 160 subjects (51.45%) in the group of nonobese women. Descriptive statistics of the characteristics are shown in Table 1. The obese women had higher BMI (P < 0.001), higher WHR (P < 0.001), higher FPG (P = 0.005), higher TC (P < 0.001), higher LDL-C (P < 0.001), lower HDL-C (P < 0.001), higher SBP (P = 0.008), lower FT4 (P < 0.001), and higher TSH (P < 0.001) levels compared with the nonobese women. As for the other characteristics, including age, FI, HOMA-IR, TG, DBP, and FT3, differences between the two groups did not reach statistical significance (P > 0.05).
Comparison of Characteristics Between Obese and Nonobese Women
Significantly different (P < 0.05) from nonobese subjects.
BMI, body mass index; DBP, diastolic blood pressure; FI, fasting insulin; FPG, fasting plasma glucose; FT3, free triiodothyronine; FT4, free thyroxine; HC, hip circumference; HDL, high-density lipoprotein; HOMA-IR, homeostasis model assessment of insulin resistance; LDL-C, low-density lipoprotein cholesterol; SBP, systolic blood pressure; TC, total cholesterol; TG, triglyceride; TSH, thyroid-stimulating hormone; WC, waist circumference; WHR, waist-to-hip ratio.
Associations of serum levels of FT3 with parameters of obesity in women
After adjusting for covariables such as age, FT4, and TSH, quantile regression analysis showed that there were no significant associations between serum levels of FT3 and parameters of obesity such as BMI, WHR, FPG, FI, HOMA-IR, TG, TC, LDL-C, HDL-C, SBP, and DBP.
Associations of serum levels of FT4 with parameters of obesity in women
After adjusting for covariables such as age, FT3, and TSH, quantile regression analysis showed that serum levels of FT4 were inversely associated with BMI values. No significant associations were found between serum levels of FT4 and WHR, FPG, FI, HOMA-IR, TG, TC, LDL-C, HDL-C, SBP, and DBP. Table 2 shows the coefficients of estimation with 95% confidence intervals (CIs) for the associations of serum levels of FT4 with BMI values at varying quantile levels of BMI.
Associations of Serum Levels of FT4 with BMI Values at Selected Quantile Levels of BMI (Coefficients and 95% CIs)
The quantile levels ranged from 0.1 to 0.9, in which the corresponding BMI values (kg/m2) were 20.42, 21.30, 22.66, 24.24, 26.81, 28.31, 28.73, 29.40, and 30.78, respectively.
CI, confidence interval.
The plot in Fig. 1 shows coefficients for the associations of serum levels of FT4 with BMI values across varying quantile levels of BMI. The gray area represents the 95% CI of coefficients, the black curve represents the estimated coefficients, and the dotted line represents the coefficient = 0. We found that serum levels of FT4 were inversely associated with BMI values between the quantile levels of 0.29 and 0.60 of BMI (i.e., BMI level of 22.49 and 28.31 kg/m2, respectively).
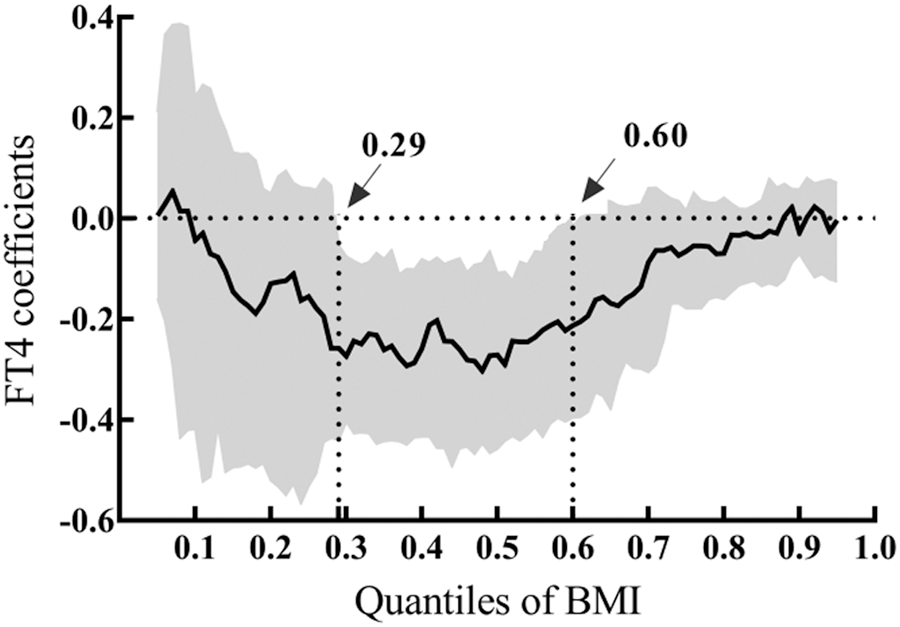
Coefficients of FT4 for the associations of serum levels of FT4 and BMI values across selected quantile levels of BMI. The quantile levels ranged from 0.1 to 0.9, in which the corresponding BMI values (kg/m2) were 20.42, 21.30, 22.66, 24.24, 26.81, 28.31, 28.73, 29.40, and 30.78, respectively. FT4, free thyroxine; BMI, body mass index.
Associations of serum levels of TSH with parameters of obesity in women
After adjusting for covariables such as age, FT3, and FT4, quantile regression analysis showed that serum levels of TSH were positively associated with values of BMI and TC and LDL-C. No significant associations were found between serum levels of TSH and WHR, FPG, FI, HOMA-IR, TG, HDL-C, SBP, and DBP. Table 3 shows the coefficients of estimation with 95% CIs for associations of serum levels of TSH with values of BMI, TC, and LDL-C at varying quantile levels of these variables.
Associations of Serum Levels of TSH with Values of BMI, TC, and LDL-C at Selected Quantile Levels of Variables (Coefficients and 95% CIs)
The quantile levels ranged from 0.1 to 0.9, in which the corresponding BMI values (kg/m2) were 20.42, 21.30, 22.66, 24.24, 26.81, 28.31, 28.73, 29.40, and 30.78; corresponding values of TC (mM) were 3.37, 3.77, 4.09, 4.35, 4.53, 4.86, 5.11, 5.48, and 6.00; and corresponding values of LDL-C (mM) were 1.33, 1.65, 1.79, 1.97, 2.02, 2.12, 2.30, 2.76, and 3.14, respectively.
The plot in Figs. 2 –4 shows the coefficients for the associations of serum levels of TSH with values of BMI and TC and LDL-C across varying quantile levels of these variables. The gray area represents the 95% CI of coefficients, the black curve represents the estimated coefficients, and the dotted line represents the coefficient = 0. We found that serum levels of TSH were positively correlated with BMI values after the quantile level of 0.51 (i.e., BMI level of 27.06 kg/m2), positively associated with TC after the quantile of 0.6 (i.e., TC level of 4.86 mM), and positively associated with LDL-C after the quantile of 0.39 (i.e., LDL level of 1.96 mM).
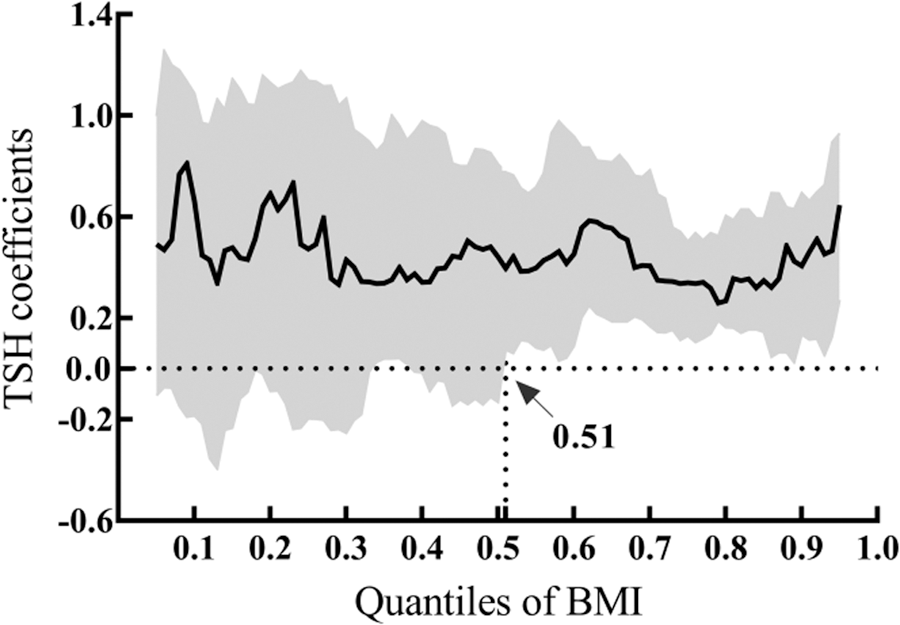
Coefficients of TSH for the associations of serum levels of TSH and BMI values across selected quantile levels of BMI. The quantile levels ranged from 0.1 to 0.9, in which the corresponding BMI values (kg/m2) were 20.42, 21.30, 22.66, 24.24, 26.81, 28.31, 28.73, 29.40, and 30.78, respectively. TSH, thyroid-stimulating hormone.

Coefficients of TSH for the associations of serum levels of TSH and values of TC across selected quantile levels of TC. The quantile levels ranged from 0.1 to 0.9, in which the corresponding values of TC (mM) were 3.37, 3.77, 4.09, 4.35, 4.53, 4.86, 5.11, 5.48, and 6.00, respectively. TC, total cholesterol.

Coefficients of TSH for the associations of serum levels of TSH and values of LDL-C across selected quantile levels of LDL-C. The quantile levels ranged from 0.1 to 0.9, in which the corresponding values of LDL-C (mM) were 1.33, 1.65, 1.79, 1.97, 2.02, 2.12, 2.30, 2.76, and 3.14, respectively. LDL-C, low-density lipoprotein cholesterol.
Discussion
The purpose of this study was to examine serum levels of thyroid hormones within the normal range in obese women of reproductive age and to investigate the relationship between the concentration of thyroid hormones and indices of obesity. In this study, we included BMI, WHR, FPG, FI, HOMA-IR, TC, TG, LDL-C, HDL-C, SBP, and DBP as evaluation indices of metabolism related to obesity.
We demonstrated that obese women of reproductive age had lower serum FT4 and higher TSH levels compared with nonobese women of the same age. These results were in agreement with some previous reports. 20 However, most of the related studies have been done on subjects with overt dysthyroid function or on postmenopausal women because the metabolic disorders of these parts of the population are obvious. 31,32 Several large clinical studies have looked at serum levels of thyroid hormones in obese persons with normal thyroid function; however, they did not come to the same conclusions. 33 –35 One of them was a 10-year follow-up study and the results showed that no differences of serum levels of FT3, FT4, and TSH were observed among overweight participants, obese participants, and normal weight controls. 35
In this study, we selected euthyroid obese women in their reproductive age as the research group after excluding pathological obesity caused by metabolic or endocrine diseases. Therefore, metabolic disorders of these study subjects were not obvious, and the association between variables may be relatively weak. Hence, quantile regression analysis was used in this study. 30 The regression coefficients of variables in the quantile regression model differ across selected quantile levels of dependent variables, which is very useful to investigate associations between variables where there may be only weak associations between them.
In this study, we observed that an inverse association of serum levels of FT4 with BMI values existed between the BMI levels of 22.49 and 28.31 kg/m2 in euthyroid women. Meanwhile, we found that a positive association of serum levels of TSH with BMI values existed above the BMI level of 27.06 kg/m2. These results suggested that serum levels of FT4 were not associated with BMI values when women were close to underweight or obesity, and serum levels of TSH had a significant influence on BMI values when women were overweight and close to obesity. Both FT4 and TSH play an important role in regulating the weight in women with normal thyroid function during their reproductive years. Women with decreased serum FT4 or increased TSH levels have high risk of developing obesity.
Mechanistically, thyroid hormones are important determinants of energy expenditure and thermogenesis and contribute to body weight control and maintenance of optimal energy balance. 36 In addition, thyroid hormone receptors are widely expressed in adipose tissue and mediate the balance of lipolysis and lipogenesis. 37,38 Some studies have shown that increased serum levels of TSH can directly stimulate adipogenesis and fat accumulation, leading to weight gain. 39,40 A number of researches have reported that serum levels of thyroid hormones were associated with body weight. However, the relationship between normal thyroid function and obesity in women of childbearing age remains controversial. One study from Asia suggested an association between serum levels of TSH within the normal range and body weight in young obese women. 41 In contrast, another study from United Kingdom showed a lack of association between serum levels of TSH and BMI values in euthyroid women. 42 Similarly, the relationship between serum levels of FT4 and body weight in euthyroid women of reproductive age is also controversial. 43
In the quantile regression model in this study, we found a positive association of serum levels of TSH with TC after the TC level of 4.86 mM and a positive association of serum levels of TSH with LDL-C after the LDL level of 1.96 mM, respectively. These results showed that TSH had a significant influence on the metabolism of blood lipids. TSH increases the incidence of lipid metabolism disorders, which might be followed by weight gain in women of reproductive age. Women with higher serum levels of TSH have higher risk of incidence of obesity and lipid disorders.
In hypothyroidism, dyslipidemia is mainly due to increased cholesterol synthesis and decreased degradation, with elevated serum levels of TC and LDL-C. Moreover, the rate of catabolism of fatty acids in hypothyroidism is decreased and lipolytic sensitivity of white fat cells is inhibited. 44 In a retrospective cohort study to investigate the prevalence of thyroid dysfunction, serum levels of TSH were seen to be higher in patients with hyperlipidemia. Moreover, 5.2% had a TSH level >5 mIU/L, suggesting that both hypothyroidism and subclinical hypothyroidism might be causes of hyperlipidemia. 45 Dyslipidemia has been a common outcome in patients with overt thyroid dysfunction, but current reports on the association between serum levels of thyroid hormones in the euthyroid state and lipids are insufficient. There are only a few clinical researches that revealed that the concentration of thyroid hormones was significantly associated with the lipid profile in the euthyroid population. 46,47 In our study, the difference in metabolic parameters between obese women and nonobese women is not significant, especially blood glucose, insulin resistance, and blood pressure, therefore we did not draw corresponding positive conclusions. No significant associations were found between the serum levels of thyroid hormones and fasting blood glucose, FI, HOMA-IR, TG, HDL-C, SBP, and DBP. Similarly, we did not find any associations between serum levels of FT3 and parameters of obesity. The possible reason was that serum levels of FT3 in human blood are minute, and there is no significant difference in serum levels of FT3 between obese and nonobese women.
One limitation of our study was that the sample size was relatively small. A larger cohort is needed to examine the serum levels of thyroid hormones in obese women of reproductive age and to investigate their relationship with metabolic parameters. We also lacked data regarding other hormones that affect body weight and indices of metabolism. In females, thyroid hormones and obesity may not be a one-way association. Further studies are needed to expand the study variables to obtain more reliable conclusions. The strength of our study was that the subjects included in this analysis were euthyroid women. These allowed us to objectively evaluate whether slight changes of serum levels of thyroid hormones were associated with obesity in women with normal thyroid function. This may be to guide the clinical treatment of obesity caused by mild changes in thyroid function, although in the normal range. For example, women of reproductive age should keep serum levels of thyroid hormones within ideal limits in preparation for pregnancy to avoid obesity and metabolic disorders.
Conclusions
The obese women of reproductive age had lower serum FT4 and higher serum TSH levels compared with nonobese women of the same age. FT4 and TSH play an important role in regulating the weight in women with normal thyroid function during their reproductive years. Women with decreased serum FT4 or increased serum TSH levels have high risk of developing obesity. Besides, TSH has a significant influence on metabolism of blood lipids. Women with higher serum levels of TSH have higher risk of incidence of lipid metabolism disorders.
Footnotes
Acknowledgments
The authors thank Professor H.-Y.K. for help in performing this study. This study received funding support from the Health Commission of Heilongjiang Province (Research project no. 2016–504).
Authors' Contributions
F.-M.D. designed this study, performed the experiments, analyzed the data, and wrote the manuscript. H.-Y.K. gave guidance on experimental design, reviewed all the statistical analyses, and edited the manuscript. B.-H.D., D.-N.L., and X.-Y.Y. performed the experiments. All authors approved the final manuscript.
Author Disclosure Statement
No conflicting financial interests exist.