
Abstract
Aims:
The aims of this study were to explore the left ventricular (LV) structural abnormality and its risk factors in type 2 diabetes mellitus (T2DM) patients with or without hyperuricemia (HU) and to compare their LV function using three-dimensional speckle tracking echocardiography (3DSTE).
Methods:
Eighty T2DM patients with preserved LV ejection fraction were included, 40 of whom had HU as co-morbidity. Forty age- and gender-matched controls were also recruited. The risk factors and corresponding diagnostic values for LV remodeling (LVR) were, respectively, determined using multifactor logistic regression and area under the receiver operating characteristic curves (AUC). LV global longitudinal strain (GLS), global circumferential strain (GCS), global area strain (GAS), and global radial strain (GRS) were measured by 3DSTE.
Results:
LV morphology constituent ratio showed significant differences among groups (P = 0.0001). Compared with the controls, more abnormal LV patterns were found in the two T2DM groups, while LV hypertrophy was the most prevalent in those with T2DM and HU. Fasting plasma glucose and serum uric acid were two significant risk factors for LVR in T2DM patients (AUC values: 0.678 and 0.672). The patients with T2DM alone had significantly lower GLS than the controls (P < 0.05). The patients with T2DM and HU had significantly lower GLS, GCS, GAS, and GRS than the controls (all P < 0.01), and they also had significantly lower GLS, GCS, and GAS than the patients with T2DM alone (all P < 0.05).
Conclusions:
Conventional echocardiography combined with 3DSTE could detect subclinical LV structural abnormality and dysfunction in T2DM patients with or without HU.
Introduction
Type 2 diabetes mellitus (T2DM) is one kind of common endocrine and metabolic disease. In addition to hyperglycemia, T2DM could combine or induce a variety of other metabolic disorders, one of which is hyperuricemia (HU). Both T2DM and HU could bring different degrees of negative effects for cardiac structure and function. 1 Therefore, the main purposes of this retrospective study were to explore the left ventricular (LV) structural abnormality and its risk factors in T2DM patients with or without HU and to compare LV function in these patients using three-dimensional speckle tracking echocardiography (3DSTE).
Methods
Study population
The study population consisted of 80 T2DM patients enrolled in our hospital (single center) from September 2018 to January 2019. The diagnostic criteria of T2DM were in line with the guidelines promulgated by the American Diabetes Association (ADA) in 2016. 2 Conventional clinical and medical imaging examinations excluded the possible presence of hypertension, coronary lesion, severe arrhythmia, and other heart diseases with known causes. Given the high prevalence rate of symptomatic or asymptomatic coronary artery disease in patients with T2DM, every enrolled patient was required to provide the recent result from coronary angiography or coronary computed tomography (CT) scan. All patients included in this study should have no obvious atherosclerotic plaque or stenosis. The definition of HU needed to follow the sex difference: serum uric acid (SUA) ≥7.0 mg/dL for male and ≥6.0 mg/dL for female. 3
Forty age- and gender-matched healthy physical examinees in our hospital were recruited as the control group. None of the controls had obviously positive signs of T2DM, hypertension, or other pre-existing cardiac diseases after routine examinations. Moreover, they all had SUA at normal levels.
The protocol conformed to the ethical guidelines of the 1975 Declaration of Helsinki. All individuals in the study needed to sign informed consent first.
Conventional echocardiography
The conventional examinations were conducted on a Vivid E9 ultrasound instrument (GE Healthcare, Horten, Norway) equipped with a variable-frequency probe for adults. All reported data should be the average value in three consecutive cycles. The 2D and Doppler measurements were all obtained according to ASE guidelines. LV mass was determined using the Devereux formula: LVM (g) = 0.8 × [1.04 (LVEDd+PWDd+IVSDd) 3 −(LVEDd) 3 ]+0.6. LV mass index (LVMI) was then calculated as LVM/body surface area (BSA). Relative wall thickness (RWT) referred to the ratio of (2 × LVPWDd)/LVEDd. Based on the thresholds recommended by ASE, LV hypertrophy (LVH) was defined as LVMI >95 g/m2 for women and >115 g/m2 for men, whereas a partition value >0.42 for RWT was considered to be elevated for both males and females. 4 Then, we classified the LV geometry into four mutually exclusive patterns: normal geometry [RWT ≤0.42 and LVH (−)], concentric remodeling [RWT >0.42 and LVH (−)], concentric hypertrophy [RWT >0.42 and LVH (+)], and eccentric hypertrophy [RWT ≤0.42 and LVH (+)]. 5
Three-dimensional speckle tracking echocardiography
We needed to acquire the real-time LV full-volume images (25∼45 frames/s) with a GE 4V-D matrix-array transducer. The images were stitched from six wedge-shaped volumes in six consecutive cardiac cycles during a single breath-hold. These included three apical tomographic orientations (four-chamber, three-chamber, and two-chamber), as well as three short-axis sections (mitral valve, papillary muscle, and apex). After the image acquisition was completed, the online analyses could be performed using a specialized software package (4D Auto LVQ). As two key points, the mitral valve closure and LV apex should be manually determined first in the four-chamber section. Next, LV volume variation and myocardial motion in a whole cycle could be tracked by the software. Some necessary corrections should be done in the cases without optimal LV delineations. Finally, a set of data about LV structure and function could be obtained. In this study, we needed to focus on LV ejection fraction (LVEF), LV mass, and all of the global strain values in four directions, including global longitudinal strain (GLS), global circumferential strain (GCS), global area strain (GAS), and global radial strain (GRS) (Fig. 1).
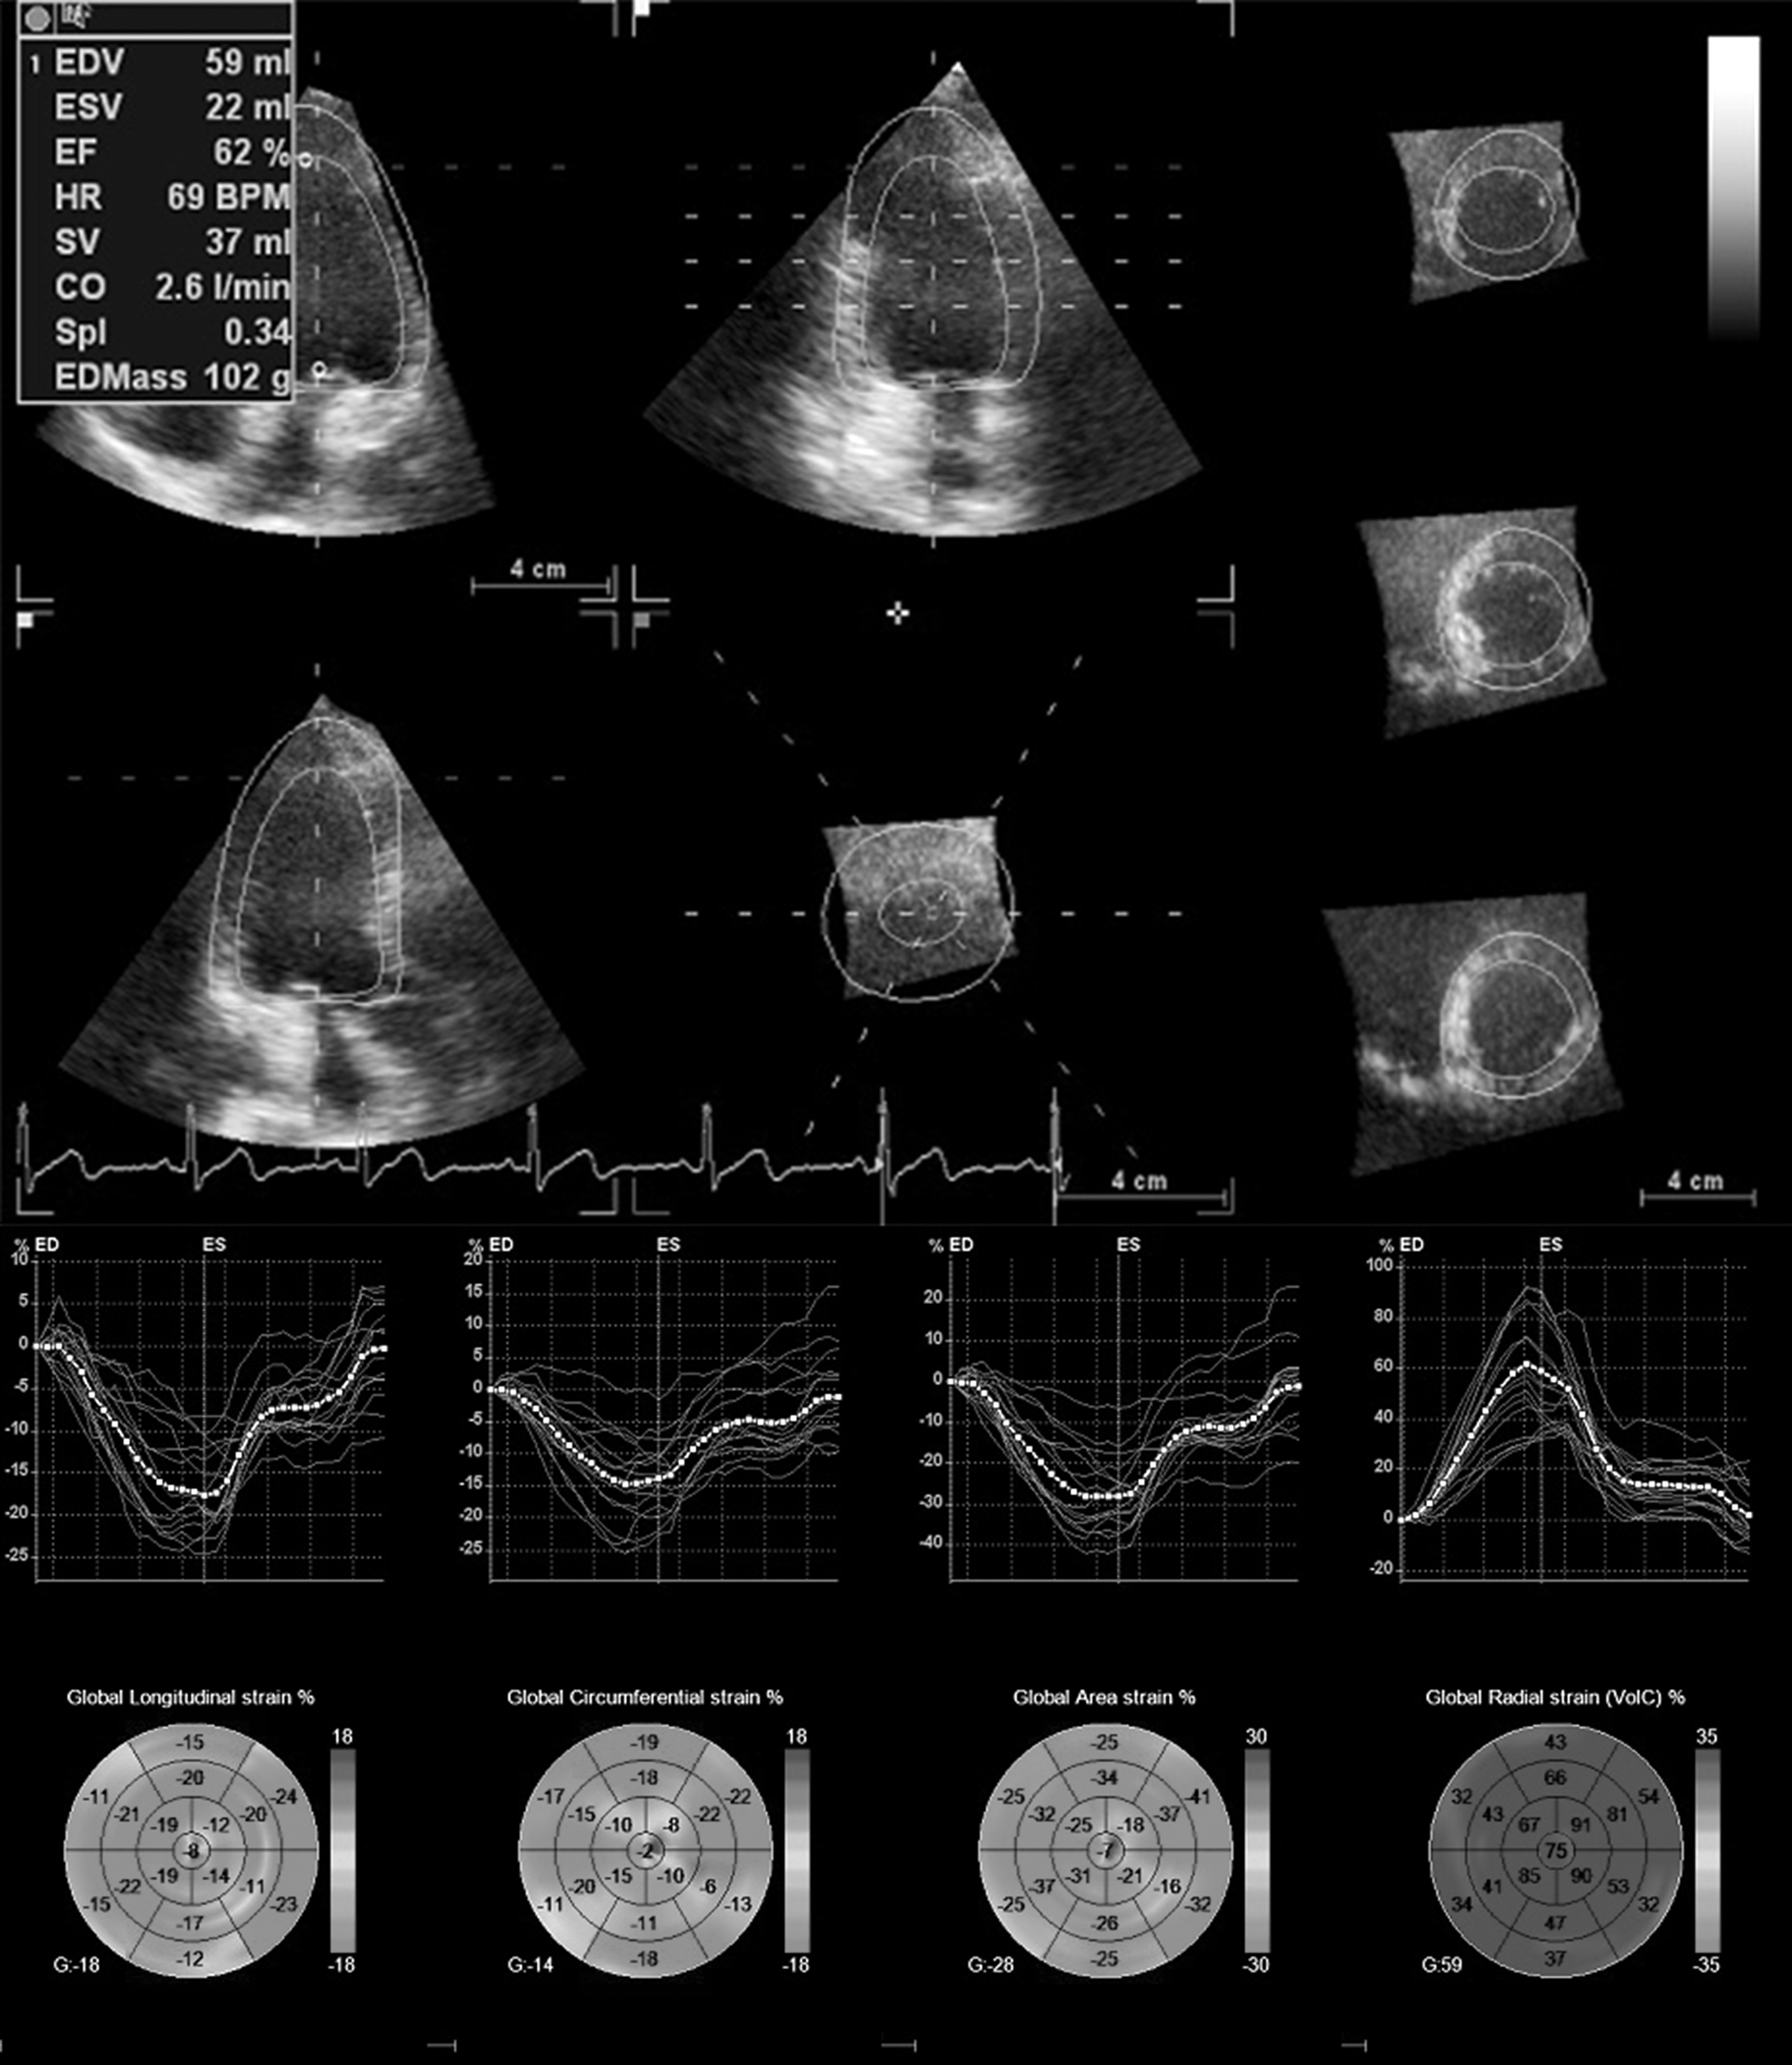
LV volume, EF, LV mass, and peak global systolic strain values were calculated, including GLS, GCS, GAS, and GRS. EF, ejection fraction; GAS, global area strain; GCS, global circumferential strain; GLS, global longitudinal strain; GRS, global radial strain; LV, left ventricular.
Other baseline examinations
The resting blood pressure was recorded as an average value of three measurements in sitting position taken in half an hour's time.
The morning fasting venous blood was drawn for the laboratory tests of fasting plasma glucose (FPG), SUA, total cholesterol (TC), triglyceride (TG), high-density and low-density lipoprotein cholesterol (HDL-C and LDL-C).
Reproducibility of strain measurements
Seven days later, repeated measurements of strain values in 12 randomly selected individuals should be done by the same operator and independently by a second operator. Both of them knew nothing about the previous results. After that, we calculated the intraclass correlation coefficient (ICC), which could be used to evaluate the intraobserver and interobserver reproducibility.
Statistics
Commercially available SPSS version 17.0 (SPSS, Inc., Chicago, IL) was used. Continuous variables were expressed as mean ± standard deviation. One-way analysis of variance and post hoc least significant difference tests were used in the comparisons among groups. Categorical variables were shown as frequencies and compared by Fisher's exact tests. A multifactor logistic regression and the area under the receiver operating characteristic (ROC) curves (AUC) were, respectively, used to determine the significant risk factors and corresponding diagnostic values for LV remodeling (LVR) in T2DM patients. The threshold for statistical significance was two sided P < 0.05 in all analyses.
Results
Incidence of HU in the recruited patients
A half of the recruited T2DM patients had HU as co-morbidity. The incidence of HU was 50% in this study.
Baseline clinical characteristics
The patients with T2DM and HU showed significantly higher body mass index and SUA when compared with the controls and the patients with T2DM alone (P < 0.05 or P < 0.01 or P < 0.001). Meanwhile, the patients with T2DM and HU also had significantly higher FPG, TC, TG, and LDL-C when compared with the controls (P < 0.001 or P < 0.05).The patients with T2DM alone had significantly higher FPG, TC, TG, and LDL-C when compared with the controls (P < 0.001 or P < 0.01). No significant difference was found in the course of multigroup comparisons for the remaining listed variables (all P > 0.05) (Table 1).
Comparison of Demographic and Clinical Characteristics
P < 0.05 versus controls, ▵ P < 0.01 versus controls, ⋆ P < 0.001 versus controls, ▴ P < 0.01 versus T2DM alone, ★ P < 0.001 versus T2DM alone.
BMI, body mass index; DBP, diastolic blood pressure; FPG, fasting plasma glucose; HDL-C, high-density lipoprotein cholesterol; HR, heart rate; HU, hyperuricemia; LDL-C, low-density lipoprotein cholesterol; SBP, systolic blood pressure; SUA, serum uric acid; T2DM, type 2 diabetes mellitus; TC, total cholesterol; TG, triglyceride.
Conventional echocardiography measurements
The patients with T2DM and HU showed significantly higher LA size, LV wall thickness, and LVMI when compared with the controls and the patients with T2DM alone (P < 0.01 or P < 0.05 or P < 0.001). The patients with T2DM alone had significantly higher RWT when compared with the controls (P < 0.05). The difference in the remaining listed variables was found to be not significant enough in statistics among groups (all P > 0.05) (Table 2).
Comparison of Conventional Echocardiography Characteristics
P < 0.05 versus controls, ▵ P < 0.01 versus controls, ⋆ P < 0.001 versus controls, * P < 0.05 versus T2DM alone, ▴ P < 0.01 versus T2DM alone, ★ P < 0.001 versus T2DM alone.
E, the peak early filling (E wave) velocity at mitral orifice; A, the peak late filling (A wave) velocity at mitral orifice; E’, the mitral annular peak velocity during early diastole; A’, the mitral annular peak velocity during late diastole.
2DEF, two-dimensional ejection fraction; LAD, left atrial diameter; LAV, left atrial volume; LVDd, left ventricular end-diastolic diameter; LVMI, LV mass index; IVS, interventricular septum; PW, posterior wall; RWT, relative wall thickness.
2D LV morphology
The proportions of four different types of LV patterns showed significant differences within the three groups (P = 0.0001). Normal geometry accounted for a larger majority (80%) of the observations in the control group, whereas the three abnormal patterns were found more frequently in the T2DM patients, both those without and with HU (42.5% and 67.5%, respectively). Furthermore, LVH (both concentric and eccentric) was the most prevalent among the T2DM patients with HU (25%) (Table 3 and Fig. 2).
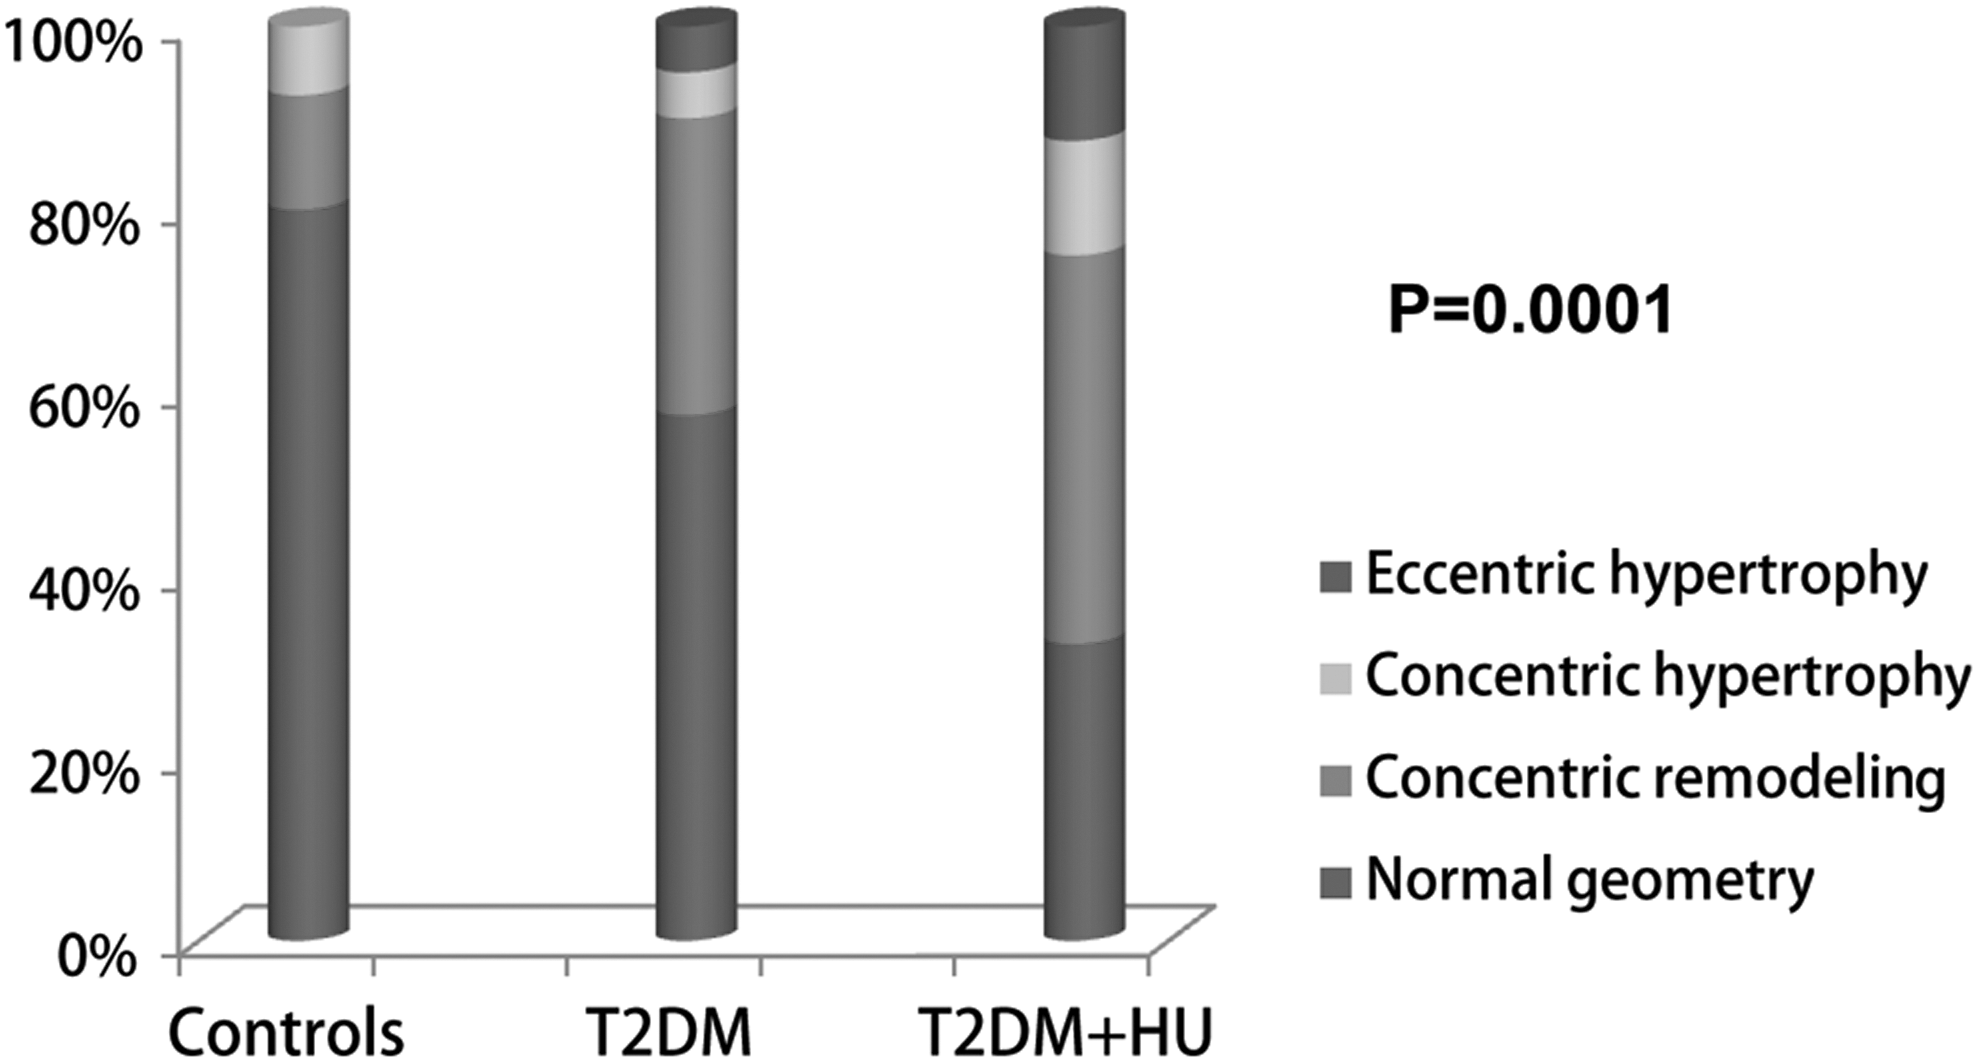
The constituent ratio of 2D LV morphology in the controls and T2DM patients with or without HU. HU, hyperuricemia; T2DM, type 2 diabetes mellitus.
Comparison of Constituent Ratio of Left Ventricular Morphology in2DE
Risk factors for LVR
The independent variables in the logistic regression model should be prespecified. These included the main clinical data with statistical significance and biologic plausibility. After stepwise analyses and exclusion, the final result indicated that FPG and SUA were two significant risk factors associated with LVR in T2DM patients (Table 4).
Logistic Regression for the Risk Factors Associated with Left Ventricular Remodeling
Bold indicated value of P < 0.05.
CI, confidence interval; OR, odds ratio; SBP, systolic blood pressure.
Diagnostic values
The diagnostic values of FPG and SUA for LVR in T2DM patients were evaluated by the AUC values in ROC curves. They were both close to 0.7 (Table 5 and Fig. 3).
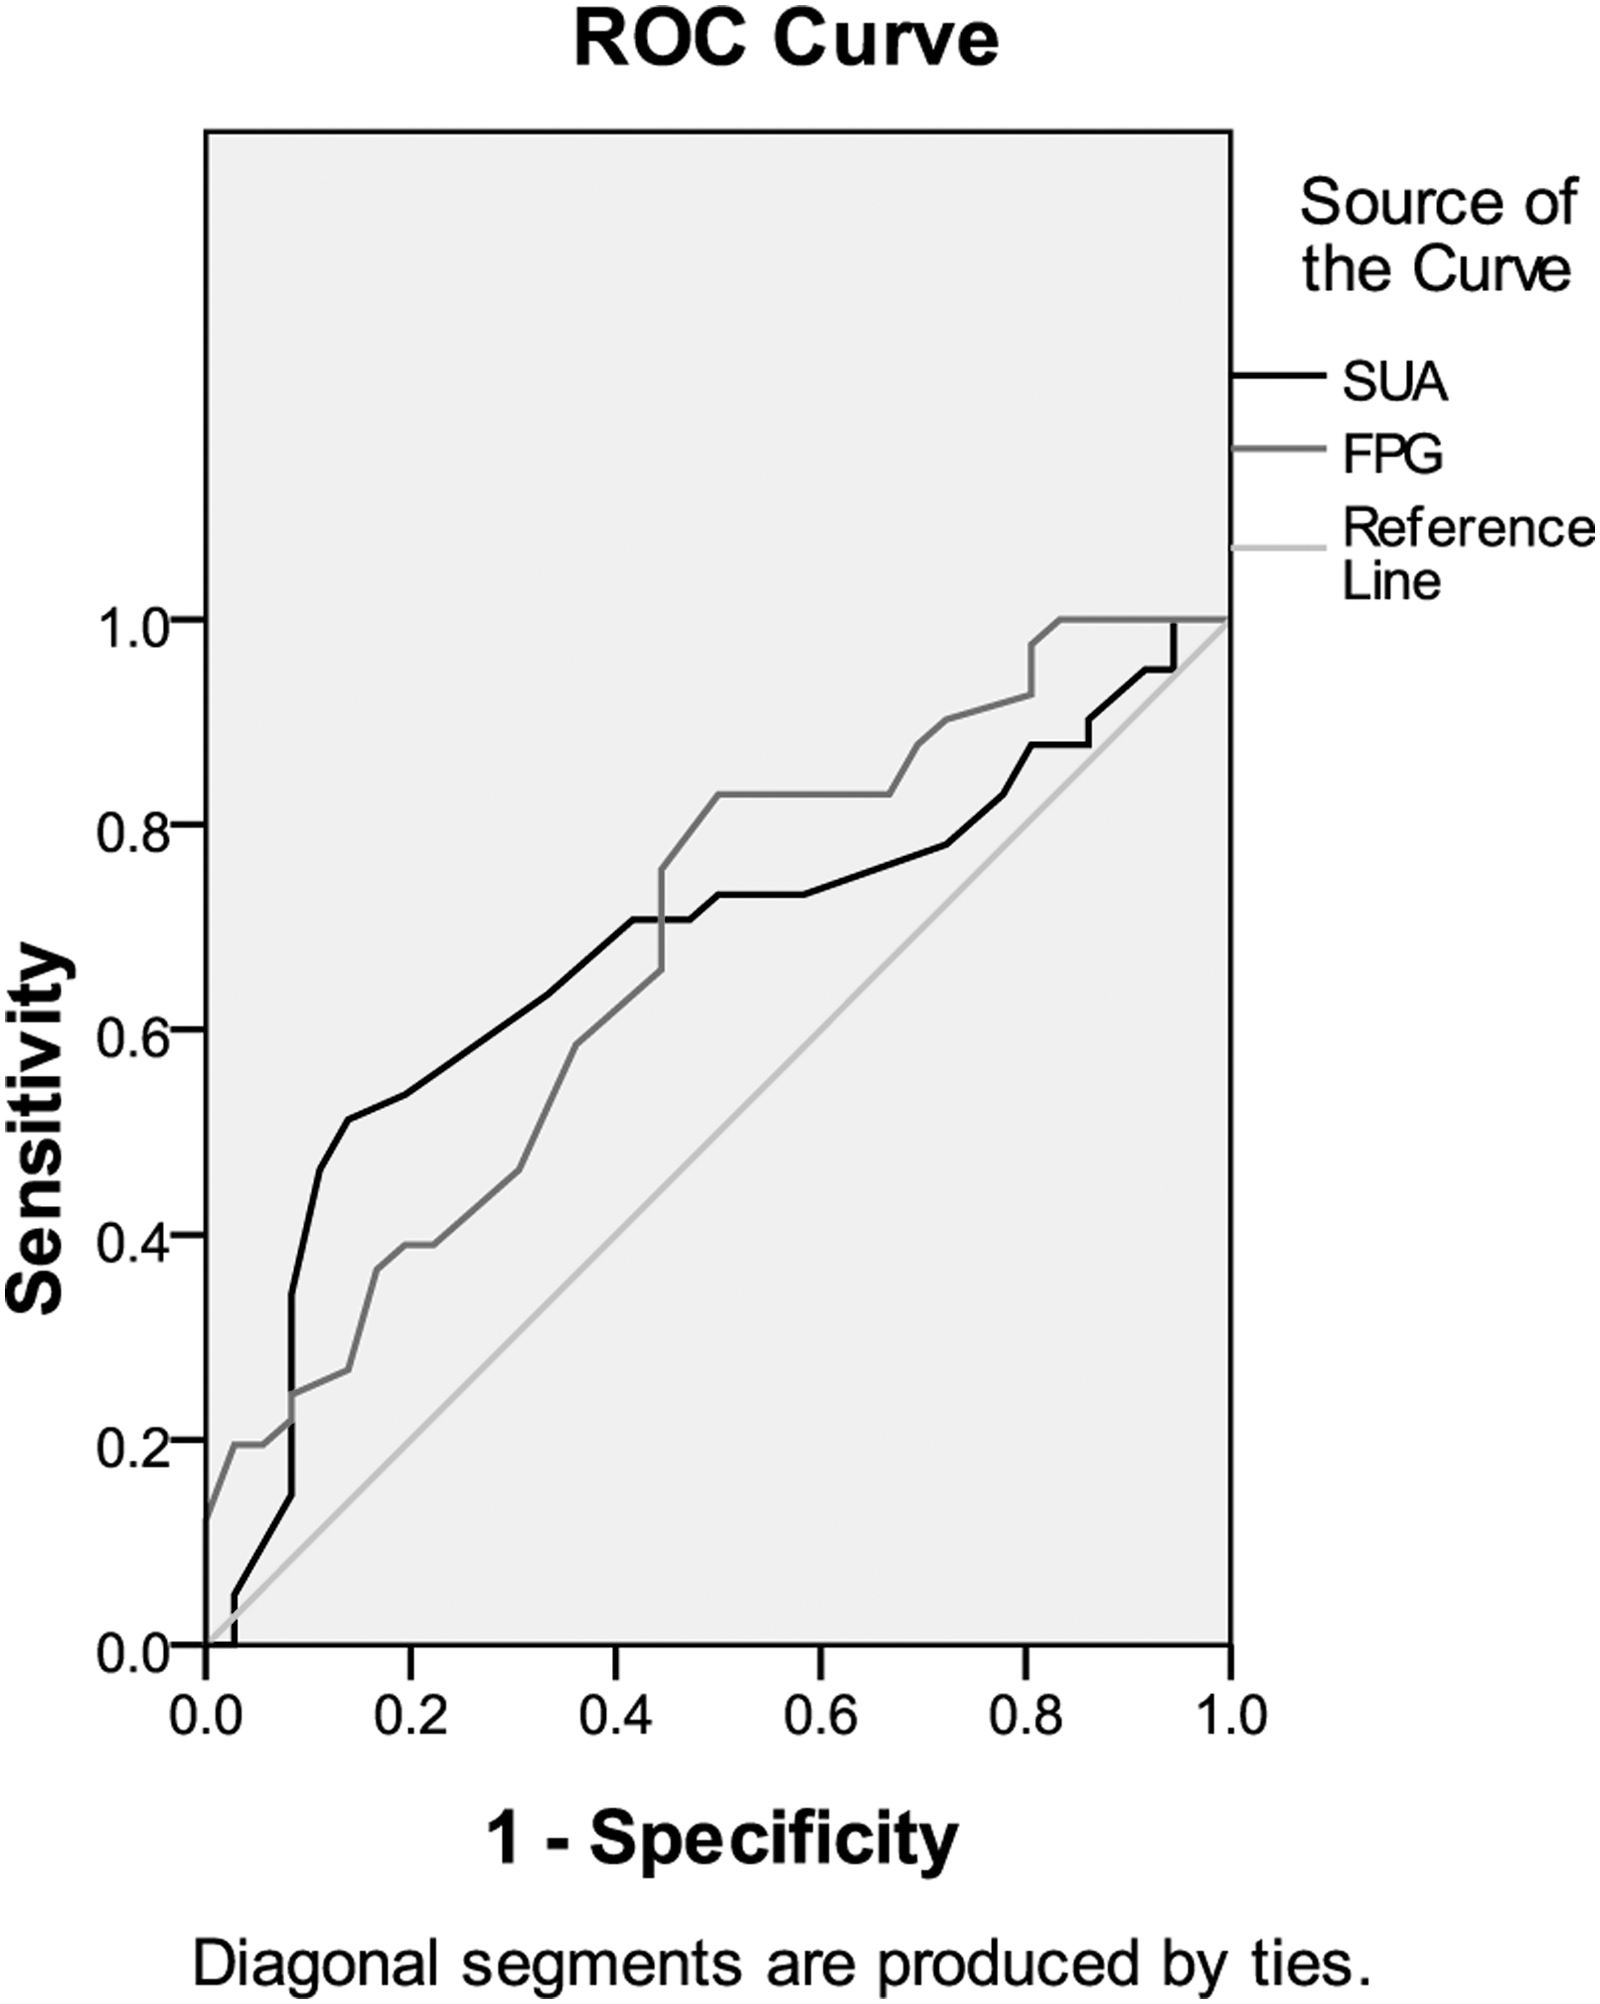
ROC curves of the diagnostic values of FPG and SUA for LVR in T2DM patients. FPG, fasting plasma glucose; LVR, LV remodeling; ROC, receiver operating characteristic; SUA, serum uric acid.
Area Under the Receiver Operating Characteristic Curves
Bold indicated value of P < 0.05.
AUC, area under the receiver operating characteristic curve.
3DSTE measurements
Various differences in LV structure and function were detected by 3DSTE among the three groups. First, LVM measured by 3DSTE was significantly higher in the patients with T2DM and HU when compared with the other two groups (P < 0.05). Second, LVEF values measured by 3DSTE, which were normal in all observations, showed no significant difference among the three groups. However, there was a significant trend for lower strain values in T2DM groups than in the controls. GLS was significantly lower in the patients with T2DM alone in comparison with the controls (P < 0.05), whereas GLS, GCS, GAS, and GRS were all significantly lower in the patients with T2DM and HU when compared with the controls (P < 0.001or P < 0.01). Furthermore, GLS, GCS, and GAS in the patients with T2DM and HU were significantly lower than those in the patients with T2DM alone (all P < 0.05) (Table 6, Fig. 4).
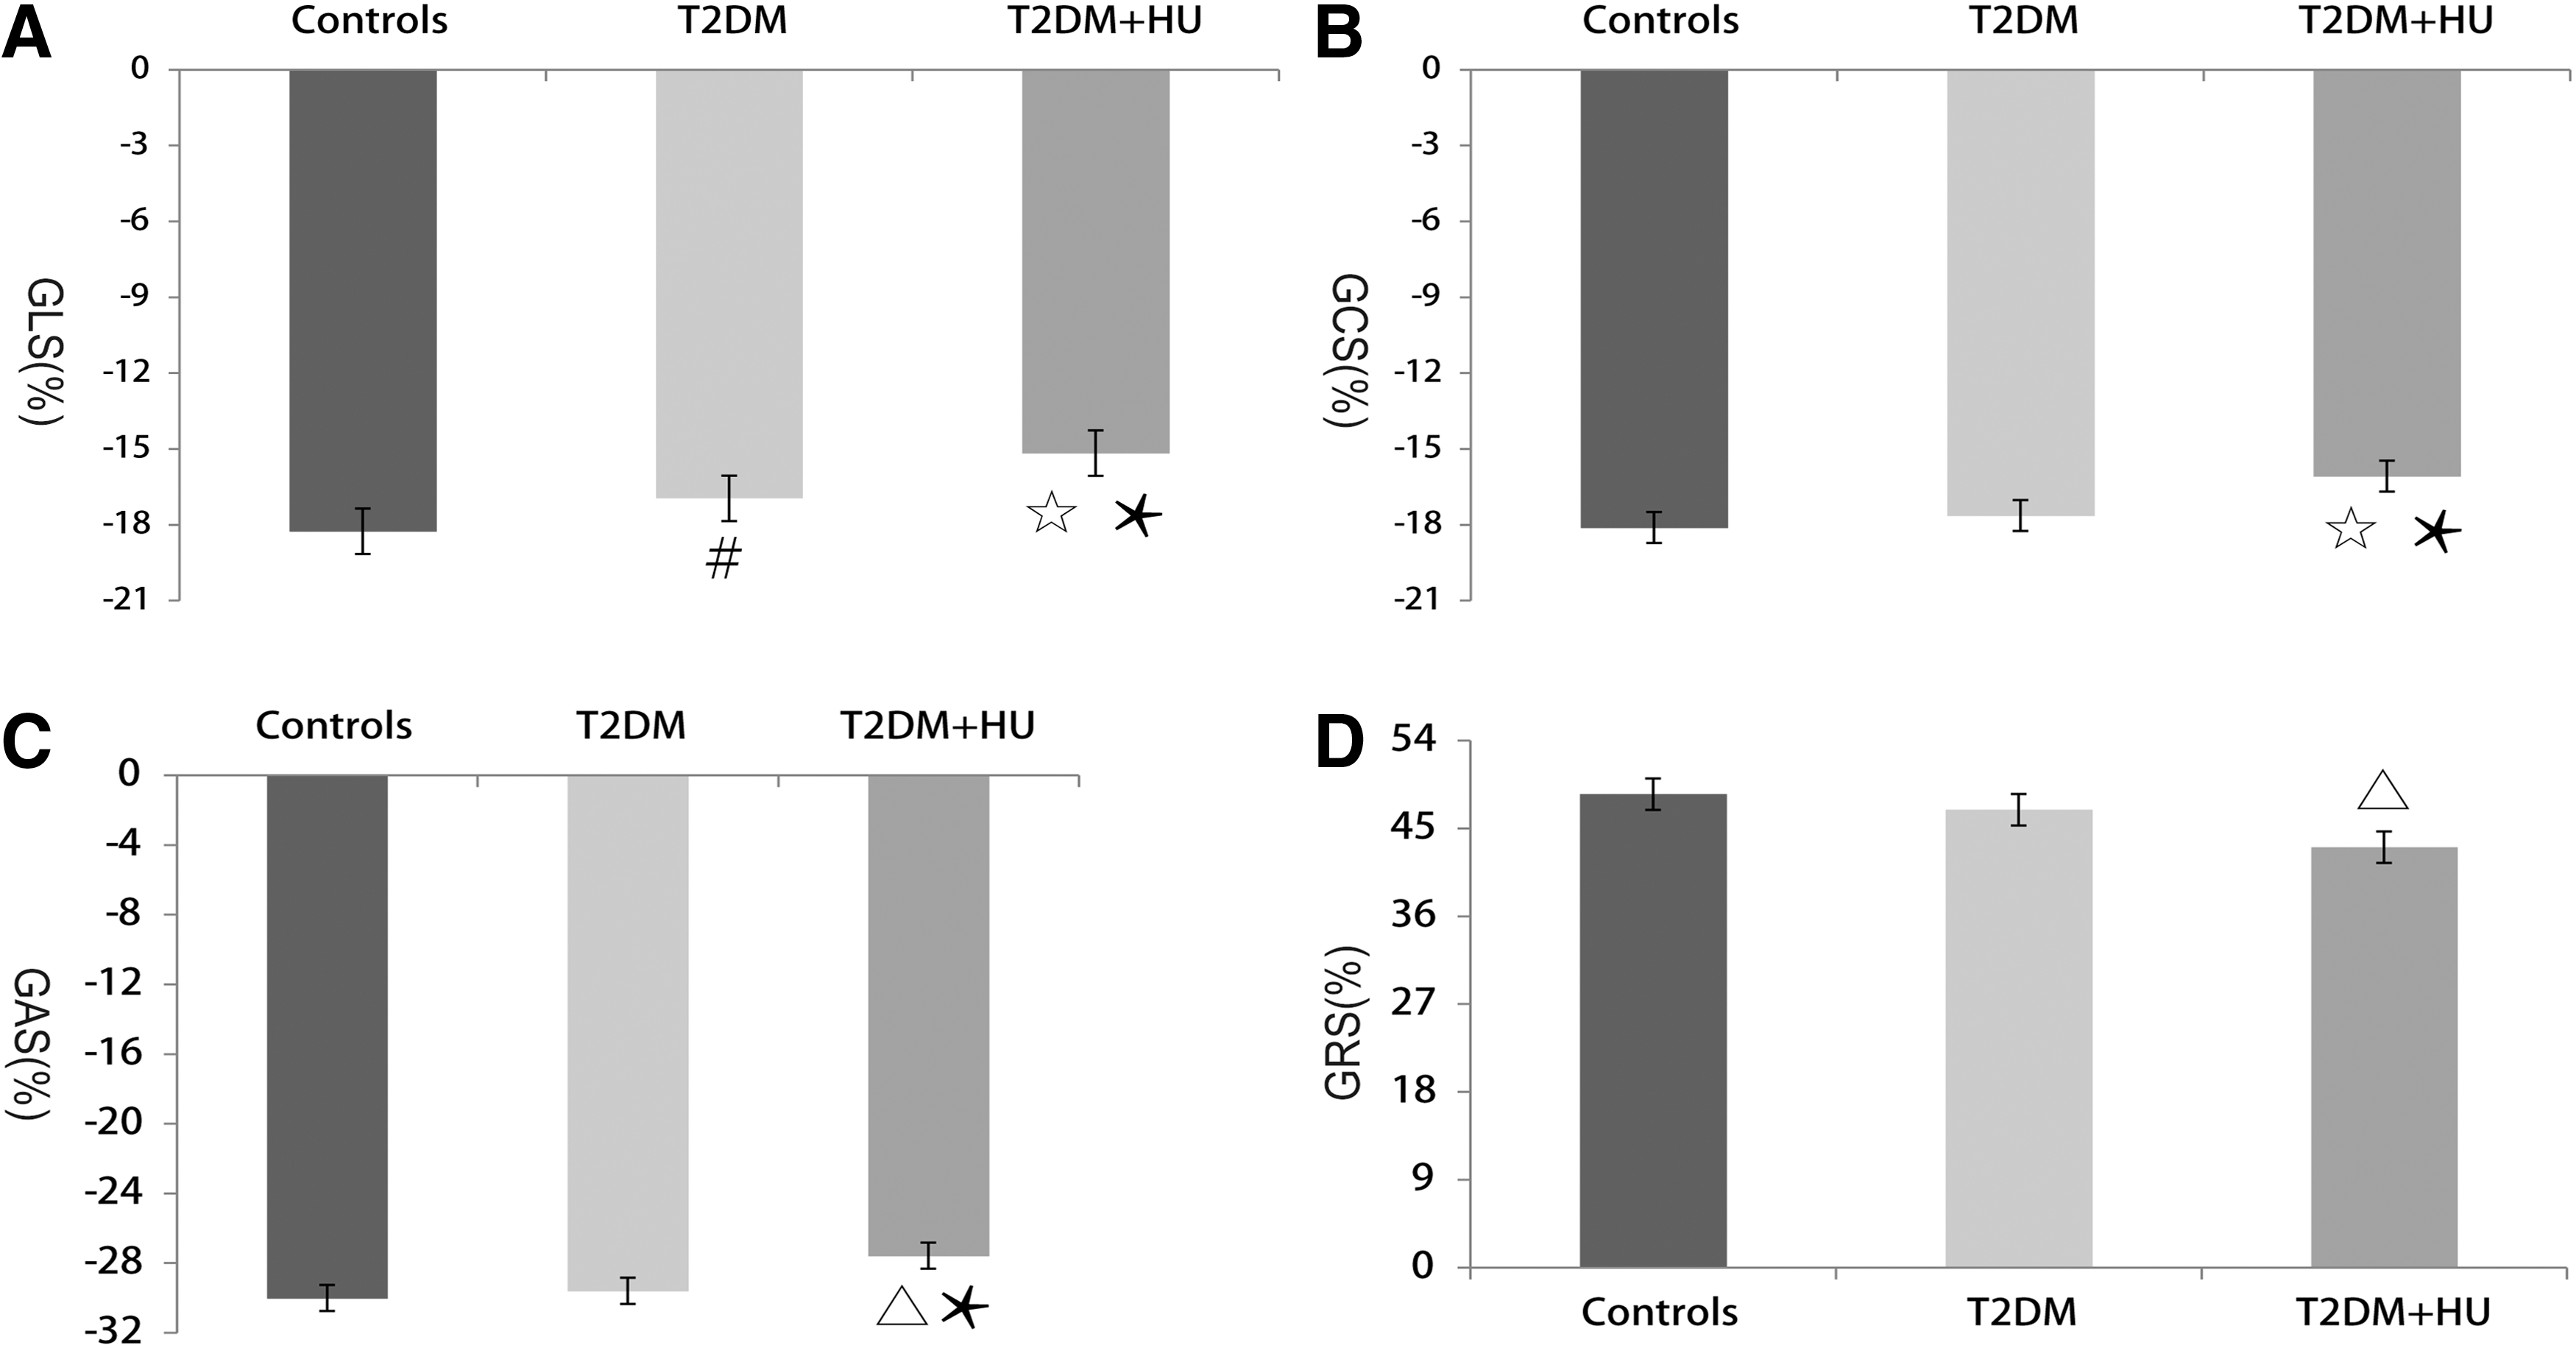
The comparison of GLS
Comparison of Three-Dimensional Speckle Tracking Parameters
P < 0.05 versus controls, ▵ P < 0.01 versus controls, ⋆ P < 0.001 versus controls, * P < 0.05 versus T2DM alone.
EDV, end-diastolic volume; EF, ejection fraction; ESV, end-systolic volume; GAS, global area strain; GCS, global circumferential strain; GLS, global longitudinal strain; GRS, global radial strain.
Reproducibility
The ICC values of intra- and interobserver variability for 3D strain are summarized in Table 7.
Intraclass Correlation Coefficient Values of Observer Variability for Three-Dimensional Strain
ICC, intraclass correlation coefficient.
Discussion
In this study, we explored the LV structural abnormality and its risk factors in T2DM patients with or without HU and compared LV function in these patients. The main findings were summarized as follows: (1) Compared with the controls, abnormal LV patterns were found more frequently in the T2DM groups regardless of SUA levels. (2) FPG and SUA were two significant risk factors for LVR in T2DM patients, and both of them had nearly moderate diagnostic values. (3) The patients with T2DM alone showed significantly lower GLS than the controls. (4) The patients with T2DM and HU showed significantly lower GLS, GCS, GAS, and GRS than the controls, and they also showed significantly lower GLS, GCS, and GAS than the patients with T2DM alone.
Abnormal LV geometry and its risk factors
In this study, the proportions of individuals with abnormal LV geometry were significantly increased in the patients with T2DM alone and in the patients with T2DM and HU when compared with the controls. Moreover, FPG and SUA were found to be two significant risk factors with moderate diagnostic values for LVR. These results together, from the level of the phenomenon and essence, profoundly revealed the effects of T2DM and HU on pathological LVR.
Adverse LVR was one of the major manifestations of most cardiovascular diseases. Hemodynamic change was considered as the most common risk factor for LVR, such as hypertension, aortic lesions, and coronary artery stenosis. 6 –8 However, in recent years, the impact of metabolic disorder on LVR had been gradually valued. Levelt et al. found that T2DM was associated with increased LV mass to volume ratio, which was a significant index of LV concentric remodeling measured by magnetic resonance imaging (MRI). 9 Lindman et al. also found a significant additive effect of T2DM on LVH in patients with aortic stenosis. 10 Similar to the above findings, in our study, the proportion of individuals with LV concentric remodeling was significantly higher in patients with T2DM alone than in the controls. Although the underlying mechanisms between T2DM and LVR were highly complex and not fully clear yet, there were also some ideas generally accepted by the public. The activation of renin-angiotensin-aldosterone system (RAAS) and myocardial steatosis induced by hyperglycemia could both lead to cardiomyocyte hypertrophy. 11,12 In addition, hyperglycemia could result in myocardial interstitial fibrosis in the advanced stages of T2DM. 13
As another common metabolic disorder, the impact of HU on LV structure had been preliminary revealed in some published literatures. Yu et al. found a significant association between HU and LVH in postmenopausal women in China. 14 Marotta et al. also observed that the individuals with HU had significantly greater LVM compared with those without HU in male elderly population. 15 In our study, the patients with T2DM and HU showed significantly higher incidence of LVR (especially LVH) than the controls and the patients with T2DM alone. The finding indicated that the coexisting HU could aggravate unfavorable LVR in T2DM patients. To our knowledge, the potential mechanism of HU-associated LVR had not been completely revealed either. One of the most likely reasons for widespread acceptance was the insulin resistance (IR). IR had been confirmed to be a key pathophysiological feature in many kinds of metabolic disorders, including HU, which could induce elevated insulin level and secondary LVH. 16,17 Therefore, the patients with T2DM and HU suffered from more frequent pathological LVR (especially LVH) when compared with the other two groups.
LV dysfunction associated with abnormal geometry
The three classical types of pathological LVR were always accompanied by varying degrees of heart failure (HF). Furthermore, from the LV normal geometry to LV concentric remodeling and then to LV concentric and eccentric hypertrophy, there seemed to be a worsening trend in cardiac hypofunction in different populations. After a large-scale and long-term study in 4768 Framingham Heart Study participants, Velagaleti et al. found that the relationship between their HF incidence and LV geometry types followed the above rules. 18 Fabiani et al. reported that the worst prognosis was correlated with LVH among the hypertensive patients with different LV geometries. 19 The quantitative analysis of myocardium could also detect the significant differences in cardiac dysfunction in different LV patterns. Plehn et al. reported that in the patients with Friedreich's ataxia, there was a significant depression of annular velocity S’ and E’ in the subjects with LV concentric hypertrophy when compared with those with LV concentric remodeling or normal geometry. 20 In the population with childhood obesity, MRI could also detect the more impaired longitudinal and circumferential strain values in those with LV concentric hypertrophy than in those with other LV geometry. 21
In our study, with the increasing proportion of the individuals with abnormal LV patterns, the systolic function measured by 3DSTE decreased significantly from the controls compared with the patients with T2DM alone and the patients with T2DM and HU. Compared with the control group which was consisted mostly of the individuals with LV normal geometry, the patients with T2DM alone showed a significantly elevated proportion of the individuals with LV concentric remodeling and significantly lower GLS value. GLS mainly reflected the contractility of longitudinal myocardial fibers. This kind of fibers located mostly in the endocardium, and played a leading role in cardiac contraction and relaxation. Compared with the circumferential and diagonal fibers, the longitudinal ones had higher energy consumption and were more susceptible to the negative stimulation in microenvironment, such as chronic ischemia, hypoxia and pressure or volume overload. 22 Besides, there were a large number of tiny coronary artery branches densely distributed in the subendocardium. These microvessels could hardly be detected by existing imaging techniques, but they played a critical role in the material exchange between the myocardium and the blood. It had been confirmed that these microvessels could be impaired first once hyperglycemia occurred. 23 Naturally, the longitudinal fibers in the endocardium could also suffer from energy deficiency earliest in such high-glucose environment. Therefore, when there was only a slight downward trend in the other three strain values, GLS had been significantly decreased in the patients with T2DM alone.
In the patients with T2DM and HU, the proportion of the individuals with LVH was significantly higher than that observed in the other two groups. Compared with LV concentric remodeling, LVH could lead to further cardiac dysfunction, whereas the impaired myocardial deformability was precisely a direct manifestation of this result. Therefore, the patients with T2DM and HU had significantly lower strain values in multiple directions than the controls and the patients with T2DM alone.
LV dysfunction associated with metabolic syndrome
HU was a manifestation of renal uric acid metabolic disorder, and it had been identified as an independent risk factor for cardiovascular diseases. Therefore, HU had also been recommended as one of the new components of metabolic syndrome (MS). 24 The synergistic effects of multiple metabolic disorders on LV function had been reported previously. Tadic et al. reported that the LV Tei index progressively increased from the patients with three MS criteria to those with five MS criteria. 25 Soufi Taleb Bendiab et al. found that high blood pressure and diabetes were both significantly associated with GLS decline after a cross-sectional study in 200 hypertensive patients. 26 In our study, three of four strain values were significantly lower in the patients with T2DM and HU than in the patients with T2DM alone. The results demonstrated that as two kinds of common metabolic disturbance, the coexistence of T2DM and HU could lead to more damage to both LV structure and function when compared with T2DM as a solo risk factor.
Limitations
A major limitation was the relatively limited size of the sample. This was dependent on the strict inclusion criteria of T2DM patients. Therefore, deeper study with a larger sample size should be made to validate the above findings. Another limitation was the difference in the strain values calculated by different speckle tracking software. Thus, the values obtained from this study might not be suitable enough to be extrapolated to other varieties of 3DSTE methods.
Conclusions
As a common metabolic disorder with relatively high prevalence in T2DM patients, HU could aggravate LV structural abnormality and systolic dysfunction in such populations. The combined application of conventional echocardiography and 3DSTE for the in-depth analyses of LV geometry and strain could clearly reveal these early cardiac damages, which could easily be covered by normal LVEF.
Footnotes
Author Disclosure Statement
No conflicting financial interests exist.