




Abstract
Introduction:
Hyperuricemia has been associated with increased cardiovascular events in the general population. However, the role of serum uric acid (SUA) level on the severity of coronary artery stenosis (CAS) in nondialysis chronic kidney disease (CKD) patients is obscure.
Methods:
We implement a retrospective cohort study of 734 patients diagnosed with stage 3–5 CKD. All selected patients underwent coronary artery angiography. The associations of SUA with the present, and severity of coronary artery disease (CAD) were analyzed.
Results:
Of these 734 patients, 511 patients had angiographically proven CAD. Compared with non-CAD group, the SUA level in CAD group was much higher (388.00 vs. 363.00 μmol/l, P < 0.01). After adjusting for multiple confounding factors, a multivariate logistic regression analysis demonstrated that SUA was relevant to the presence of CAD when SUA as a continuous variable. However, this relationship was not observed with SUA as a categorical variable. In a subgroup analysis for the CAD group, we found that the rates of severe CAS in the third tertile of SUA (58.6%) was higher than that in the first tertile (41.6%) (P < 0.01). Compared with the first tertile of SUA, the third tertile of SUA was an independent risk factor for severe arterial stenosis (odds ratio, OR, 1.976 [1.203–3.248]), a pattern that was recapitulated by multivariate logistic regression analysis with SUA as a continuous variable (1.002 [1.000–1.004]).
Conclusions:
The SUA level may serve as a predictor of the severity of CAS among nondialysis CKD patients with CAD.
Introduction
Coronary artery disease (CAD) is the most common and serious cardiac disease. Despite improvement in treatment strategy, CAD remains as the major contributor toward morbidity and mortality. 1 Some recognized risk factors, such as age, high levels of cholesterol, diabetes, smoking, and hypertension only explain part of mortality. Therefore, it is urgent to find other hazard factors.
Serum uric acid (SUA) is the end product of purine metabolism. With the improvement of living standards and lifestyle changes, the prevalence of hyperuricemia is increasing year by year, ∼8.4%–13.3% among Chinese adults. 2 Emerging evidence suggests that in the general population hyperuricemia is an independent risk factor for CAD. 3 –5 However, there is still no consensus about the role of uric acid on CAD.
Previous studies have shown that hyperuricemia is associated with morbidity, mortality, and even the severity of coronary artery stenosis (CAS), whereas other studies have found that hyperuricemia is not a risk factor for CAD. 6 –9 In addition, to date, the effect of SUA on CAD in chronic kidney disease (CKD) patients is rarely studied. Madero et al. 10 reported in their research that hyperuricemia was a risk factor for all-cause mortality and cardiovascular mortality among stage 3–4 CKD patients. For 1 mg/dL increase in SUA level, the risk of cardiovascular death increased by 16%, while the risk of all-cause death increased by 17%. 10 Other research also suggested that high SUA increased mortality risk in hemodialysis patients. 11 Those studies only confirmed the association of SUA level with the presence and outcome of CAD. However, to the best of our knowledge, few studies evaluate the relationship of SUA with the severity of CAS on the basis of coronary artery angiography (CAG) in nondialysis CKD patients with 3–5 stage.
In the present study, we evaluate the relationship between the SUA level and the presence of CAD, the severity of CAS in nondialysis CKD patients with 3–5 stage.
Materials and Methods
Patients
A retrospective study was designed at Zhongda Hospital, Southeast University between August 1, 2015, and January 31, 2017. All selected subjects were diagnosed with stage 3–5 CKD, suspected to have CAD, and underwent CAG. They signed informed consent before coronary angiography. We collected the data of patients through electronic medical record and did not disclose the patients' privacy. These patients were older than 18 years of age. Patients were excluded if they had incomplete data (no baseline uric acid level or serum creatinine level), tumors, coagulopathies, infections during angiography, or previous percutaneous coronary intervention (PCI), or coronary bypass surgery. A total of 1040 patient records were retrieved from the computerized hospital database, and 306 patients were excluded according to the above criteria. Finally, 734 patients were included in the analysis.
The diagnostic criteria of CAD was according to the presence of CAS >50% in at least one main coronary artery. Patients were then assigned into two groups according to the presence of CAD. Then, those patients with CAD were divided into two subgroups according to the Gensini scores.
Demographic and Clinical Data
All data, including age, gender, body mass index, history of hypertension, and diabetes mellitus (DM), blood pressure, and laboratory parameters were obtained before coronary angiography. All biochemical and hematological tests were performed at Zhongda Hospital Southeast University laboratory.
Renal function was evaluated by estimated glomerular filtration rate (eGFR) as determined by the CKD epidemiology collaboration equation, which has been shown to be more accurate than the modification of diet in renal disease (MDRD) formula in various populations, including Asian population. 12 In our study, assuming a normal purine diet, we used epidemiological data to define hyperuricemia as a fasting serum uric level in men and postmenopausal women of ≥420 μmol/l and in nonmenopausal women of ≥360 μmol/l.
Gensini scoring system
To estimate the severity of CAS, the results of coronary angiography were evaluated by the Gensini scoring (GS) system. 13 The scores of the GS system were conducted as previously described. 14 The severity of CAS was evaluated by two experienced cardiologists, and they were blinded to the clinical and laboratory data. The patients were divided into two groups according to GS: the mild CAS group (GS <24) and the severe CAS group (GS ≥24).
Statistical analyses
Continuous data are expressed as the mean and standard deviation or median (interquartile range, IQR), and categorical variables are expressed as percentages. Multiple comparisons were performed using the t-test or the Wilcoxon rank-sum test with P-values adjusted by Bonferroni's method. Univariable and multivariable logistic regression models were used to assess the association of independent variables with CAD, and odds ratios (ORs) and 95% confidence intervals (CIs) were derived. Those covariates with a P < 0.2 in the univariable analysis were included in the multivariable logistic regression model using the enter method. A P < 0.05 was considered statistically significant. All statistical analyses were performed using SPSS software, version 16.0 (SPSS Inc, Chicago, IL).
Ethics approval
All studies were approved by the Ethics Committee of Zhongda Hospital, Southeast University. Written consent was obtained from all individual participants for whom identifying information was included in this article.
Results
Baseline characteristics of the entire cohort
Table 1 shows the baseline demographic and clinical characteristics of the entire cohort stratified by the presence of CAD. Of the 734 patients, 511 patients had angiographically proven CAD (CAD group), and 223 patients without coronary atherosclerotic lesions (non-CAD group). The mean age of patients with CAD and without CAD was 74.33 ± 8.43 and 71.04 ± 8.82 years, respectively. The prevalence of hyperuricemia in CAD patients was significantly higher than that in patients without CAD (36.8% vs. 27.8%, P = 0.018). The mean eGFR level in patients with CAD was significantly lower (49.36 ml/min) than in patients without CAD (53.20 ml/min), (P < 0.001).
Baseline Data of the Entire Cohort Stratified by Coronary Artery Disease
Bold figures are statistically significant.
Values are expressed as the mean ± standard deviation, medians (interquartile ranges) or n (%).
BMI, body mass index; CAD, coronary artery disease; DBP, diastolic blood pressure; DM, diabetes mellitus; eGFR, estimated glomerular filtration rate; HDL, high-density lipoprotein; SBP, systolic blood pressure.
Compared with the non-CAD patients, the CAD patients were much older, more male, more complications, such as hypertension and DM, lower levels of serum albumin and high-density lipoprotein (HDL), higher levels of SUA, and reduced renal function.
Variables related to CAD
The patients were divided into three groups according to SUA tertiles as follows: the first tertile (341.55–421.00 μmol/L), the second tertile (< 341.55 μmol/L), and the third tertile (>421.00 μmol/L). As shown in Table 2, univariate logistic analysis showed that older age, male sex, presence of hypertension and DM, albumin, HDL, renal function, and uric acid were associated with CAD. In this study, we mainly focused on SUA. As a categorical variable, when stratified by tertile, in the multivariable logistic model, the second tertile of uric acid had a positive association with the presence of CAD compared with the first tertile (OR, 0.634; 95% CI, 0.415–0.970), whereas no relationship between the third tertile of uric acid and CAD was observed after multivariate adjustment (Table 3). However, with SUA as a continuous variable, we found that SUA was a risk factor for the presence of CAD.
Logistic Regression Analysis of Risk Factors Associated with Coronary Artery Disease
Bold figures are statistically significant.
“↑”arrows mean the risk of coronary artery disease per unit increase for each variable.
Abbreviations are as shown in Table 1.
OR, odds ratio.
Multivariate Logistic Regression Analysis of the Relationship of Uric Acid to Coronary Artery Disease
Bold figures are statistically significant.
Adjusted for age, BMI, SBP, DBP, hypertension, DM, Hb, albumin, total cholesterol, triglyceride, HDL, renal function.
These were stratified by tertiles according to sex.
Stands for P trend.
Abbreviations are as shown in Table 1.
SUA, serum uric acid.
Characteristics of patients with CAD
We further investigated whether an increased SUA level was related to the degree of CAS. Among the entire cohort, 511 patients were diagnosed with CAD. According to the GS system, we divided patients with CAS into two groups: a mild CAS group (n = 262) and a severe CAS group (n = 249). We observed no difference in age between the two groups. Male patients were much more common in the severe CAS group. DM was the only significant comorbid condition for critical stenosis (22.5% vs. 38.2%, P < 0.001). Hypertension was more prevalent in the severe CAS group, but the difference was not statistically significant (80.9% vs. 77.1%, P = 0.328).
Compared with the mild CAS group, patients in the severe CAS group had reduced renal function, serum protein (40.40 vs. 38.90, P < 0.001), and HDL levels (1.19 ± 0.29 vs. 1.11 ± 0.28, P = 0.001) were significantly lower in the severe CAS group (Table 4). Most importantly, SUA level was significantly higher in the severe CAS group (377.50 vs. 401.00, P < 0.001).
Baseline Data of Coronary Artery Disease Patients Stratified by Gensini Score
Bold figures are statistically significant.
Values are expressed as the mean ± standard deviation, medians (interquartile ranges) or n (%).
Abbreviations are as shown in Table 1.
Relationship between uric acid and the severity of CAD
These 511 patients were first divided into tertiles based on their uric acid levels: first tertile ranging from 348.00 to 428.92 μmol/l; second tertile <348.00 μmol/l; and third tertile >428.92 μmol/l. As shown in Fig. 1, compared with the first tertile, the GSs significantly increased in the third tertile (P = 0.004).
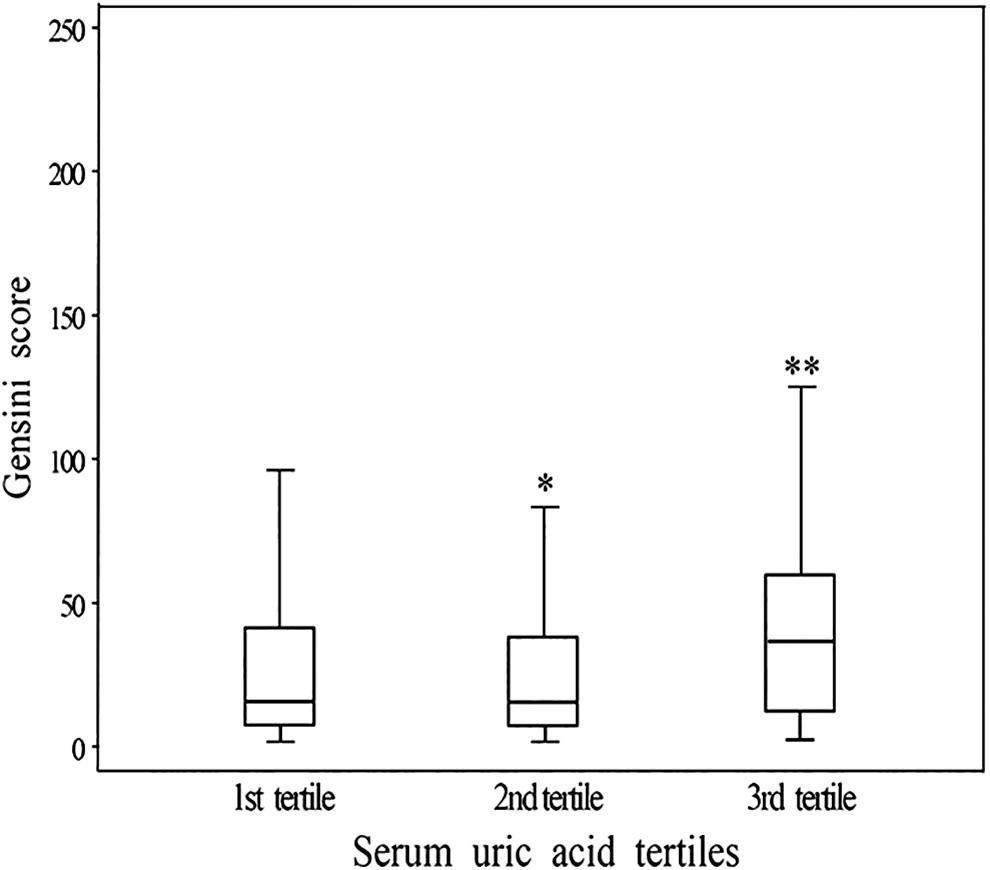
Box plot of GSs according to the tertiles of SUA. Box plot of GSs according to the tertiles of SUA. *P > 0.05 for second tertile vs. first tertile, **P = 0.004 for third tertile vs. first tertile. GSs, Gensini scoring system; SUA, serum uric acid.
Then, we evaluated if higher uric acid was a risk factor for the severity of CAS. Binary logistic regression analysis was performed to assess the effects of covariates on CAS. The variables that met this criterion were SUA, history of DM, albumin, HDL, and reduced renal function. Interestingly, compared with the first tertile, the third tertile of uric acid remained a risk factor for the severity of CAS after adjustment for other variables (OR, 1.976 [1.203–3.248]) (Table 5). The same pattern with observed when SUA as a continuous variable.
Multivariate Logistic Regression Analysis the Relationship Between Serum Uric Acid and the Severity of Coronary Artery Stenosis as Evaluated by the Gensini Score
Bold figures are statistically significant.
Adjusted for age, BMI, SBP, DBP, hypertension, DM, Hb, albumin, total cholesterol, triglycerides, HDL, and renal function.
These were stratified by tertiles according to sex.
Stands for P trend.
Abbreviations are as shown in Table 1.
Discussion
The increase of SUA level caused by decreased renal excretion is the main cause of hyperuricemia. Further studies have found that elevated level of SUA has been associated with mortality in patients with CAD, whereas other researches did not find any relation between SUA and CAD in the general population. 8,15,16 Hence, the relationship between SUA and CAD is still controversial. And more importantly, we do not know whether the changes of SUA with renal function will affect the relationship between SUA and CAD. In the present study, we found the association between the levels of SUA and the presence of CAD. Most interestingly, our striking finding was that SUA was an independent risk factor for the severity of CAS in CAD patients. As far as we know, this is the first study focusing on the effect of SUA on CAD among Chinese nondialysis CKD patients on the basis of CAG.
SUA is the final oxidation product of purine catabolism in humans, which is excreted through the kidneys. With the decline of renal function, hyperuricemia occurs frequently. Previous study had confirmed that SUA is negatively associated with eGFR in the reduced renal function stage in individuals with type 2 diabetes mellitus (T2DM) and stable CAD. 17 The present study also found an inverse association between the SUA level and the eGFR in CKD patients with CAD.
The relationship between SUA and cardiovascular disease in the general population has been reported by several studies. 3,18,19 A recent meta-analysis study found that hyperuricemia was risk factor for the presence of CAD. 18 Another prospective study also confirmed that hyperuricemia conferred 1.6-fold increased relative risk for cardiovascular death and a 1.5-fold increased risk for myocardial infarction in patients who had received PCI. 19 In contrast to these observations, others failed to find an association between either all cause or cardiovascular mortality and UA levels in the general population. 8,16,20 So far, there is no consensus about whether hyperuricemia is an independent risk factor for CAD. The present study found the relationship between hyperuricemia and the presence of CAD in nondialysis patients with stage 3–5 CKD with SUA as a continuous variable.
As we know, many studies have investigated the relationship between SUA level and CAD. However, few have explored the association between SUA and the severity of CAS on the basis of CAG, especially in CKD patients. A cross-sectional study involving 100 male patients presenting with acute coronary syndrome showed that hyperuricemia was associated with higher Gensini scores. 21 Lv et al. found that, in adults ≤35 years with acute coronary syndrome, hyperuricemia was an independent risk factor for CAD severity. 22 A case/control study further confirmed that SUA levels were associated with the presence and severity of early onset CAD. 23 However, similar studies are rare in CKD patients. Jeong et al. reported that SUA level was significantly higher in the critical stenosis group, and a high SUA level was related to severe CAS in Korean ESRD patients (OR = 3.74). 11 It is noteworthy that our data revealed that SUA level in CAD patients with nondialysis CKD was higher than that in non-CAD patients. More importantly, for CAD patients, a higher concentration of SUA was an independent risk factor for the severity of CAS (OR = 1.976). The results of the Kanbay et al. study were in agreement with our data; however, the Kanbay et al. study had a smaller sample size. 24
There are a few limitations of this study. First, it was a cross-sectional, observational and single-center study, and we did not have long-term follow-up records to evaluate the effect of uric acid levels on the prognosis of patients. Second, treatment modalities were not considered in our study; these may also affect the uric acid level and the severity of coronary stenosis. Third, there were few non-CAD patients than CAD patients, which may have affected the effectiveness of the statistics.
Conclusions
In summary, hyperuricemia appears to be associated with the severity of CAS. SUA may represent an important therapeutic target for alleviating the degree of arterial stenosis in nondialysis CKD patients.
Footnotes
Author Disclosure Statement
No competing financial interests exist.
Funding Information
This work was supported in part by Natural Science Foundation of Jiangsu Province (grant no. BK20161437); the Program for Jiangsu Medical Research Center (grant no. BL2014080); and National Natural Scientific Foundation of China (grant no. 31571186 and 81770735).