




Abstract
Background:
The triglyceride (TG)/high-density lipoprotein cholesterol (HDL-C) ratio is related to insulin resistance (IR). However, little information is available on whether TG/HDL-C is associated with IR and components of metabolic syndrome (MetS) and how lifestyle habits affect TG/HDL-C in the healthy Japanese population.
Methods:
In total, 1068 Japanese subjects who had undergone an annual health examination and who were not receiving medication were recruited. Determinants for TG/HDL-C ratio were investigated using multiple regression analyses. The subjects were divided into three groups by lifestyle habits (i.e., smoking, exercise, and physical activity), homeostasis model assessment of IR (HOMA-IR), and fasting plasma glucose, four groups by alcohol intake, and five groups by numbers of MetS components to compare TG/HDL-C values. All analyses were done separately by sex.
Results:
Multiple regression analyses revealed that waist circumference and smoking were positively associated with TG/HDL-C in both men and women, whereas physical activity was negatively associated with TG/HDL-C ratio in women. TG/HDL-C increased with increasing number of MetS in both men and women. TG/HDL-C increased as HOMA-IR increased in both men and women, when subjects were stratified according to HOMA-IR. TG/HDL-C values were lower in both men and women who exercised regularly, had high physical activity, or were nonsmokers. Independent of exercise and physical activity, TG/HDL-C was higher in smokers than in nonsmokers for both men and women. The relationship between TG/HDL-C and alcohol intake was not statistically significant in both men and women.
Conclusions:
The TG/HDL-C ratio is associated with IR, components of MetS, exercise, physical activity, and smoking, but not alcohol intake, in healthy Japanese subjects.
Introduction
Insulin resistance (IR) underlies many pathological conditions, including metabolic syndrome (MetS), atherosclerosis, hypertension, and diabetes mellitus; therefore, it is crucial to measure IR. Although the homeostasis model assessment of IR (HOMA-IR) is a marker of IR, fasting insulin levels, which are a requirement to calculate HOMA-IR, are not routinely measured in clinical settings. The triglyceride (TG)/high-density lipoprotein cholesterol (HDL-C) ratio has been shown to strongly correlate with IR 1 –3 and appears to be a useful predictor for the development of diabetes, 4 coronary heart disease, and cardiovascular mortality. 5
The TG/HDL-C ratio has been shown to be a better screening index for MetS than HOMA-IR. 6 In Japanese adults, it is reported that lipid ratios of TG/HDL-C, Total-C/HDL-C, LDL-C/HDL-C, and TG and HDL-C were associated with MetS and IR. The receiver operating characteristic curve analyses showed that the best marker for these variables was TG/HDL-C ratio in both men and women. 7 However, there has been a very limited number of studies that have investigated this ratio as an indicator of MetSs in specific populations. 7,8
The hyperinsulinemic-euglycemic clamp remains the gold standard for IR 9 and HOMA-IR is the most widely used alternative to date. 10,11 However, they are impractical in clinical practice mainly due to cost, accessibility, reproducibility, and replicability. 9,11 –14 Thus, alternative markers are tried to develop and assess for IR in recent years. 15
It is known that hypertriglyceridemia and low levels of HDL-C play an important role in the pathogenesis of IR and MetS. 16 –20 Increased production of fatty acids as a result of IR leads to increased TG and very low-density lipoprotein (VLDL) production, increasing cholesteryl ester transfer protein activity and TG enriched but CE depleted HDL. 21 This means that HDL-C levels are decreased within IR. In addition, both TG and HDL-C levels are known to be closely associated with exercise in addition to food and alcohol intake. However, there is still very little information available on how lifestyle habits affect TG/HDL-C.
Racial/ethnic variations in both TG and HDL-C levels and an ethnicity-dependent association of TG/HDL-C with IR have also been suggested. 1,22,23 Therefore, it is important to determine whether positive association of TG/HDL-C ratio with IR could also be observed in the adult Japanese population.
This study was designed to investigate whether the TG/HDL-C ratio is associated with IR and components of MetS in Japanese adults. In addition, we evaluated the impact of lifestyle habits, including exercise, physical activity, smoking, and alcohol consumption, on the TG/HDL-C ratio in Japanese subjects.
Materials and Methods
Subjects
A total of 1329 subjects undergoing an annual health examination at the Health Evaluation and Promotion Center of Tokai University Hachioji Hospital between April 2011 and March 2015 were included in this cross-sectional study. After excluding 261 subjects who were taking medication for hypertension, diabetes mellitus, dyslipidemia, hyperuricemia, or chronic renal disease, in addition to subjects with a history of stroke, coronary artery disease, or chronic renal failure, 1068 subjects were included in the final analysis. Medical histories were obtained using self-administered questionnaires and through interviews conducted by nurses.
Measurements
Waist circumference (WC) was measured at the level of the umbilicus during slight expiration, with the participant in a standing position. Blood pressure (BP) was measured on the upper right arm using an automatic BP monitor (TM-2655P; A&D, Tokyo, Japan) while the participant was seated. Blood samples were collected in heparin-coated tubes early in the morning after an overnight fast. Fasting plasma glucose (FPG) was measured with an L-type Glu 2 kit using the hexokinase/glucose-6-phosphate dehydrogenase method (Wako Pure Chemicals, Osaka, Japan). Fasting immunoreactive insulin (FIRI) levels were measured using a fluorescence enzyme immunoassay (ST AIA-PACK IRI; Toso, Tokyo, Japan). HOMA-IR was calculated as follows: FPG (mg/dL) × FIRI (μU/mL)/405. 24 Serum high-sensitivity C-reactive protein (hsCRP) levels were measured using latex agglutination turbidimetry. Low-density lipoprotein cholesterol (LDL-C) levels were calculated using the Friedewald formula. 25 HDL-C and TG levels were measured using visible spectrophotometry (Determiner L HDL-C and Determiner L TG II, respectively; Kyowa Medex, Tokyo, Japan). Uric acid (UA) levels were measured with an L-Type UA M kit using the uricase-N-(3-sulfopropyl)-3-methoxy-5-methylaniline method (Wako Pure Chemicals).
Alcohol consumption was determined based on units of sake consumed per day, such that one unit (180 mL) was considered equivalent to 25 grams of alcohol. Alcohol consumption was recorded in the self-administered survey as follows: nonconsumer of alcohol, social drinker or <25 grams ethanol/day, 25 to <50 grams ethanol/day, 50 to <75 grams ethanol/day, and ≥75 grams ethanol/day.
Verbal consent for the use of anonymized health records was obtained from all study participants. The study protocol was approved by the Ethics Committee of the Tokai University School of Medicine (protocol no. 14R-109).
Definition of MetS
Diagnosis of MetS was based on the presence of any three of the following five factors: central obesity, determined by WC (≥85 cm in men ≥90 cm in women); increased FPG levels (≥100 mg/dL); increased TG levels (≥150 mg/dL); low HDL-C levels (<40 mg/dL in men and <50 mg/dL in women), and an elevated BP (systolic BP ≥130 mmHg or diastolic BP ≥85 mmHg). 26 These factors were primarily defined by the International Diabetes Federation criteria joint interim statement. 27
Statistical analyses
Data are expressed as the mean ± standard deviation or median (inter-quartile range). Normality was examined using the Kolmogorov–Smirnov test. Bonferroni's multiple comparison test was used to compare mean values across three or more groups. Student's t-test was used to compare mean values between two groups. The subjects were divided into three groups by lifestyle habits (i.e., smoking, exercise, and physical activity), HOMA-IR (by tertile), and FPG (<100 mg/dL, 100 to <126 mg/dL, and ≥126 mg/dL), four groups by alcohol intake, and five groups by numbers of MetS components to compare TG/HDL-C values. A multiple linear regression analysis was performed to identify significant determinants of TG/HDL-C ratio. Body mass index (BMI), WC, systolic and diastolic BP, FPG, FIRI, LDL-C, logarithmic transformed hsCRP [ln(hsCRP)], physical activity, alcohol intake, and smoking status were used as independent variables in the multiple linear regression analysis for TG/HDL-C. We then performed a multiple logistic regression analysis to calculate the odds ratios for the upper tertile of TG/HDL-C, using the same variables listed for the multiple linear regression analysis. Parsimonious models were created using a stepwise procedure for multiple regression analyses. Participants were classified as nonsmokers or current smokers. Participants exercising equivalent to 3.5 metabolic equivalent (MET) (walking on flats at 75–85 m/min) for ≥30 min/day more than twice per week were classified as regular exercisers. Besides regular exercise, participants with any movement of their body that is equivalent to 3.0 MET (walking on flats at 67 m/min or walking with dog) for ≥60 min/day were classified as subjects with high physical activity. Participants with a daily alcohol intake ≥25 grams were classified as regular drinkers. All analyses were done separately by sex, as earlier study suggested that TG/HDL-C ratio varies between men and women. 28 All statistical analyses were performed using SAS studio version 3.4 (SAS Institute, Cary, NC). All P-values were two-tailed, and a P-value of <0.05 was defined as statistically significant.
Results
All of the characteristics evaluated in this study are shown in Table 1, with data stratified by sex. Out of the 1068 subjects included, 417 (39.0%) were women. The mean age, median TG, mean HDL-C, and median TG to HDL-C ratio of the men were 55.5 years, 103.0 mg/dL, 59.4 mg/dL, and 1.74, respectively. The mean age, median TG, mean HDL-C and median TG to HDL-C ratio for women were 57.6 years, 73.0 mg/dL, 76.4 mg/dL, and 0.95, respectively. Most markers were higher in men than in women, with the exception of age, LDL-C, and hsCRP.
Characteristics of Study Subjects
Variables are given as means ± standard deviations or median (inter-quartile range). ** P < 0.01, * P < 0.05 by unpaired t-test.
BMI, body mass index; BP, blood pressure; eGFR, estimated glomerular filtration rate; FIRI, fasting immunoreactive insulin; FPG, fasting plasma glucose; HDL-C, high-density lipoprotein cholesterol; HOMA-IR, homeostasis model assessment of insulin resistance; hsCRP, high-sensitivity C-reactive protein; LDL-C, low-density lipoprotein cholesterol; MetS, metabolic syndrome; TG, triglyceride; UA, uric acid; WC, waist circumference.
Determinants of the TG/HDL-C ratio were identified by multiple linear regression analysis (Table 2). Among the variables included in this study (age, BMI, WC, systolic and diastolic BP, FPG, FIRI, LDL-C, regular exercise, physical activity, alcohol intake, and smoking status), three variables (WC, FIRI, and smoking status) for men (“a” in Table 2) and five variables (WC, FPG, LDL-C, smoking, and physical activity) for women (“b” in Table 2) were selected using a stepwise procedure The analysis revealed that WC, FIRI, and smoking status were positively associated with the TG/HDL-C ratio in men (“a” in Table 2) while WC, FPG, LDL-C, and smoking status were positively associated with the TG/HDL-C ratio in women (“b” in Table 2). Additionally, physical activity was negatively associated with TG/HDL-C in women.
Multiple Linear Regression Analysis for the Triglyceride to High-Density Lipoprotein Cholesterol Ratio
Variable selection was made by a stepwise procedure.
FIRI, fasting immunoreactive insulin; FPG, fasting plasma glucose; LDL-C, low-density lipoprotein cholesterol; RC, regression coefficient; SRC, standardized regression coefficient; WC, waist circumference.
Determinants for the upper tertile of TG/HDL-C were analyzed using a multiple logistic regression analysis (Table 3). When we analyzed the same variables in multiple linear regression analysis (age, BMI, WC, systolic and diastolic BP, FPG, FIRI, LDL-C, regular exercise, physical activity, alcohol intake, and smoking status), six variables [age, WC, FIRI, ln(hsCRP), smoking status, and alcohol intake] for men (“a” in Table 3) and four variables (WC, LDL-C, smoking, and physical activity status) for women (“b” in Table 3) were selected using a stepwise procedure. The results of the analysis revealed that WC, FIRI, ln(hsCRP), smoking status, and alcohol intake for men “a” in Table 3) and WC, LDL-C, and smoking status for women (“b” in Table 3) were positively associated with the upper tertile of TG/HDL-C. Age for men and physical activity for women were negatively associated with the upper tertile of TG/HDL-C.
Multiple Logistic Regression Analysis for the Upper Tertile of Triglyceride to High-Density Lipoprotein Cholesterol Ratio
Variable selection was made by a stepwise procedure.
CI, confidence interval; FIRI, fasting immunoreactive insulin; ln(hsCRP), logarithmic transformed (ln) high-sensitivity C-reactive protein; LDL-C, low-density lipoprotein cholesterol; OR, odds ratio; RC, regression coefficient; SE, standard error; WC, waist circumference.
Multiple linear and logistic regression analyses revealed that some of the selected parameters (i.e., WC and FPG) were components of MetS. To investigate the relationship between TG/HDL-C and MetS, mean TG/HDL-C was compared according to the number of MetS. For both men and women, TG/HDL-C increased as the number of MetS components increased (Fig. 1). The relationship between TG/HDL-C and IR was also investigated when subjects were stratified according to HOMA-IR. For both men and women, TG/HDL-C increased as HOMA-IR increased (Fig. 2). The relationship between TG/HDL-C and FPG was investigated when subjects were stratified according to FPG. For both men and women, TG/HDL-C increased as FPG increased (Fig. 3).

A bar graph of mean TG/HDL-C values with 95% CIs after stratifying the subjects according to sex and number of MetS components. **P < 0.01 by Bonferroni's multiple comparison test. CI, confidence interval; MetS, metabolic syndrome; TG/HDL-C, triglyceride to high-density lipoprotein cholesterol ratio.

A bar graph of mean TG/HDL-C values with 95% CIs after stratifying the subjects according to sex and HOMA-IR. **P < 0.01 by Bonferroni's multiple comparison test. HOMA-IR, homeostasis model assessment of insulin resistance.
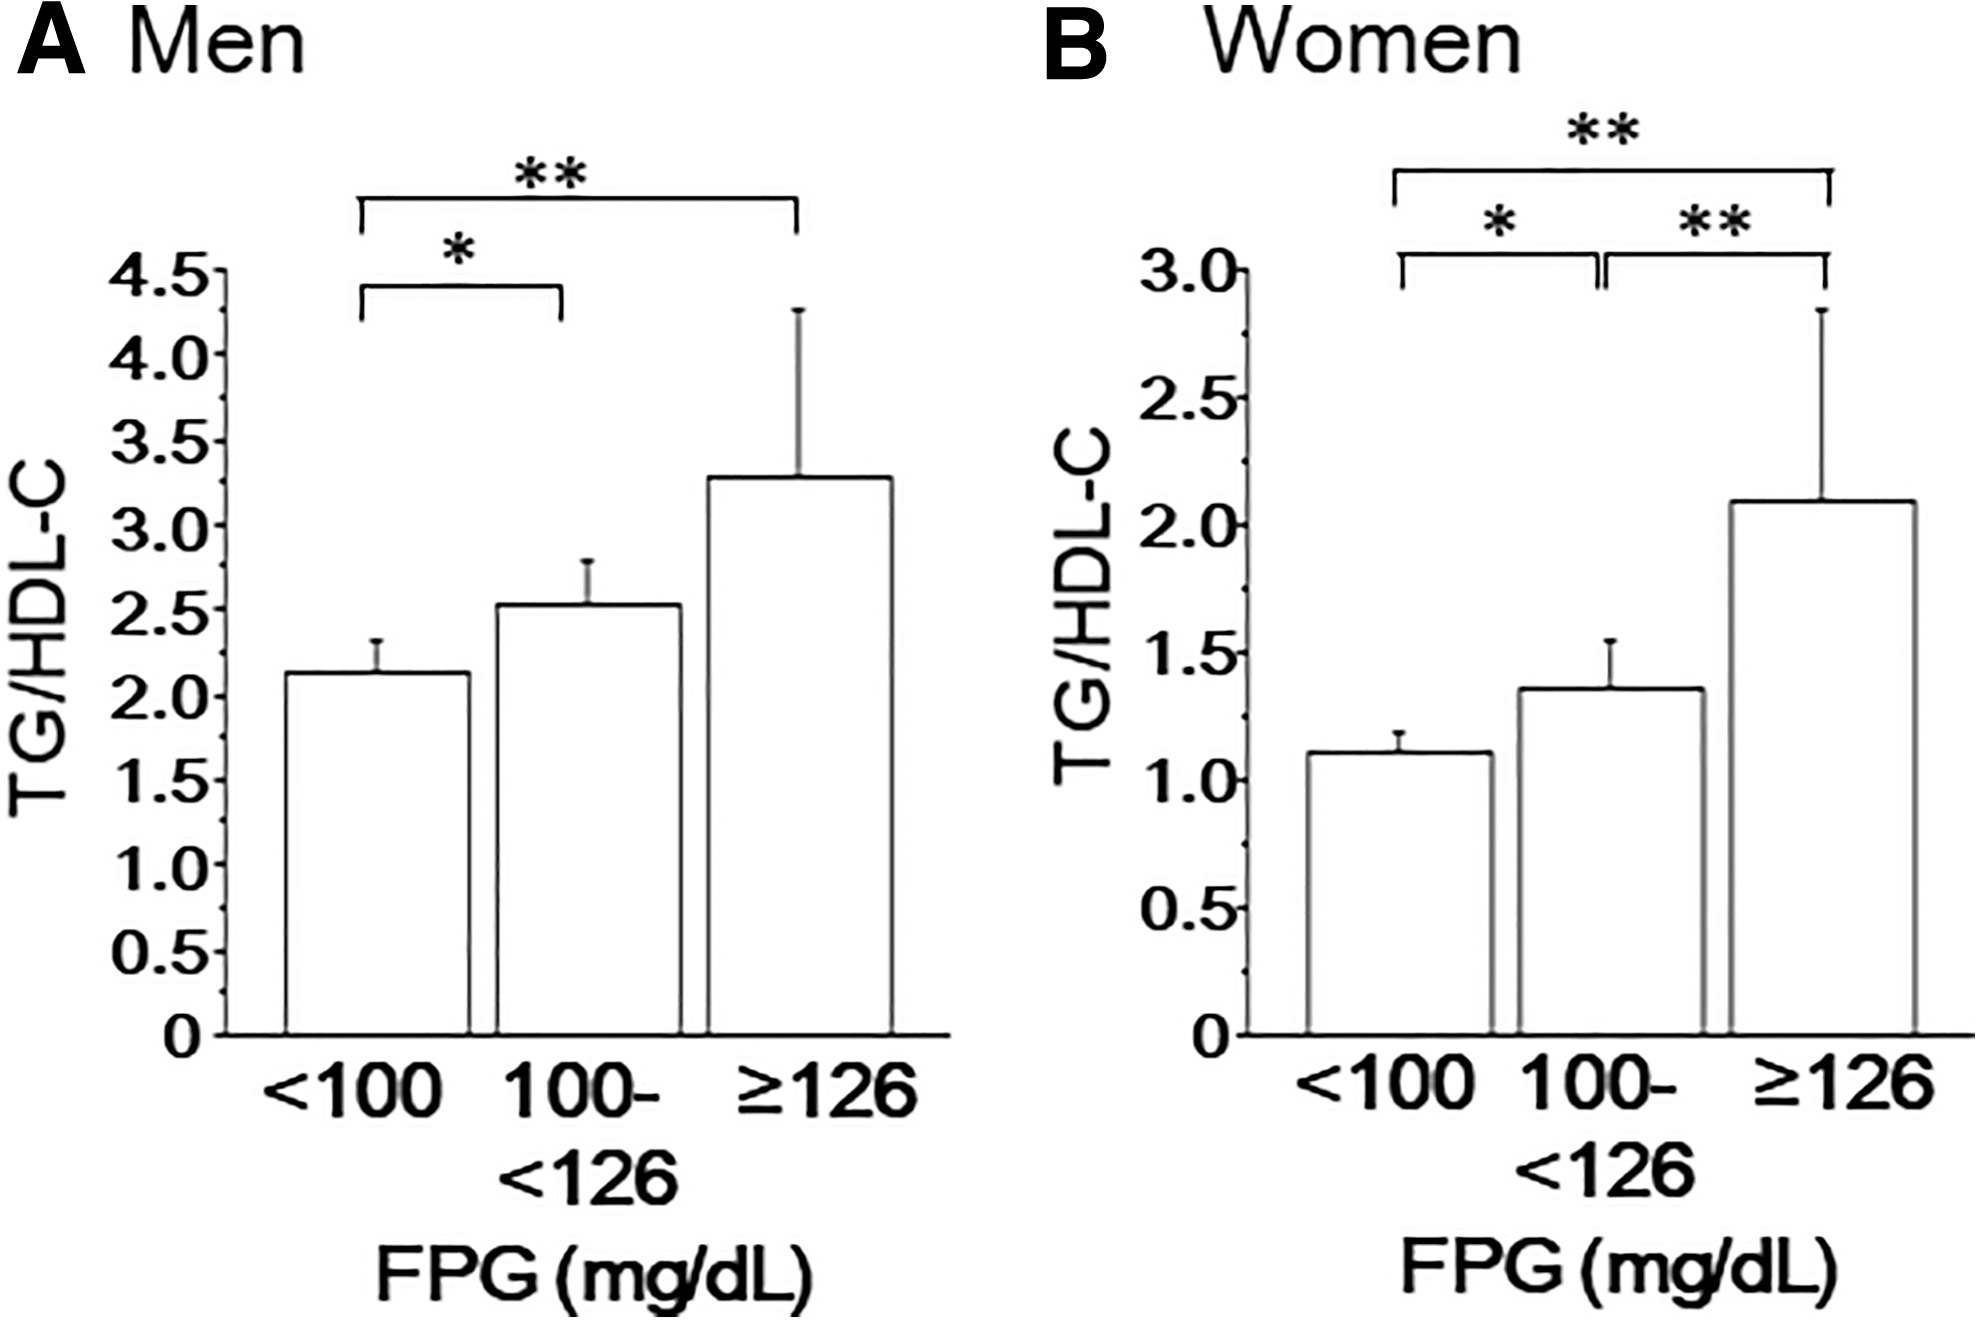
A bar graph of mean TG/HDL-C values with 95% CIs after stratifying the subjects according to sex and FPG. *P < 0.05, **P < 0.01 by Bonferroni's multiple comparison test. FPG, fasting plasma glucose.
Since lifestyle change is a priority for the management of MetS, we investigated the relationship between TG/HDL-C and various lifestyle habits. For both men and women, TG/HDL-C was lower in subjects who were habitual exercisers, with high physical activity, and were nonsmokers (“a, b” in Table 4. The relationship between TG/HDL-C and alcohol intake was not statistically significant in either group “c” in Table 4. Subjects were stratified by sex and various combinations of lifestyle habits, and TG/HDL-C ratios were compared. Independent of regular exercise and physical activity, TG/HDL-C was higher in smokers than in nonsmokers for both men and women. Subjects with high physical activity had lower TG/HDL-C ratios than those of subjects who exercise regularly, especially in men. The lowest TG/HDL-C ratio was found in those who reported the greatest amount of alcohol consumption. The nonsmokers who were regular exercisers and with high physical activity showed lowest TG/HDL-C ratio in both men and women, probably due to additive effect of exercise and physical activity (Table 5).
Comparison of Triglyceride to High-Density Lipoprotein Cholesterol Ratios Stratified by Lifestyle Habits
P < 0.01, * P < 0.05 by t-test.
CI, confidence interval; HDL-C, high-density lipoprotein cholesterol; TG, triglyceride.
Comparison of Triglyceride to High-Density Lipoprotein Cholesterol Ratios Stratified by Sex and Various Combinations of Lifestyle Habits
CI, confidence interval; HDL-C, high-density lipoprotein cholesterol; TG, triglyceride.
Discussion
The results of this study show that the TG/HDL-C ratio is associated with components of MetS and IR in healthy Japanese subjects. The results also suggest that the TG/HDL-C ratio is associated with lifestyle habits (regular exercise, physical activity, and smoking).
High TG and low HDL-C levels are known to be associated with IR, type 2 diabetes mellites (T2DM), 29 and cardiovascular diseases. 30 These parameters have been explored for the prediction/diagnosis of IR, but the discriminatory power of either TG or HDL-C alone is poor.
Since insulin quantitation is not a routine test, its use in the diagnosis of IR is not common in healthy subjects. On the contrary, TG and HDL-C are routinely measured, which means that calculation of TG/HDL-C and its use to indicate an increased risk for IR may be more practical than the use of HOMA-IR. Studies have shown that a plasma TG/HDL-C ratio of >3.5 is a strong indicator of IR. The TG/HDL-C ratio may be a simple and useful indicator for hyperinsulinemia among nondiabetic adults regardless of race/ethnicity in clinical settings. 22 In euthyroid normal-weight adults without T2DM, a high TG/HDL-C ratio is associated with IR, supporting its application as a clinically useful tool in IR diagnosis. 31 A linear association between the TG/HDL-C ratio and IR, regardless of degrees of WC, has been reported in the general Korean population. 3 The TG/HDL-C ratio might be good indicator for younger subjects. Giannini et al. concluded that it is possible that the TG/HDL-C ratio, at least in Caucasians, could help clinicians identify young obese subjects who were not only IR but also display early dysglycemia commonly associated with IR. 32 However, several points should be considered, including racial/ethnic variations in both TG and HDL-C levels. In addition, there have been reports of ethnicity-dependent associations between TG/HDL-C and IR. In African Americans, it has been reported that TG levels and TG–HDL-C ratio are not reliable markers of IR. 23 The plasma TG/HDL-C ratio that identifies patients who are insulin resistant and at significantly greater cardiometabolic risk also varies between men and women. 28 The TG/HDL-C ratio may be a good marker to identify insulin-resistant individuals of Aboriginal, Chinese, and European, but not South Asian origin, 33 suggesting that the application of TG/HDL-C ratios in the diagnosis of IR may need to be evaluated separately in different ethnic groups.
Although both TG and HDL-C are known to be associated with lifestyle habits (i.e., diet, alcohol intake, and exercise), and the inverse relationship between TG and HDL-C has been well established, 34,35 it remains uncertain whether the TG/HDL-C ratio varies as a result of lifestyle. Here, we showed that the TG/HDL-C ratio was lower in subjects who have high physical activity and regular exercise.
Chronic smokers are insulin resistant, hyperinsulinemic, and dyslipidemic when compared with a matched group of nonsmokers. 36 Other studies have indicated that smokers have significantly higher serum concentrations of cholesterol (3.0%), TG (9.1%), VLDL-C (10.4%), and LDL-C (1.7%) and lower serum concentrations of HDL-C (−5.7%) compared with nonsmokers. 37 Several mechanisms including increased free fatty acid have been proposed for these effects. Increased production of fatty acids as a result of IR leads to increased TG and VLDL production, resulting in increased cholesteryl ester transfer protein activity and, thus, enrichment of TG and depletion of cholesteryl ester in HDL. In fact, both men and women who identified as current smokers had higher TG/HDL-C ratios, although the difference in TG/HDL-C ratios in women did not reach statistical significance in this study.
The lowest TG/HDL-C ratio was found in those who reported the greatest amount of alcohol consumption. This is supported by earlier study that showed above moderate alcohol consumption was negatively associated with TG among those in the 70–79 and 80+ age groups, and positively associated with HDL-C levels in all age groups. 38
Based on this study, we propose that anyone with IR should stop smoking as we observed that regardless of regular exercise and physical activity, TG/HDL-C was higher in smokers than in nonsmokers. It is also recommended that all subjects avoid sedentary lifestyles and try to get into the habit of making any body movement that is equivalent to walking for ≥60 min/day as a first step, instead of considering regular exercise, to improve IR. This is because subjects with high physical activity had lower TG/HDL-C ratios than those of subjects who exercise regularly.
The cross-sectional design of this study was its major limitation as it hindered the determination of a causal relationship between the TG/HDL-C ratio and IR, MetS and lifestyle habits. Oral glucose tolerance test data in subjects with FPG above 100 mg/dL to find increased glycemia and diabetes was not available. All the participants in this study were middle-aged and Japanese; thus, we were not able to determine whether the relationship between the TG/HDL-C levels and clinical markers reported here was affected by ethnicity. Finally, our dataset was small; therefore, our findings might not be generalizable to all Japanese individuals.
Conclusions
The results from this study reveal that the TG/HDL-C is associated with components of MetS and IR in healthy Japanese subjects. The results also suggest that the TG/HDL-C is associated with lifestyle habits (regular exercise, physical activity, and smoking). Insulin quantification is not a routine test, and given our data, we propose that routine use of triage tests for the diagnosis of IR is necessary to help identify subjects with metabolic abnormalities. Since both TG and HDL-C are routinely measured, TG/HDL-C might be a useful indicator for both MetS and IR.
Footnotes
Acknowledgment
The author would like to thank the staff at the Health Evaluation and Promotion Center, Tokai University Hachioji Hospital for their help in collecting data.
Author Disclosure Statement
No conflicting financial interests exist.
Funding Information
No funding was received for this article.