
Abstract
Context:
The link between obesity and bone health is controversial. Most studies classify obesity based on body mass index. However, differences in metabolic status may affect bone health.
Purpose:
To explore the potential relationship of metabolic obesity with forearm bone mineral density (BMD) in a northern Chinese population.
Methods:
This is a retrospective study involving a total of 2122 subjects divided into four groups: a metabolically healthy normal-weight (MHNW) group, a metabolically healthy obesity (MHO) group, a metabolically unhealthy, but normal-weight (MUNW) group, and a metabolically unhealthy obesity (MUO) group. Analysis of covariance was performed to compare forearm BMD among the groups. The covariates included age, weight, and height, along with menopause status in women. Partial correlation analysis and multiple linear regression models were used to explore the associations of forearm BMD with clinical parameters.
Results:
Young middle-aged men with MHO had significantly higher forearm BMD than those in the MUO group. In addition, forearm BMD of young middle-aged women was higher in the MHNW group than in the MUNW group. Partial correlation analysis and multiple linear regression analysis suggested that homeostasis model assessment of insulin resistance (HOMA-IR) was negatively correlated with forearm BMD in young middle-aged male subjects with MUO, and waist circumference (WC) and low-density lipoprotein cholesterol (LDL-C) showed a significant negative relationship with forearm BMD in young middle-aged female MUNW subjects.
Conclusions:
Men in the MUO group and women in the MUNW group were more likely to have lower forearm BMD if they were of young middle age. Metabolic obesity could be a better method for defining obesity when exploring the relationship between obesity and bone health in Chinese individuals. WC, LDL-C, and insulin resistance might be negative predictors of bone health.
Introduction
In recent decades, obesity and osteoporosis have emerged as critical public health issues related to increased prevalence rates of both mortality and morbidity, not only in western countries but also in China. 1,2 Various studies have shown a protective role of obesity against osteoporosis. 3,4 However, recent evidence suggests that obesity does not have a protective effect against osteoporosis and that obesity may even be a risk factor for decreased bone density and related fractures. 5 –7
Obesity can reduce life expectancy, largely because obese individuals have a high risk of developing hypertension, diabetes mellitus, cardiovascular disease (CVD), dyslipidemia, and many other diseases. 8 However, not all obese individuals are at an increased risk of mortality.
Individuals in the same body mass index (BMI) category can have substantial heterogeneity of metabolic features, such as lipid profiles, blood pressure (BP), and waist circumference (WC). In this context, there is a subset of healthy obese individuals who can be called metabolically healthy obesity (MHO). 9 In addition, a subgroup of normal-weight individuals with abnormal metabolic parameters, or metabolically unhealthy, but normal-weight (MUNW) individuals, has also been described. 10 Therefore, individuals can be classified into four groups according to body fat on the basis of BMI and metabolic health, including MHO, metabolically unhealthy obesity (MUO), MUNW, and metabolically healthy normal weight (MHNW). 11
The data showed that MHO subjects are at a lower risk of CVD or mortality compared with MUO subjects. 12 A higher risk of cardiometabolic disease, colorectal cancer, and mortality was found in MUNW individuals compared to MHNW subjects. 13 This finding indicates that metabolic obesity may be an indicator that can be used to prevent some chronic disease epidemics. However, these data did not account for osteoporosis. Moreover, increasing evidence shows that metabolic abnormalities and insulin resistance may be related to bone health. 14 –18 The aim of this study was to explore the potential relationship between metabolic obesity and forearm bone mineral density (BMD) in a northern Chinese population.
Subjects and Methods
Subjects
A total of 2846 subjects older than 18 years from the Shun'geng and Huai'yin communities of Jinan City in China were enrolled in an epidemiological investigation from October 2009 to June 2010. Written informed consent and a detailed questionnaire were obtained from all subjects. Fasting blood samples were also provided by all participants.
Subjects with one or more of the following conditions were excluded from our study: insufficient data, diseases affecting BMD (such as chronic renal disease, liver disease, thyroid disease, and endocrine diseases), history of medication use likely to influence BMD (such as thyroid hormones, vitamin D, calcium, glucocorticoid, and bisphosphonates), history of diabetes, abnormal findings in blood tests (such as abnormal thyroid function, calcium, phosphorus, and alkaline phosphate), BMI <18.5, and high alcohol intake (alcohol consumption ≥40 gram per day).
Ultimately, a total of 2122 subjects, 850 men with a mean age of 45.08 ± 15.04 years and 1272 women with a mean age of 45.95 ± 13.67 years, were enrolled in this study. To examine the effects of age, subjects were divided into two groups: the young middle-aged group (<60 years) and the aged group (≥60 years). The study was performed according to the Declaration of Helsinki and was approved by the Ethics Committee of Provincial Hospital affiliated to Shandong University.
Definition of metabolic syndrome and other statuses
Insulin resistance was estimated using the homeostasis model assessment of insulin resistance (HOMA-IR) index, with higher values indicating greater insulin resistance. 19 HOMA-IR was calculated using the following formula: fasting glucose (mM) × fasting insulin (INS) (μIU/mL)/22.5. 20 Metabolic syndrome (MetS) was defined by the American Heart Association/National Heart, Lung, and Blood Institute criteria. 21 Because the risk of disease increases at lower levels of body fatness in Asians, the WC cutoff was adjusted according to the regional criteria proposed by the Western Pacific Regional Office of the World Health Organization and the International Association for the Study of Obesity. 22
Normal-weight participants were defined as those with a BMI <25 kg/m2, and overweight/obese people were defined as those with a BMI ≥25 kg/m2. 23 Subjects were considered to have MetS if they had three or more of the following abnormalities: abdominal obesity (WC ≥90 cm for men and ≥80 cm for women), hypertriglyceridemia ≥1.69 mM, low high-density lipoprotein cholesterol (HDL-C) (<1.03 mM for men and <1.29 mM for women), high BP (≥130/85 mmHg), use of antihypertensive medication, high fasting glucose (≥5.6 mM), and use of antidiabetic medication.
The final definitions of the subtypes of obesity are as follows: MHNW: nonobese subjects (BMI <25 kg/m2) in the first to third quartiles of HOMA-IR and no presence of MetS. MHO: obese subjects (BMI ≥25 kg/m2) in the first to third quartiles of HOMA-IR and no presence of MetS. MUNW: nonobese subjects (BMI <25 kg/m2) with MetS or in the highest quartiles of HOMA-IR. MUO: obese subjects (BMI ≥25 kg/m2) with MetS or in the highest quartiles of HOMA-IR.
Measurements
A trained staff member took the subjects' measurements. Height and weight were measured to the nearest 0.1 cm and 0.1 kg, respectively. BMI was calculated as weight (kg)/height 2 (m2). WC was measured to the nearest 0.1 cm at the narrowest point between the lowest rib and the uppermost lateral border of the right iliac crest. An electronic sphygmomanometer (HEM-7117; Omron) was used to measure BP.
Blood samples were collected from all subjects after a minimum of 10 hr of fasting. The plasma levels of fasting blood glucose (FBG), total cholesterol (TC), HDL-C, low-density lipoprotein cholesterol (LDL-C), and triglycerides (TGs) were measured using enzymatic methods with Olympus reagents and detected by an automatic biochemical analyzer (Olympus AU5400, Japan). The intra-assay and interassay coefficients of variation (CV) were always below 4% for these parameters. INS was assessed by radioimmunoassay. The intra-assay and interassay CV were always below 10% for insulin. All measurements were performed at the clinical laboratory of Provincial Hospital affiliated to Shandong University to minimize interassay variation. The reference range for different parameters was as follows: FBG 3.9–6.1 mM; TC 3.6–6.2 mM; LDL-C 0.5–3.36 mM; HDL-C 0.8–1.5 mM; TGs 0.4–1.8 mM; and INS 4.0–16.0 uIU/mL.
The BMD of the non-dominant distal forearm was measured by peripheral dual-energy X-ray absorptiometry (pDXA, EXA-3000; OsteoSys Co, Ltd., Korea) scan according to a standard protocol. Specially trained technicians carried out and supervised all examinations.
Statistical analysis
Data are presented as the mean ± standard deviation, the median (quartile), or numbers and percentages. Differences in the means of continuous variables with normal distributions were compared using one-way analysis of variance. Differences in the medians of continuous variables with non-normal distributions were compared using nonparametric tests. Differences between proportions in groups were tested using the chi-squared test.
Analysis of covariance was used to compare the forearm BMD levels of the subjects in the four groups after adjusting for covariates. The covariates included age, weight, height, and menopause status (premenopause or postmenopause). Age-, height-, and weight-adjusted partial correlation analyses (additionally adjusted for premenopause and postmenopause in women) were performed between clinical parameters and forearm BMD in obese (BMI ≥25 kg/m2) men and nonobese (BMI <25 kg/m2) women. Multiple regression models were used to test linear trends between forearm BMD and potential influencing factors. Baseline variables that showed a univariate relationship with the outcome were entered into a multiple regression model. Hypertension was analyzed as a dichotomous (yes/no) variable. Because the distributions of HOMA-IR, TGs, and INS were non-normal, data were log transformed before analysis.
All statistical tests were two tailed, and P < 0.05 was considered statistically significant. Statistical analysis was performed using SPSS (version 22.0 for Windows; SPSS, Inc., Chicago, IL).
Results
Baseline characteristics of the subjects
A total of 2122 subjects were enrolled in this study. Among the men, no significant differences were found in age between the MHNW group and the MUNW group (P = 0.212); the same was true for the MHO group and the MUO group (P = 0.072). Weight in the MHNW group was lower than that in the MUNW group (P = 0.048), and weight in the MHO group was lower than that in the MUO group (P < 0.01). No significant differences were found in height among the four groups (P = 0.497). The highest T score was observed in the MHO group, and the lowest T score was observed in the MUNW group. No significant differences were found in T score between the MHNW group and MUNW group (P = 0.368). The T score of the MHO group was higher compared with the MUO group (P < 0.01).
In women, lower age and weight were observed in the MHNW subjects than in the MUNW subjects (P < 0.01, P < 0.01). Higher age and weight were observed in MUO subjects than in MHO subjects (P < 0.01, P < 0.01). No significant differences were found in height between MHNW group and the MUNW group (P = 0.244); the same was true for the MHO group and the MUO group (P = 0.852). The T score of the MHNW group was higher compared with the MUNW group (P < 0.01), and no significant differences were found between the MHO group and the MUO group (P = 0.061). The baseline characteristics of the subjects in the four groups are displayed in Tables 1 and 2.
Baseline Characteristics of Men Among Four Groups
Data are presented as means ± SDs, median (quartile), or as numbers and percentages. Categorical variables were compared by the chi-squared test, continuous variables with normal distributions by one-way ANOVA, and continuous variables with non-normal distributions by nonparametric tests.
P < 0.01, * P < 0.05 versus MHNW; ## P < 0.01, # P < 0.05 versus MHO; ^^P < 0.01, ^P < 0.05 versus MUNW.
ANOVA, analysis of variance; BMI, body mass index; BMD, bone mineral density; DBP, diastolic blood pressure; FBG, fasting blood glucose; HDL-C, high-density lipoprotein cholesterol; HOMA-IR, homeostasis model assessment of insulin resistance; INS, fasting insulin; LDL-C, low-density lipoprotein cholesterol; MetS, metabolic syndrome; MHNW, metabolically healthy normal weight; MHO, metabolically healthy obesity; MUNW, metabolically unhealthy, but normal weight; MUO, metabolically unhealthy obesity; SBP, systolic blood pressure; SD, standard deviation; TC, total cholesterol; TGs, triglycerides; WC, waist circumference.
Baseline Characteristics of Women Among Four Groups
Data are presented means ± SDs, median (quartile), or as numbers and percentages. Categorical variables were compared by the chi-squared test, continuous variables with normal distributions by one-way ANOVA, and continuous variables with non-normal distributions by nonparametric tests.
P < 0.01, * P < 0.05 versus MHNW; ## P < 0.01, # P < 0.05 versus MHO; ^^P < 0.01, ^P < 0.05 versus MUNW.
Variation in forearm BMD among the four groups of subjects
Figure 1 shows the differences in forearm BMD among the four groups. Subjects with MUO were more likely to have a lower forearm BMD than the metabolically healthy participants in both the crude and adjusted models; this was especially true for obese (BMI ≥25 kg/m2) men and nonobese (BMI <25 kg/m2) women.
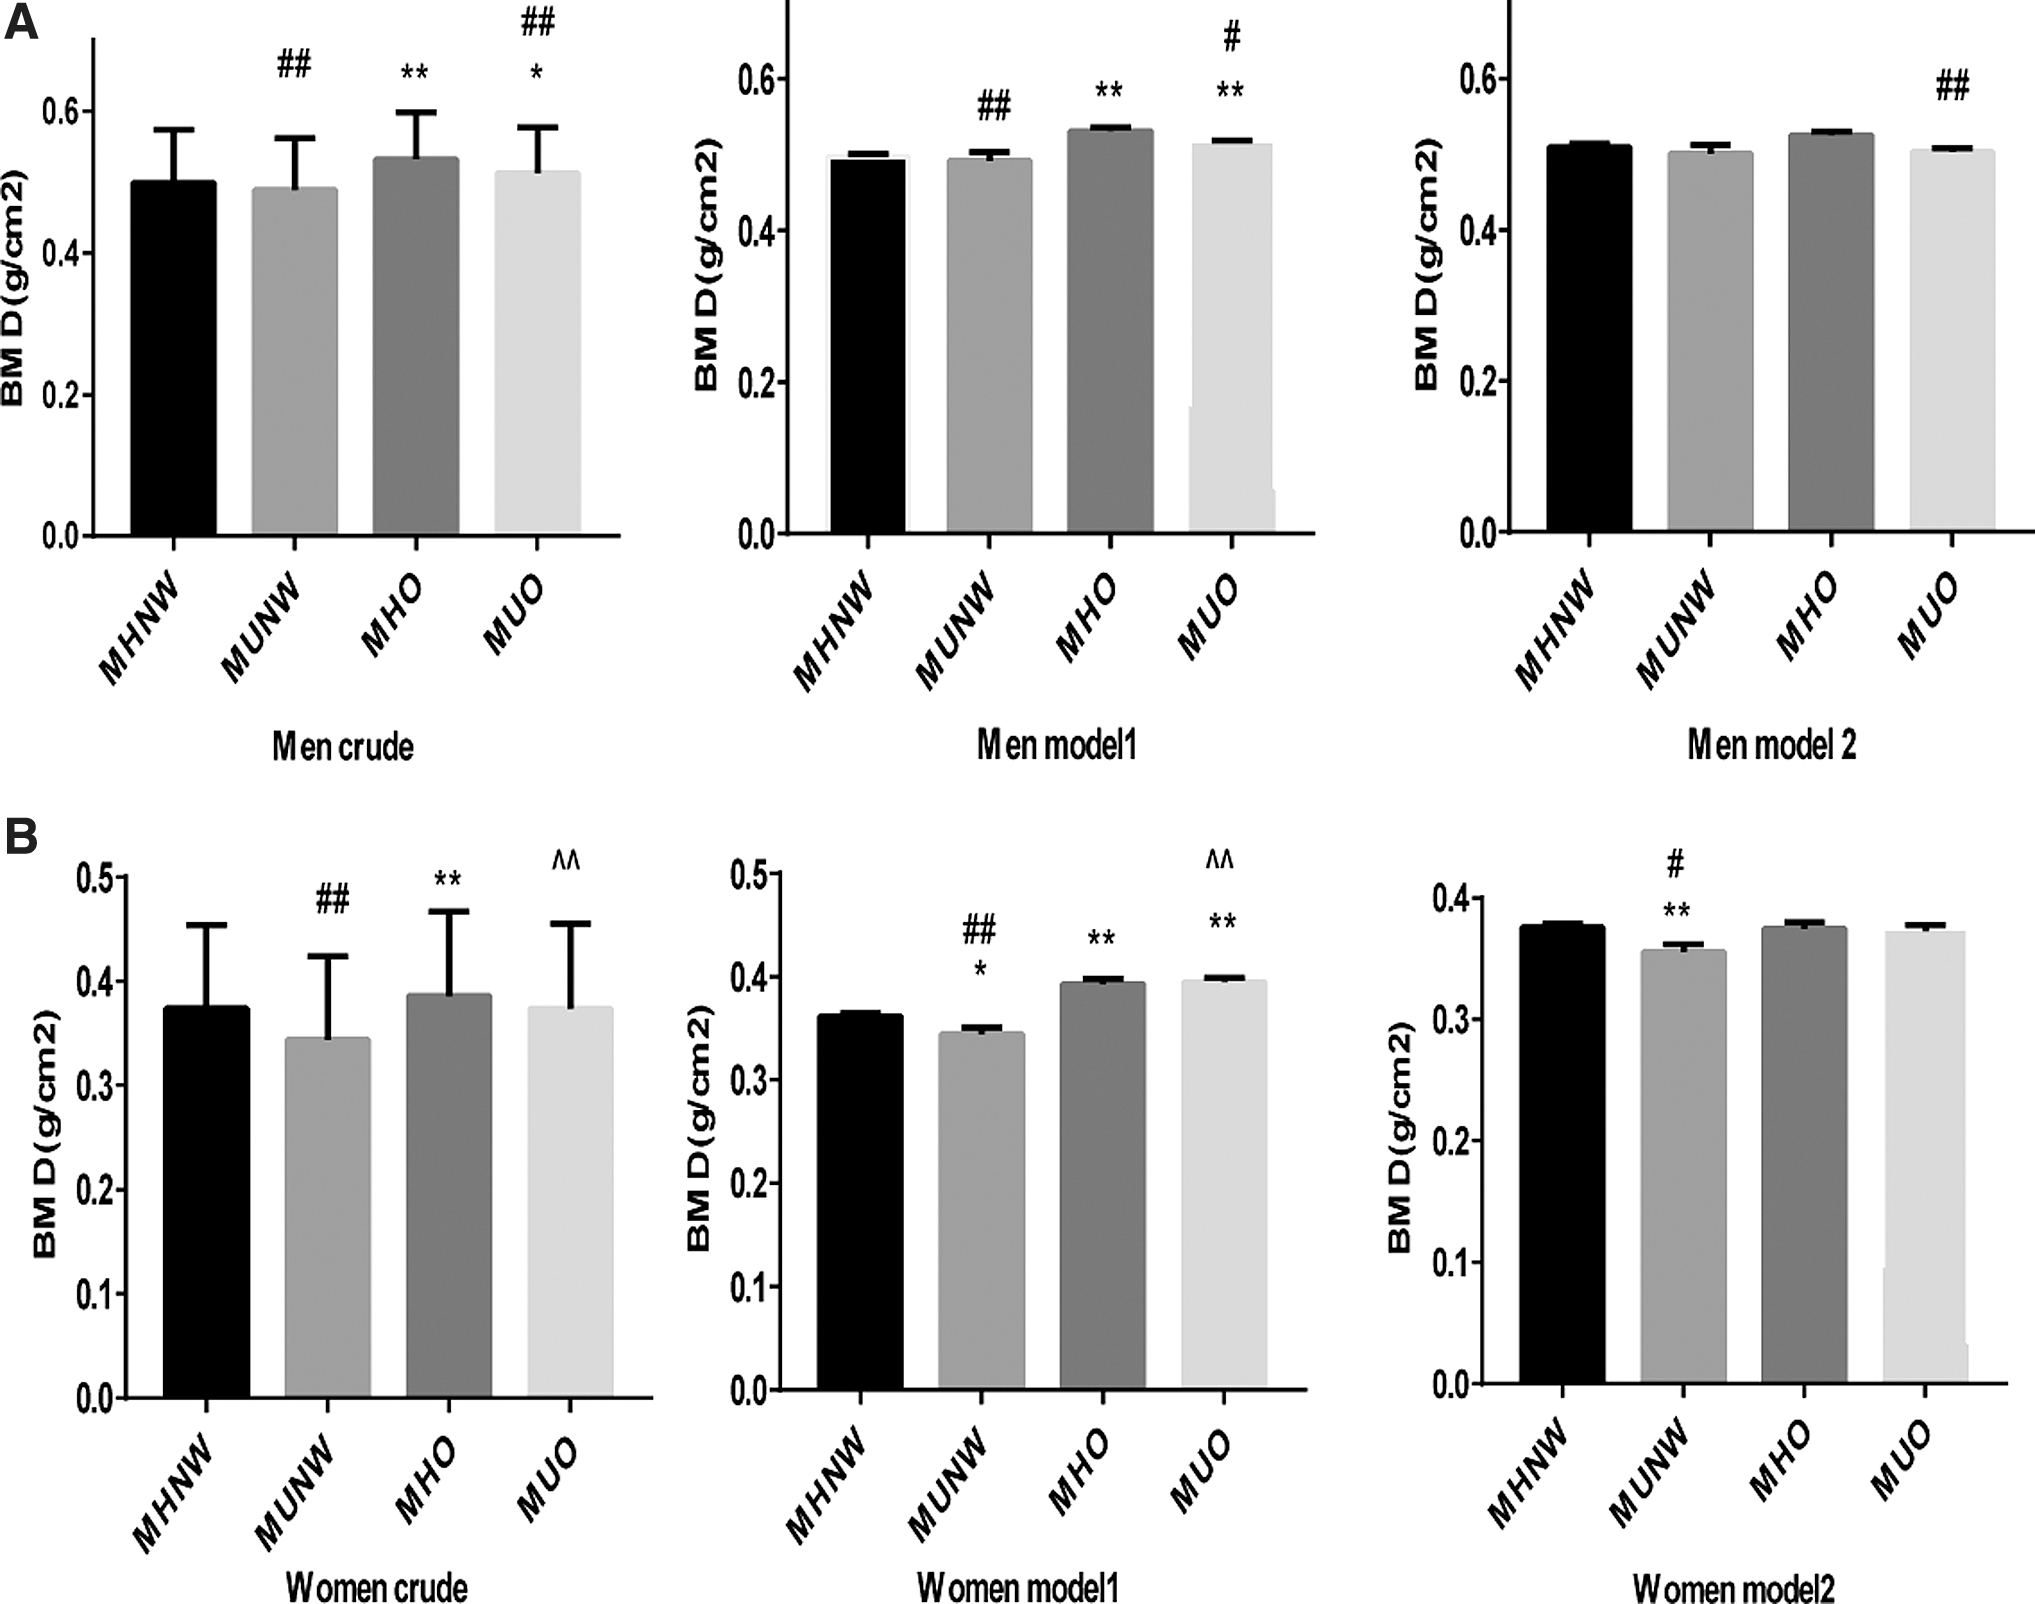
Mean forearm BMD in subjects in four groups.
We divided the subjects into two groups: young middle aged (<60 years) and aged (≥60 years) to ensure that age was not a confounding factor. Figure 2A and C indicate that young middle-aged men with MHO had a higher forearm BMD than subjects with MUO in crude (P = 0.024). In model 1, the difference was significant after adjustment of age and height (P = 0.021). In model 2, the result remained unchanged after adjusting for age, height, and weight (P < 0.01). Young middle-aged women with MHNW had higher forearm BMD than subjects with MUNW in the crude model, model 1, and model 2 (P = 0.03, P = 0.042, and P = 0.025). Figure 2B and D show no difference in BMD between aged subjects with MHNW and MUNW in both the crude and adjusted models (men P = 0.482, 0.493, and 0.449 and women P = 0.868, 0.925, and 0.653); same was true for the MHO group and the MUO group (men P = 0.168, 0.19, and 0.159 and women P = 0.117, 0.142, and0.271).
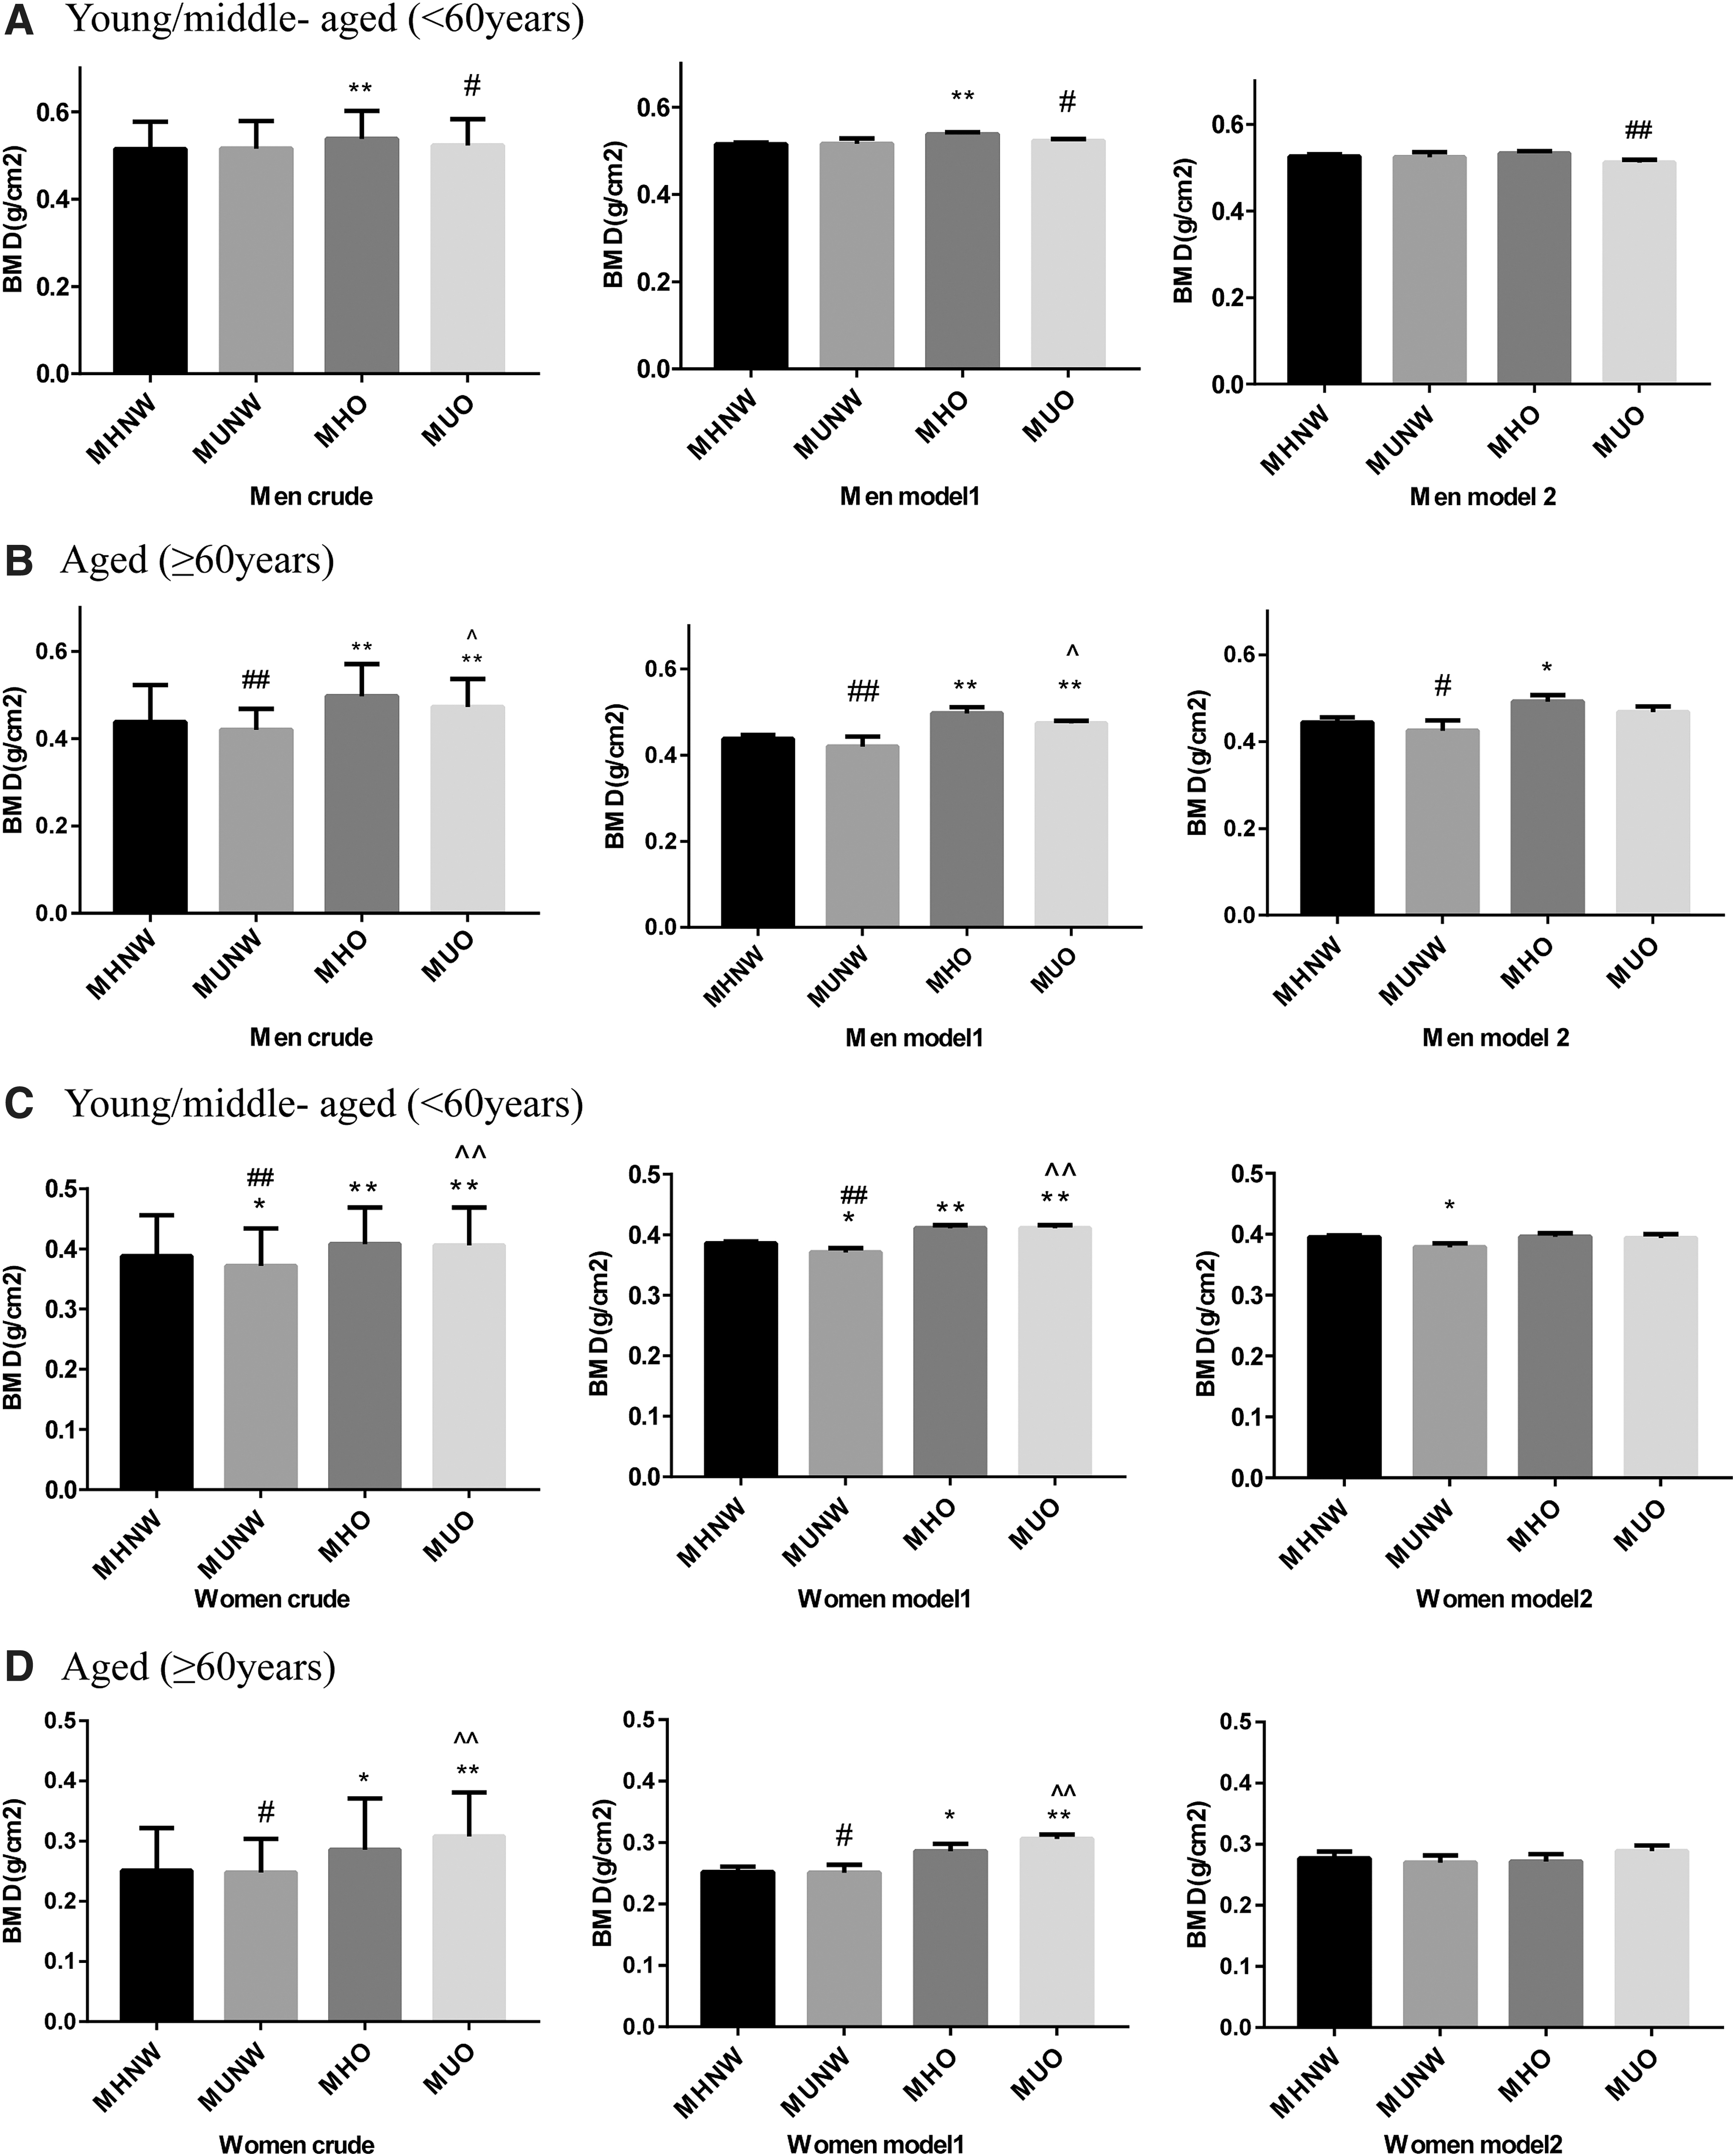
Mean forearm BMD in subjects among four groups of different ages.
Partial correlation analysis and multiple linear regression
Age-, height-, and weight-adjusted partial correlation analyses showed that WC, LDL-C, INS, and HOMA-IR were negatively correlated with forearm BMD in young middle-aged obese men, and additional premenopause- and postmenopause-adjusted partial correlation analyses indicated that WC, TC, LDL-C, INS, and HOMA-IR were negatively correlated with forearm BMD in young middle-aged nonobese women (Table 3).
Partial Correlations Between MetS Components, TC, INS, HOMA-IR, and Forearm BMD in Young/Middle-Aged Obese Men and Young/Middle-Aged Nonobese Women
Obese men: BMI ≥25 kg/m2, age, height, andweight adjusted. Nonobese women: BMI <25 kg/m2, age, height, weight, and premenopause and postmenopause adjusted
A log transformation was applied before analysis for TG, HOMA-IR. Statistical significance (P < 0.05).
BP, blood pressure.
Multiple regression analyses were performed to explore the association between potential influencing factors and forearm BMD after adjusting for confounding variables (age, height, weight, and premenopause and postmenopause). As shown in Table 4, HOMA-IR showed significant negative relationships with forearm BMD in young middle-aged obese men. WC and LDL-C showed a significant negative relationship with forearm BMD in young middle-aged nonobese women.
Multiple Linear Regression Between Forearm BMD and Clinical Parameters in Young/Middle-Aged Participants
A log transformation was applied before analysis for HOMA-IR. Statistical significance (P < 0.05)
Obese men: BMI ≥25 kg/m2 (n = 384), age, height, and weight adjusted. Nonobese women: BMI <25 kg/m2 (n = 676), age, height, weight, and premenopause and postmenopause adjusted.
Discussion
Although the relationship between obesity and bone health has been widely studied, the results are inconsistent. A unique feature of this study provides the new insight into the relationship between forearm BMD and obesity in terms of metabolic status. We found that in the northern Chinese population, men with MHO had higher forearm BMD than subjects with MUO and that women with MHNW had higher forearm BMD than subjects with MUNW.
According to the WHO diagnostic classification, definitions of osteoporosis are based on BMD measurements. The hip and lumbar spine are usually regarded as the most important measurement sites because they are frequent sites of fractures that cause substantial impairment of quality of life and increased morbidity and mortality. 24 Hip BMD measurement has been shown to be the most reliable way to evaluate the risk of hip fracture. 25 In addition, because of the metabolically active trabecular bone in the vertebral bodies, the spine is regarded as the optimum site for monitoring response to treatment. 26 Densitometric examination of the total hip and the femoral neck alone can be carried out at the level of the lumbar spine (L1–L4).
However, the accuracy of densitometric results may be reduced by the possible presence of interfering factors. For example, a fractured vertebra or one with postarthritic focal accumulation must be excluded from the densitometric analysis, and at least two adjacent lumbar vertebrae must be evaluated. For this reason, lumbar densitometry is often inaccurate for older people due to interference of osteoarthritis signs, extraskeletal calcifications, or vertebral fractures; therefore, in older patients, it is preferable to perform femoral densitometry. Peripheral measurements of the forearm are reserved for special circumstances, particularly for patients in whom lumbar or femoral evaluation is not possible or not accurate, and those who are severely obese or suffer from primary hyperparathyroidism. 27 This is an epidemiological study that enrolled large groups of people, including obese subjects. Due to financial, place, and time constraints, we are unlikely to measure BMD at all sites. Therefore, forearm BMD by peripheral dual energy X-ray absorptiometry (pDXA) was used in our study to screen out the high-risk groups with osteoporosis for further intervention.
In our study, subjects with metabolic obesity were more likely to have lower forearm BMD than metabolically healthy participants. The results of previous studies on the link between obesity and bone health are controversial. Albala et al. confirmed higher BMD at the femoral and lumbar spine sites and a decreased risk of osteopenia in Caucasian obese women. 3 However, Compston et al. reported an increased risk of ankle and upper leg fractures in obese women, 5 and Nielson et al. suggested that the hazard ratio for non-spine fracture in individuals with overweight and obesity was higher than that for individuals with normal weight. 6 One potential problem with these studies is that the correlation between obesity and bone health was only based on BMI.
Numerous studies have suggested that obesity defined according to BMI, in which metabolic status is not considered, is not created equally. Data have shown that the risk of some chronic diseases among metabolically healthy individuals was lower than that among subjects with metabolic obesity. MHO subjects were not at elevated risk of CVD or all-cause mortality compared with metabolically healthy nonobese subjects, and they have a lower risk of CVD and mortality than MUO individuals. 12 MUNW individuals have an elevated risk of colorectal cancer, all-cause mortality, and cardiovascular events compared to MHNW individuals. 13 Compared to MHNW individuals, MUNW and MUO individuals have an increased risk of developing diabetes and CVD. 28
The relationship between metabolic obesity and bone health is weaker, although metabolic obesity has been widely investigated. Increasing evidence has confirmed that metabolic abnormalities are related to bone health. Kim et al. reported that MetS was associated with a lower BMD in Korean men and postmenopausal women. 14 Subjects with dyslipidemia have lower lumbar and femoral BMD and an increased risk of osteopenia compared to individuals with a normal lipid profile. 29 Bone turnover could be suppressed in individuals with insulin resistance. 15 In this study, we investigated the relationship between metabolic obesity and bone health and found differences in forearm BMD between metabolically healthy and unhealthy groups. Thus, this approach would be of particular use when analyzing the relationship between obesity and bone health.
To date, a small amount of research has investigated the association between metabolic obesity and bone heath. Our results were inconsistent with the report of Mirzababaei et al., which found that MUO was positively associated with total BMD more than MHO was, while there was no association with lumbar measurement site 30 ; the different BMI cutoffs used to define obesity; different criteria used to diagnose MetS; specific study populations; specific sex, age, and genetic backgrounds; different sample sizes, and so on. Therefore, further large multicenter longitudinal studies with more advanced designs need to be performed to verify our conclusions.
In this study, HOMA-IR showed significant negative relationships with forearm BMD in young middle-aged obese men. Previous studies have revealed some possible mechanisms similar to those that occur in skeletal muscle and hepatic and adipose tissue, in which insulin resistance can develop in bone tissue, and impaired insulin signaling may have direct effects on bone metabolism and may be associated with decreased bone remodeling. 16 It has been shown that the disruption of osteoblast-specific insulin receptors leads to impaired osteoblast differentiation and reduced trabecular bone formation. 31 In the insulin resistance state, more free fatty acids are liberated into plasma, which promotes insulin receptor ubiquitination and subsequent degradation, and bone turnover markers can be suppressed. 15,16 Moreover, many cytokines derived from adipose tissue, such as proinflammatory cytokines, will increase in the context of insulin resistance, 32 which may promote bone resorption. 33 –35
In this study, WC showed a negative relationship with forearm BMD in nonobese women. Consistent with our study, Kim et al. reported that WC was negatively related to decreased BMD in Korean subjects. 14 WC could reflect abdominal obesity, and abdominal obesity is associated with osteopenia and osteoporosis. 36 Inflammatory cytokines derived from abdominal fat can mediate the detrimental effects on bone mass and consequently cause increased bone loss. 37
In this study, LDL-C showed negative relationships with forearm BMD in nonobese women. Data from Orozco and Yamaguchi were consistent with ours, and they found that subjects with low LDL-C had lower BMD and an increased risk of osteopenia compared with those with normal lipid profiles. 17,29 In our study, no associations were found between HDL-C, TGs, and BMD. Regarding the relationship between HDL-C and BMD, both negative and positive correlations have been reported. 17,18 Higher TGs were associated with the presence of vertebral fractures in postmenopausal women. 17 The reason for the different results for the relationship between lipid profiles and BMD in these studies is not clear; the difference may be associated with sex, age, race, genetic diversity, or site specificity, and more studies are needed to elucidate the cause.
In summary, this study provides new insight into the relationship between metabolic obesity and forearm BMD in the northern Chinese population. Different subtypes of obesity, considering metabolic status, were used to assess obesity and bone health more accurately. The results provide a theoretical basis for the development of personalized prevention and control for subjects with osteoporosis. Our study had some limitations. First, we could not determine exact cause and effect relationships because of the cross-sectional nature of our study. Second, because the study was retrospective, BMD was assessed only at the forearm, and the relationship of metabolic obesity with BMD might differ at other sites (such as the femoral BMD and lumbar spine BMD). Third, this study did not consider some lifestyle factors (such as exercise). The average duration of daily exercise needs to be adjusted for.
In conclusion, our study found that MUO men and metabolically unhealthy nonobese women of young middle age were more likely to have lower forearm BMD. Moreover, the results indicate that WC, LDL-C, and insulin resistance may be negative predictors of bone health. Thus, stratification of obese individuals based on their metabolic status may be important to identify those who should be prioritized for early pharmacological treatment and lifestyle intervention.
Footnotes
Authors' Contributions
All authors contributed to the study conception and design. Material preparation and data collection were performed by C.Y., S.S., M.Z., H.Z, X.Z., and Q.G. Analysis and interpretation of the data and drafting of the article were by Y.W. Statistical analysis was by F.C. and H.W. Article revision was by J.X., and all authors approved the final article.
Author Disclosure Statement
No conflicting financial interests exist.
Funding Information
This work was funded by Shandong Provincial Key Research Project (grant no. 2016GSF201025 and 2016GGH3118), the National Science Foundation of China (grant no. 81370892), the Taishan Scholars Special Foundation of Shandong Province, and the Academic Promotion Programme of Shandong First Medical University (grant no. 2019QL017), and the Science and Technology Development Plan Project of Tai'an (grant no. 2019NS231).