
Abstract
Background:
To compare the strengths of the associations between total and region-specific body composition and insulin resistance (IR) considering sex and menopausal status and to compare body composition indicators for discriminating high IR.
Materials and Methods:
Among 5380 men, 3652 premenopausal women, and 3207 postmenopausal women in the Korean National Health and Nutrition Examination Survey, high IR was defined as the sex-specific highest quintiles of homeostasis model assessment IR and metabolic syndrome. Percentages of bone mineral content (BMC%), muscle mass (MM%), and fat mass (FM%) were measured for the whole body, trunk, and upper/lower extremities by dual-energy X-ray absorptiometry.
Results:
After adjusting for body mass, age, education, smoking status, alcohol use, and physical activity, one-standard deviation increases in whole-body FM%, MM%, and BMC% were associated with 50%–63%, 19%–26%, and 14%–22% higher odds of high IR in men and pre- and postmenopausal women, 31%–36%, 12%–17%, and 10%–15% lower odds, and 27%–36%, 31%–40%, and 19%–23% lower odds, respectively. Those associations for FM% in men and BMC% in premenopausal women tended to be stronger in the upper body than in lower extremities. In receiver operating characteristic curve analysis, FM% in men and BMC% in women had superior discriminatory abilities for high IR.
Conclusions:
IR may have a stronger association with FM% in men and BMC% in premenopausal women in upper body, while the association strength in postmenopausal women may be similar across body composition. These findings reveal differences in the strengths of region-, sex, and menopausal status-specific relationships between body composition and IR.
Introduction
Insulin resistance (IR), frequently assessed using homeostasis model assessment-insulin resistance (HOMA-IR) in population-based studies, is an underlying pathophysiology of metabolic syndrome (MetS) and a metabolic disturbance associated with obesity and type 2 diabetes mellitus. 1 Indicators of body composition such as body fat distribution, 2 body fat mass (FM%), 3 ratio of muscle mass (MM%) to body mass, 4 MM%, 5 ratio of MM% to FM%, 6 and bone mineral density 7 have been associated with IR.
Studies suggest that higher upper body fat distribution, 2 both excess and lack of adipose tissue, 3 relatively low MM%, 4 sarcopenia, 5 and high FM% regardless of MM% 6 are associated with increased IR. However, the relationships between bone and IR remain controversial. A meta-analysis of the association between MetS and osteoporosis suggested MetS as a risk factor for developing osteoporosis in men but not in women. 8 In contrast, another meta-analysis found that MetS had no clear influence on bone mineral density. 9 In addition, a meta-analysis of osteocalcin, an indicator of bone resorption and formation, reported inverse associations between serum total osteocalcin levels and the risk of adverse metabolic outcomes. 10 Therefore, the evidence suggests that lower MM% and higher body FM% may be associated with increased IR, while there may be bidirectional, positive, or negative associations between bone mass and IR. However, evidence of the differences in the strengths of the anatomic region- and sex-specific relationships between bone mass, MM%, and FM% and IR is lacking. Research on these differences in the associations between body composition and IR may be necessary to develop effective strategies for patients with IR.
Therefore, this study compared the strengths of the associations between total and region-specific body composition indicators, including percentages of bone mineral content (BMC%), MM%, and FM% and IR assessed using HOMA-IR and MetS according to sex and menopausal status in women, and compared the ability of the body composition indicators to discriminate high IR in a representative population-based sample from the Korean National Health and Nutrition Examination Survey (KNHANES).
Materials and Methods
Study participants
The participants were a representative sample of the civilian, noninstitutionalized Korean population included in the KNHANES conducted in 2008–2011. The KNHANES conducted by the Korea Centers for Disease Control and Prevention is a national surveillance system assessing the health and nutritional status of Koreans. This nationally representative cross-sectional survey includes ∼10,000 individuals each year as a survey sample and collects information on socioeconomic status, health-related behaviors, quality of life, health care utilization, anthropometric measures, biochemical and clinical profiles for noncommunicable diseases, and dietary intakes. The survey used a multistage, stratified, systematic sampling method and a rolling survey sampling of household units. 11,12 The current study included 12,239 Korean adults who participated in the KHNANES (5380 men, 3652 premenopausal women, and 3207 postmenopausal women), aged 19–80 years, who provided data required for body composition measures, IR indicators, educational level, and health-related behaviors (Fig. 1). All participants provided signed informed consent, and the study protocol was approved by the Institutional Review Board (IRB) of Korea Centers for Disease Control and Prevention (IRB approval nos. 2008-04EXP-01-C, 2009-01CON-03-2C, 2010-02CON-21-C, and 2011-02CON-06-C). 11
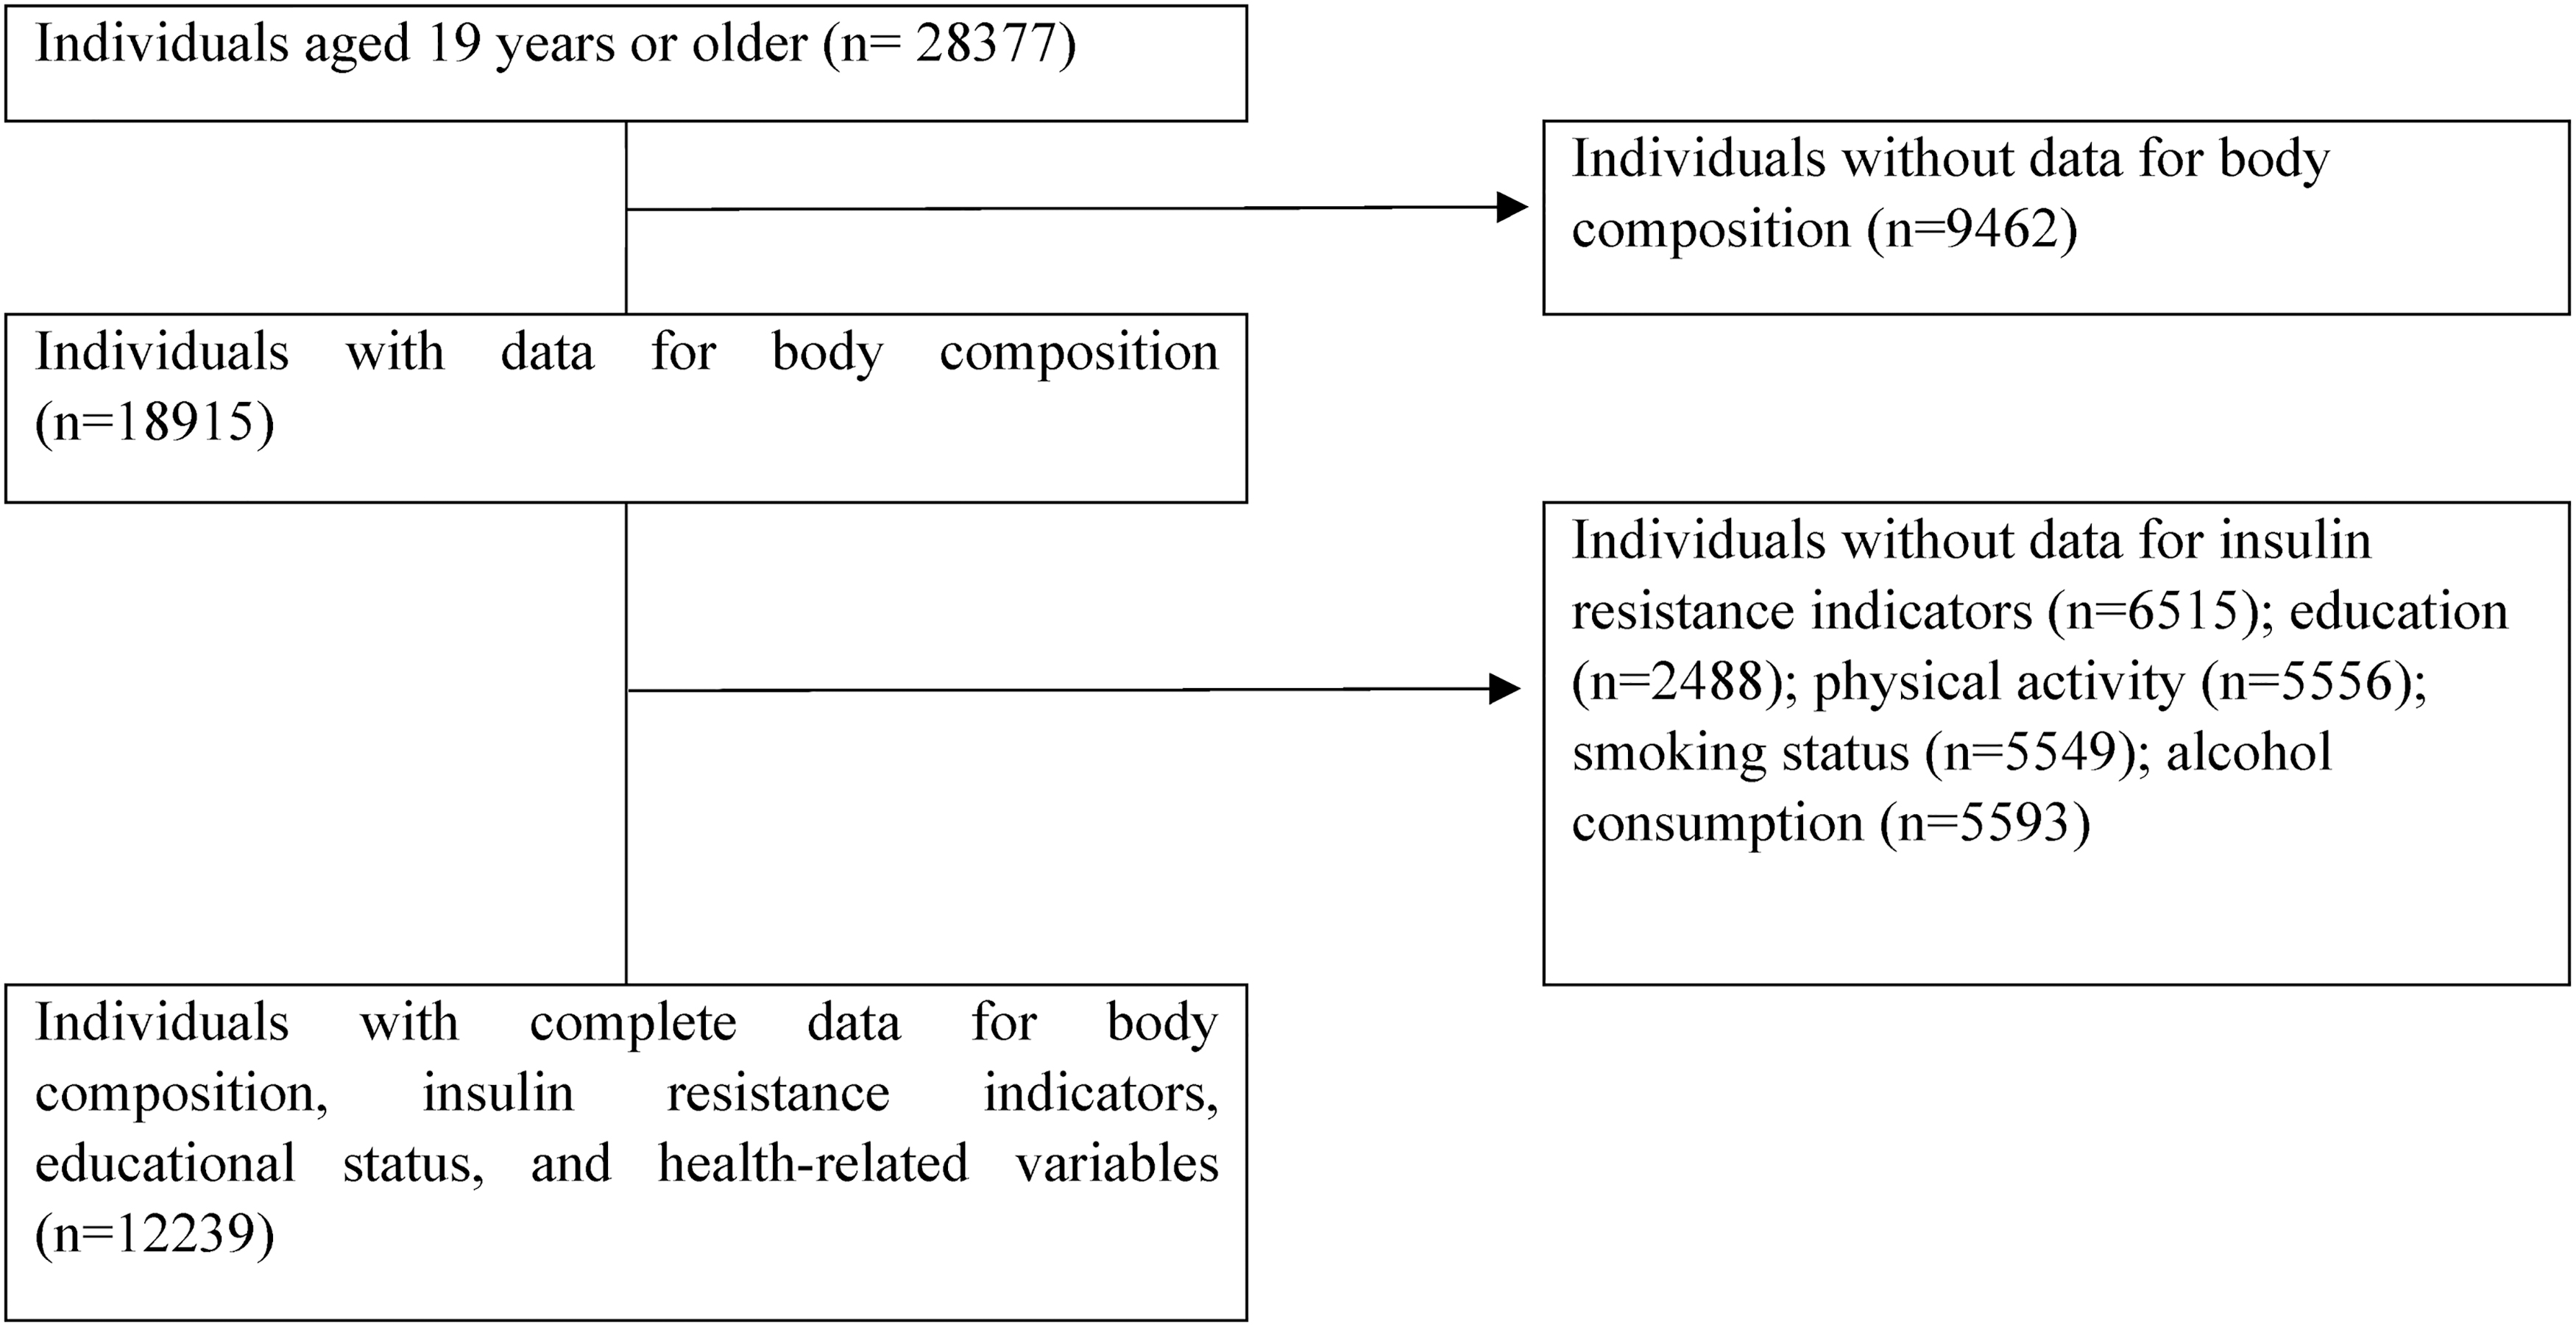
Inclusion of participants of the current study.
Measurements of body composition
Whole-body dual-energy X-ray absorptiometry (Discovery QDR4500W; Hologic, Inc., Bedford, MA) was used to measure body mass, FM, fat-free mass, and BMC in the whole body, trunk, and the four extremities. The BMC in the trunk was calculated as the sum of the BMC at ribs of both sides, thoracic and lumbar spines, and pelvic bone. The BMC of the upper and lower extremities was calculated as the sums of the BMC of both sides of the upper and lower extremities, respectively. MM was calculated as the fat-free mass minus BMC in the whole body and each anatomic region. BMC%, MM%, and FM% in the whole body and each region were calculated as the individual body composition × 100/body mass for the whole body and each region, respectively. For example, BMC% of the upper extremities was calculated as the BMC × 100/body mass of the upper extremities.
Measurements of IR indicators
HOMA-IR and MetS were used as IR-related indicators. Waist circumference was measured to the nearest 0.1 cm at the end of normal expiration at the midpoint between the lowest rib and the iliac crest. Blood pressure (BP) was measured thrice using a standard manual sphygmomanometer with the participants seated. The average of the second and third BP values was used for the analyses. Antecubital venous blood samples were taken from each subject after a 12-hr overnight fast. An automatic analyzer (Automatic Chemistry Analyzer 7600; Hitachi, Tokyo, Japan) was used to measure insulin levels using an immunoradiometric assay, while high-density lipoprotein cholesterol (HDL-C) and triglyceride (TG) levels were measured using an enzyme method and glucose levels were measured by enzymatic colorimetric method. HOMA-IR was calculated using the following formula: fasting plasma glucose (mM) × fasting insulin [(mU/mL)/22.5]. 13 The high HOMA-IR for each sex was defined by the highest quintiles. The cutoff value of high HOMA-IR was 2.89 for men and 2.77 for women.
MetS is generally defined as (1) satisfying at least three of the following components 14 or (2) satisfying at least two components except for high waist circumference. The second definition of MetS was considered in the present study because waist circumference was included in the body composition measurements. The MetS components were waist circumference ≥90 cm (for men) or 85 cm (for women) 15 ; BP ≥130/85 mmHg or a history of hypertension; fasting plasma glucose levels ≥5.6 mM or a history of diabetes mellitus; HDL-C levels <1.03 mM for men or 1.29 mM for women; and TG levels ≥1.7 mM. 14 An individual was defined as having a history of hypertension or diabetes mellitus based on having been diagnosed by a physician or currently being treated for those illnesses using a standardized questionnaire. 11
Self-reported questionnaires were also used to assess educational attainment, current smoking status (smoker vs. nonsmoker), physical activity (yes vs. no for engaging in high-intensity activity for >75 min/week or moderate-intensity activity for >150 min/week), alcohol use (yes vs. no for frequency of alcohol consumption ≥1 month in the past year), and menopausal status (yes vs. no for women).
Statistical analysis
Body mass for the whole body and for each region, percentages of individual body composition indicator for the whole body and for each region, IR-related indicators, sociodemographic characteristics, and health behaviors were compared among men, premenopausal women, and postmenopausal women using chi-squared tests with Bonferroni correction for pairwise comparison of categorical variables or analysis of variance with post hoc analysis using least significant difference test for pairwise comparison of continuous variables. Considering sex and menopausal status differences in the associations between IR-related indicators and bone mineral density, 8 the sex- and menopausal status-specific (in women) associations between the percentages of body composition indicators and IR were analyzed using logistic regression analysis after adjusting for body mass (whole body or each region), age, education level, smoking status, physical activity, and alcohol use. Separation of body mass into percentages of individual component and total body composition was used to assess the effect of differences in individual body composition on IR while the total body mass was kept constant. 16 The odds ratios (95% confidence intervals) per one standard deviation (SD) change in individual body composition were computed to compare the association magnitude of 1-SD differences in individual body composition on high IR. Sex- and menopausal status-specific (in women) receiver operating characteristic (ROC) curve analysis was performed for pairwise comparisons of the area under the ROC curves (AUCs) to assess the discriminating ability of each body composition indicator for high IR by DeLong tests. Data were analyzed using an IBM SPSS Statistics for Windows, version 25.0 (IBM Corp., Armonk, NY) and MedCalc software, version 12.0.0 (MedCalc, Ostend, Belgium).
Results
Table 1 presents comparison of body composition, IR-related indicators, sociodemographic factors, and health behaviors among men and pre- and postmenopausal women. BMC% and MM% were highest, while FM% was lowest in men, and followed by premenopausal women and postmenopausal women in the whole body, upper extremities, and trunk. High IR was most prevailing in postmenopausal women and followed by men and premenopausal women. Educational attainment less than graduation of high school, current smoking, alcohol use, and regular physical activity were highest in men and followed by premenopausal women (Table 1).
Comparison of Body Mass Composition, Insulin Resistance-Related Factors, Sociodemographic Factors, and Health Behaviors Between Men and Women (n = 12,239)
Values represent mean ± SD or n (%).
P < 0.05 using chi-squared test with Bonferroni correction or analysis of variance with post hoc analysis using LSD method.
Comparison between men and premenopausal women.
Comparison between men and postmenopausal women.
Comparison between premenopausal women and postmenopausal women.
MetS components except for abdominal obesity.
BMC%, bone mineral content; FM%, fat mass; HOMA-IR, homeostasis model assessment-insulin resistance; LSD, least significant difference; MetS, metabolic syndrome; MM%, muscle mass; SD, standard deviation.
Table 2 shows the associations between individual body composition and high IR when body mass was kept constant and other confounding factors were adjusted for the whole body and each region in men. High IR was inversely associated with BMC% and MM%, while it was positively associated with FM% in all regions. The strengths of the associations were greater for the relationships with FM% than those for the other body composition indicators. For example, a 1-SD increase in the whole-body FM%, MM%, and BMC% was, respectively, associated with 50%–63% higher odds, 31%–36% lower odds, and 27%–36% lower odds for high IR after adjusting for body mass, age, education level, and health-related behaviors. The strengths of the associations of FM% tended to be stronger in the upper extremities, followed by the trunk and lower extremities.
The Associations Between Body Mass Composition and High Insulin Resistance in Korean Men (n = 5380)
Values represent odds ratio (95% confidence intervals) per 1-SD difference in each body composition using logistic regression analysis after adjusting for body mass (whole body or each region), age, education level, smoking status, physical activity, and alcohol use.
Number of MetS components excluding abdominal obesity.
Table 3 shows the menopausal status-specific associations between individual body composition and high IR in women. In premenopausal women, the strengths of the associations in the whole body were greater for the relationships with BMC% than those for other body composition indicators. In the adjusted models, a 1-SD increase in the whole-body BMC%, MM%, and FM% was associated with 31%–40% lower odds, 12%–17% lower odds, and 19%–26% higher odds for high IR, respectively. Those associations with the lower extremities of BMC% tended to be weaker compared to those in the upper body, while those with the truncal FM% tended to be stronger compared to those in the extremities.
The Associations Between Body Mass Composition and High Insulin Resistance in Korean Women (n = 6859)
Values represent odds ratio (95% confidence intervals) per 1-SD difference in each body composition using logistic regression analysis after adjusting for body mass (whole body or each region), age, education level, smoking status, physical activity, and alcohol use.
Number of MetS components excluding abdominal obesity.
In postmenopausal women, the strengths of the associations between body composition indicators and high IR were similar. In the adjusted models, a 1-SD increase in the whole-body BMC%, MM%, and FM% was associated with 19%–23% lower odds, 10%–15% lower odds, and 14%–22% higher odds for high IR, respectively. In both pre- and postmenopausal women, high IR was positively associated with MM%, while it was negatively associated with FM% (Table 3).
AUC comparisons in the whole body showed that FM% in men and BMC% in premenopausal women tended to have a superior discriminating ability for high IR compared to those of the other body composition measures. The truncal FM% had the greatest AUCs for discriminating high IR regardless of sex and menopausal status in women (Table 4).
Comparison of AUC for Discriminating Ability of Body Composition Regarding High Insulin Resistance
AUC, area under the ROC curve.
Values represent AUC ± standard error.
P < 0.05 for pairwise comparison of ROC curves.
Number of MetS components excluding abdominal obesity.
Between BMC% and MM%.
Between BMC% and FM%.
Between MM% and FM%.
ROC, receiver operating characteristic.
Discussion
In this representative sampling of Korean men and women, IR assessed using HOMA-IR and MetS was inversely associated with BMC% and MM% and positively associated with FM% in the whole body and upper body (upper extremities and trunk) after adjusting for body mass, age, education, smoking, alcohol use, and physical activity. The associations in the whole body tended to be stronger for FM% in men and BMC% in premenopausal women, while the strengths of associations were similar across body composition measures in postmenopausal women. Similar findings were observed in the comparison of AUC values.
With respect to region-specific body composition, there were sex-nonspecific findings and sex-specific differences in the strengths of the associations. The association strength with truncal FM% in men was similar to that in premenopausal women. In contrast, with respect to the associations with body composition measures in lower extremities, the association strength in men tended to decrease with consistent direction and significance of the associations, while in pre- and postmenopausal women, high IR had a positive association with MM% and a negative association with FM%.
Similar to the findings of the current study, the associations of MM% and FM% with IR have been demonstrated in population-based studies. An increased skeletal muscle to total body mass ratio was associated with decreased HOMA-IR in the National Health and Nutrition Examination Survey. 4 In studies using KNHANES data, high FM%, regardless of MM%, was associated with MetS, 6 and a combined phenotype of low MM% and high FM% was associated with higher estimated 10-year cardiovascular disease risk in men. 17 In addition, a meta-analysis reported an association between low skeletal MM% and higher HOMA-IR and levels of cardiometabolic components. 18
With respect to the associations of high FM% and low MM% with high IR, dysfunctional adipocytes that are highly lipolytic and resulting in increased free fatty acid release and present impaired secretion of adipokines (increased leptin and resistin, decreased adiponectin, etc.) may play a key role. The increased free fatty acid level may induce IR through elevated delivery to the liver (consequently develop hepatic IR) and/or spillover to nonadipose tissues such as liver, muscle, pancreas, and bone (consequently induce IR by ectopic free fatty acid and/or its metabolic active derivative accumulation, lipotoxicity, and apoptosis). In addition, hypertrophic adipocytes may lead to local hypoxia driving endoplasmic reticulum stress, adipocyte death, and macrophage infiltration, which may increase inflammatory cytokines, such as tumor necrosis factor-α, interleukin-6, and monocyte chemoattractant protein-1, and consequently impair insulin signaling. 19
The previous and current findings indicated inverse associations of BMC% and MM% with IR while a positive association between FM% and IR. Moreover, the present findings may extend previous knowledge by presenting region-, sex, and menopausal status-specific differences in the associations between body composition and IR. Based on the superiority of truncal FM% in men and BMC% in the upper extremities in premenopausal women for the association with high IR, sex and menopausal status-specific strategies for managing these body composition indicators may be beneficial for IR treatment and prevention.
The current findings of stronger associations between FM% and IR in the upper body were similar to those on previous studies reporting different relationships between regional fat deposits and cardiometabolic factors. 2,3 The divergent functional properties of adipose tissue in upper vs. lower body explain the higher risk of obesity-related co-morbidities in individuals with upper-body obesity compared to that in those with lower-body obesity. 3 Compared to upper-body fat deposits, lower-body fat deposits can recruit additional adipocytes, have reduced lipid turnover, and have low signs of inflammatory insult. 2 Sex steroid hormones determining sexual dimorphism in fat distribution may contribute to the sexual disparity in the associations between FM% in the lower extremities and IR. 20 Sexual disparities may exist in the ectopic fat deposition in the organs involved in metabolic disturbance such as skeletal muscle, visceral adipose tissue, and liver, as well as the structural and functional properties of subcutaneous fat layers. 3,21 Those mechanisms may at least, in part, explain the stronger associations in men but not in women.
Despite growing evidence of the association between bone and IR, the findings are inconsistent, as shown in two meta-analyses. 8,9 The present findings of the inverse associations between BMC% and IR may be consistent with those of a meta-analysis indicating an inverse association between MetS and bone mineral density 8 and a previous study suggesting an inverse association between BMC% and HOMA-IR in male adolescents aged 13–19 years. 22 These findings may be explained by the effects of IR on bone, bone-derived effects on IR, or a coordinate endocrine system regulating bone and IR. The detrimental effects of supraphysiological levels of insulin on bone have been reported through reduced bone turnover, 23 increased fragility of bone through higher cortical bone porosity, adipokine effects related to IR, 24 and low-grade inflammation. 8 However, evidence for the extraskeletal function of bone suggests that bone-derived factors such as osteocalcin may regulate IR and energy metabolism through effects on pancreatic β cells and adipose tissue. 25 Adipocyte-derived hormones such as leptin and adiponectin and gut-derived hormone such as glucagon-like peptides 1 and 2 have been shown to regulate both bone remodeling and energy homeostasis. 25 Sex-based differences in the complex mechanisms regulating the associations among bone, adipose tissue, and IR may mediate the sex-based discrepancy in the strengths of the associations between body composition and IR.
This study had several limitations. The causality between body composition and IR remains to be determined. In addition, the interactive effects among body composition with respect to the relationship with IR were not investigated. Potential confounding factors such as medications and dietary habits related to body composition and/or IR were not fully adjusted. Although health behaviors were significantly different between men and pre- and postmenopausal women, those effects on sex and menopausal status differences in the associations between body composition measures and IR were not assessed. Nevertheless, the current study demonstrated sex, menopausal status, and regional differences in the strength of the associations between FM%, MM%, and BMC% and IR and compared the superiority of these body composition measures in discriminating high levels of IR in a representative population.
In conclusion, the results of this population-based study suggested that a higher FM% in men and lower BMC% in premenopausal women in whole body may have stronger associations with IR than other body composition measures and the associations may be stronger in the upper body than those in the lower body. In postmenopausal women, the association strength may be similar across body composition measures. The current findings provide evidence of the differences in the strengths of the region-, sex-, and menopausal status-specific relationships between body composition and IR. Further prospective studies are warranted to elucidate the causality and disentangle the potential interactions between body composition and IR.
Footnotes
Author Disclosure Statement
No conflicting financial interests exist.
Funding Information
This work was funded by the National Research Foundation of Korea Grant funded by the Korean Government (NRF-2017S1A5B8066096).