
Abstract
Background:
Elevated triglyceride (TG) levels and reduced high-density lipoprotein-cholesterol (HDL-c) levels indicate lipid abnormalities, but their levels alone do not reflect the actual status of plasma atherogenicity and cardiovascular disease risk (CVD). TG and HDL-c levels directly affect the balance between plasma atherogenic and antiatherogenic factors, as well as values of the atherogenic index of plasma [AIP (logarithmically transformed ratio of TG-to-HDL-c)]. The aim of this study was to evaluate the AIP risk categories (an indicator of plasma atherogenicity) and the relationships of AIP with other atherosclerosis-related lipid parameters in patients with type 2 diabetes mellitus (T2DM) and their potential clinical utility.
Methods:
Standard lipid profile, AIP, and lipid hydroperoxides (LOOH) were investigated in 124 T2DM outpatients (mean age 52.7 ± 5.9 years) and 61 healthy subjects (mean age 50.9 ± 6.8 years). T2DM patients were subclassified according to the AIP risk category and glycemic control.
Results:
Higher levels of AIP, LOOH, and TG and lower HDL-c (all P < 0.0001) were observed in T2DM patients than in the control group. AIP positively correlated with LOOH, non-HDL-c, and the non-HDL/HDL ratio (all P < 0.0001). The TG level was strongly correlated with the LOOH level among T2DM patients (P < 0.0001).
Conclusions:
The close association of AIP with other atherosclerosis-related lipid factors reveals an increased plasma atherogenicity. AIP risk categories indicate the actual status of plasma atherogenicity and identify subjects who are at an increased atherogenic risk and the development of CVD. In this respect, AIP has a promising future in routine clinical practice.
Introduction
Atherogenic dyslipidemia characterized by an altered metabolism of triglycerides (TGs), high-density lipoprotein cholesterol (HDL-c), and low-density lipoprotein cholesterol (LDL-c) is a predisposing factor of the development of atherosclerotic cardiovascular disease (CVD). Despite systematic glycemic control and lipid-lowering therapy, this disease is a leading cause of morbidity and mortality in subjects with type 2 diabetes mellitus (T2DM). 1 Cardiovascular risk increases with increased levels of small, dense LDL particles (sdLDL); large, TG-rich very-low-density lipoprotein (VLDL) particles; and apolipoprotein B (ApoB) and decreased levels of small, dense HDL particles. Dysregulation of glucose metabolism is usually associated with an atherogenic lipid profile that contributes to the development of atherosclerosis-related diseases. 2 –4 Long-term hyperglycemia initiates the oxidation and glycation of various molecules, such as lipids and proteins, that can participate in the development of diabetic complications. Specifically, oxidized LDL can induce vascular endothelial dysfunction, apoptosis of endothelial cells, oxidative stress, and mitochondrial dysfunction. 5 –7 Lipid hydroperoxides (LOOH) have been found to accumulate mainly in LDL (more than 65%) and therefore plasma LDL is considered to be the major carrier of circulating lipid hydroperoxides. 6
It has been suggested that high TG level and low HDL-c level can contribute significantly to the increased CVD risk despite optimal control of LDL. 8,9 Further studies revealed that increased accumulation of sdLDL particles in arterial walls occurs when the TG level exceeds the threshold of 2.3 mmol/L. 1,2,10 Monitoring CVD risk factors is an essential part of the therapeutic strategy of T2DM. The values of risk factors monitored during this therapy may be a suitable prognostic criterion for the prevention of diabetic complications. As reported, 11 reducing the risk of macrovascular complications requires a multifactorial approach. Changes in multiple risk factors at the same time can be more beneficial in preventing CVD than changes in individual risk factors. However, CVD risk assessment using some scoring systems does not include parameters such as TG and HDL. In addition, these systems do not reveal the actual level of CVD risk or changes in this risk during treatment. Therefore, recent research has focused on identifying such markers that could more accurately reflect the balance between plasma atherogenic and antiatherogenic factors. The atherogenic index of plasma [AIP, (logarithmically transformed ratio of TG to HDL-c)] was proposed as a potential indicator of plasma atherogenicity. AIP was experimentally identified by the relationship of AIP with the fractional cholesterol esterification rate in HDL of ApoB-depleted plasma and with lipoprotein-particle size. 12 –14 In addition, some studies have observed close associations of AIP with glucose homeostasis, insulin resistance, micro- and macrovascular complications. 15 –17
Although lipid abnormalities in T2DM usually include elevated TG and reduced HDL-c, their levels alone do not reflect the actual status of plasma atherogenic and antiatherogenic balance, nor the actual CVD risk. Therefore, we hypothesized that the AIP risk categories could identify high-risk subjects despite systematic glycemic control and lipid-lowering therapy. This study focused on the evaluation of AIP risk categories as an indicator of the actual status of plasma atherogenicity in T2DM subjects. In addition, the relationships of AIP with other atherosclerosis-related lipid parameters and their potential clinical utility were evaluated.
Materials and Methods
Subjects
The present study was conducted on 124 outpatients with previously diagnosed type 2 diabetes [83 males (67%); mean age 52.7 ± 5.9 years] and 61 healthy subjects [38 males (62%); mean age 50.9 ± 6.8 years]. Inclusion criteria were T2DM patients (age <60 years) receiving glucose-lowering therapy before enrolling in the study. Patients with a history of hepatic dysfunction, acute infections, or malignant diseases before enrolling in the study were excluded from the study. At the time of enrollment, patients were on insulin, an oral hypoglycemic agent (OHA), a combination of insulin and OHA, or a special diet. Sixty-four percent of patients were on lipid-lowering therapy with statins or fibrates. Glycemic control of diabetes 18 was performed using blood glycated hemoglobin (HbA1c) measured at the time of enrollment. The control group consisted of age-matched healthy subjects selected from the general population without a history of hyperglycemia, abnormal lipid profile, hypertension, CVD, or T2DM.
The study was approved by the Ethics Committee of the Faculty of Medicine, Comenius University, and the University Hospital, Bratislava, Slovakia (1/0451/12). All participants signed informed consent for inclusion in this study. The study was performed in accordance with the ethical principles for medical research involving human subjects of the World Medical Association Declaration of Helsinki (as revised in 2013). The patient anonymity was preserved within the text of the article in accordance with ethical principles. Clinical trial registration did not applicable to this study.
Measurements
Fasting blood samples were collected from all participants for the determination of biochemical parameters. Lipid profile [TG, total cholesterol (CHOL-t), HDL-c, LDL-c, ApoB, and apolipoprotein A1 (ApoA1)] and glucose in serum were performed by standardized methods in an automatic analyzer (ADVIA 2400 Chemistry System; Siemens) using kits (Erba Lachema, Brno, Czech Republic) in an accredited laboratory of clinical biochemistry in Bratislava. The Variant II Turbo Hemoglobin Testing System (Bio-Rad Laboratories, Hercules, CA) was used for the determination of HbA1c in whole blood. HbA1c levels are expressed in both Diabetes Control and Complications Trial (DCCT)-derived units (as %) and International Federation of Clinical Chemistry and Laboratory Medicine (IFCC)-recommended SI units (as mmol/mol). 18
LOOH levels were determined spectrometrically 19 (UV-1800 Spectrophotometer; Shimadzu Corporation, Japan) at 365 nm and 37°C, using the molar extinction coefficient for I3 (24,600 mol−1 · dm3 · cm−1). LOOH levels are expressed as nmol/mL of serum.
Lipid risk markers included AIP [logarithmically transformed ratio of TG to HDL-c (both in mmol/L)], non-HDL-c (the difference between CHOL-t and HDL-c), the non-HDL/HDL ratio (quotient between non-HDL-c and HDL-c), and the ApoB/ApoA1 ratio (quotient between Apo B and ApoA1). 1,20 AIP risk categories were classified as follows: AIP <0.11 (low risk), AIP = 0.11–0.21 (moderate risk), and AIP >0.21 (high risk). 12
Statistical analysis
Statistical analysis was conducted with the StatsDirect statistical software, version 2.7.2. (StatsDirect® Sales, Cheshire, United Kingdom). Excel® 2016 (Microsoft® Corporation) was used for graphical representation. The Shapiro-Wilk W-test was used to test the normality of data distributions, and the F-test was used to test for the equality of variances to choose the appropriate statistical test. Categorical variables were compared by the chi-squared test. Data with a normal distribution were compared by Student's t-test. These results are expressed as mean ± standard deviation. Differences between data with a nonnormal distribution were evaluated by the nonparametric Mann–Whitney U-test. These results are expressed as median (25th percentile; 75th percentile). T2DM patients were divided into three groups according to AIP risk categories and HbA1c levels. In each risk group, differences between the levels of biochemical parameters were analyzed using a one-way analysis of variance test, and post hoc pairwise comparisons were performed, adjusting the level of significance for multiple comparisons by the post hoc Bonferroni correction. Spearman's rank correlation test was used to evaluate the relationships between the investigated variables in all study groups, which are documented by the correlation coefficient Rho (r). The statistical significance (P < 0.05) of the difference between two correlation coefficients in each set of independent comparisons was assessed by the Fisher r-to-z transformation.
Results
Table 1 shows the basic characteristics of both the T2DM and control groups. The study population consisted predominantly of men in both the T2DM and control groups. There was no significant difference between these groups with respect to age or the proportion of men.
Basic Characteristics of the Study Participants
Data are expressed as mean ± standard deviation for parametric variables or median (25th percentile; 75th percentile) for nonparametric variables.
n (%) represents the number of subjects per group expressed as a percentage.
P < 0.05 is defined as statistically significant.
AIP, atherogenic index of plasma (log[TG/HDL]); ApoA1, apolipoprotein A1; ApoB, apolipoprotein B; BMI, body mass index; CVD, cardiovascular disease; OHA, oral hypoglycemic agents; HbA1c, glycated hemoglobin; CHOL-t, total cholesterol; HDL-c, high-density lipoprotein cholesterol; LDL-c, low-density lipoprotein cholesterol; LOOH, lipid hydroperoxides; TG, triglyceride; T2DM, type 2 diabetes mellitus.
Significant between-group differences in body mass index (BMI) were recorded. In the T2DM group, 60% of subjects were obese and 35% were overweight. Only 5% of these patients had an optimal BMI. Overweight occurred in 64% of healthy controls, but there was no obesity. No statistically significant associations of gender and BMI with the studied atherosclerosis-related lipid factors in both the T2DM and control groups were found (data not shown).
History of CVD and hypertension occurred in 15% and 61% of T2DM patients, respectively. Glucose-lowering therapy included predominantly OHA and diet. Of all T2DM patients, 79 were on lipid-lowering therapy (58% statins and 6% fibrates) and 36% of patients did not take lipid-lowering agents.
T2DM patients were divided according to AIP risk category 13 into three groups (Table 2): 37% L group (AIP <0.11, low risk), 16% M group (AIP = 0.11–0.21, moderate risk), and 47% H group (AIP >0.21, high risk). We did not observe between-group differences in BMI, duration of diabetes, or lipid-lowering therapy. However, there were between-group differences (L group vs. H group) in the proportion of men and age. The occurrence of CVD was comparable between the L and H groups (15% and 17%, respectively). The highest incidence of hypertension was recorded in the L group (67%). Fasting glycemia was higher in the H group than in the L group. There were no statistically significant differences in the HbA1c level among all AIP-stratified groups. Although HbA1c was higher in the H group than in the L group, the differences were not significant.
Biochemical Characteristics of Patients with Type 2 Diabetes Subclassified According to Atherogenic Index Of Plasma Risk Categories
AIP risk categories: L group: AIP <0.11 (low risk), M group: AIP = 0.11–0.21 (moderate risk), H group: AIP >0.21 (high risk).
Data are expressed as mean ± standard deviation for parametric variables or median (25th percentile; 75th percentile) for nonparametric variables.
n (%) represents the number of subjects per group expressed as a percentage.
P-value indicates the statistical significance of the difference between the levels of biochemical parameters analyzed using the one-way ANOVA test and post hoc pairwise comparisons (Bonferroni correction).
P-value between the L and M groups.
P-value between the L and H groups.
P-value between the M and H groups.
ANOVA, analysis of variance.
In addition, T2DM patients were divided according to HbA1c level (Table 3) into three groups: 26% good glycemic control (GGC) group [HbA1c <6% (<42 mmol/mol)], 51% reasonable glycemic control (RGC) group [HbA1c = 6%–7.5% (42–58 mmol/mol)], and 23% poor glycemic control (PGC) group [HbA1c >7.5% (>58 mmol/mol)]. We did not find statistically significant between-group differences in age, in the proportion of men, or lipid-lowering therapy. Significant between-group differences in BMI (GGC vs. PGC) and duration of diabetes (GGC vs. RGC) were recorded. The highest incidence of CVD was in the PGC group (21%) and of hypertension in the RGC group (68%).
Biochemical Characteristics of Patients with Type 2 Diabetes Subclassified According to Glycemic Control
Glycemic control levels: GGC group, PGC group, RGC group.
Data are expressed as mean ± standard deviation for parametric variables or median (25th percentile; 75th percentile) for nonparametric variables.
n (%) represents the number of subjects per group expressed as a percentage.
P-value indicates the statistical significance of the difference between the levels of biochemical parameters analyzed using the one-way ANOVA test and post hoc pairwise comparisons (Bonferroni correction).
P-value between the GGC and RGC subgroups.
P-value between the GGC and PGC subgroups.
P-value between the RGC and PGC subgroups.
GGC, good glycemic control; PGC, poor glycemic control; RGC, reasonable glycemic control.
T2DM patients had significantly higher levels of AIP, LOOH, TG, and the non-HDL/HDL ratio, as well as significantly lower HDL-c levels compared to healthy subjects. There were strong relationships of LOOH with AIP (Fig. 1A) and TG in the DM group. As shown in Table 4, AIP and TG significantly correlated with other lipid risk factors, such as non-HDL-c and non-HDL/HDL. Figure 1B depicts LOOH levels in the study participants stratified according to the AIP risk category and HbA1c level. After dividing T2DM patients according to AIP, there were statistically significant differences in LOOH levels between the L, M, and H groups, as well as between the M and H groups (Fig. 2). The highest levels of LOOH and TG and the lowest levels of HDL-c occurred only in the H group, which was characterized by high CVD risk (AIP = 0.39 ± 0.16). The LOOH level was 48% higher in this group than in the low-risk group. In the H group, there were significant relationships of AIP with LOOH and non-HDL/HDL (r = 0.236, P < 0.05; r = 0.281, P < 0.05, respectively). Moreover, TG significantly correlated with LOOH and non-HDL-c (r = 0.222, P < 0.05; r = 0.391, P < 0.01, respectively) (data not shown). T2DM subjects included in the H group (47%) appeared to be at a high risk of developing CVD complications despite reasonable glycemic control [HbA1c = 6.9 (6.4; 7.8)%; 52.0 (46.2; 61.4) mmol/mol].
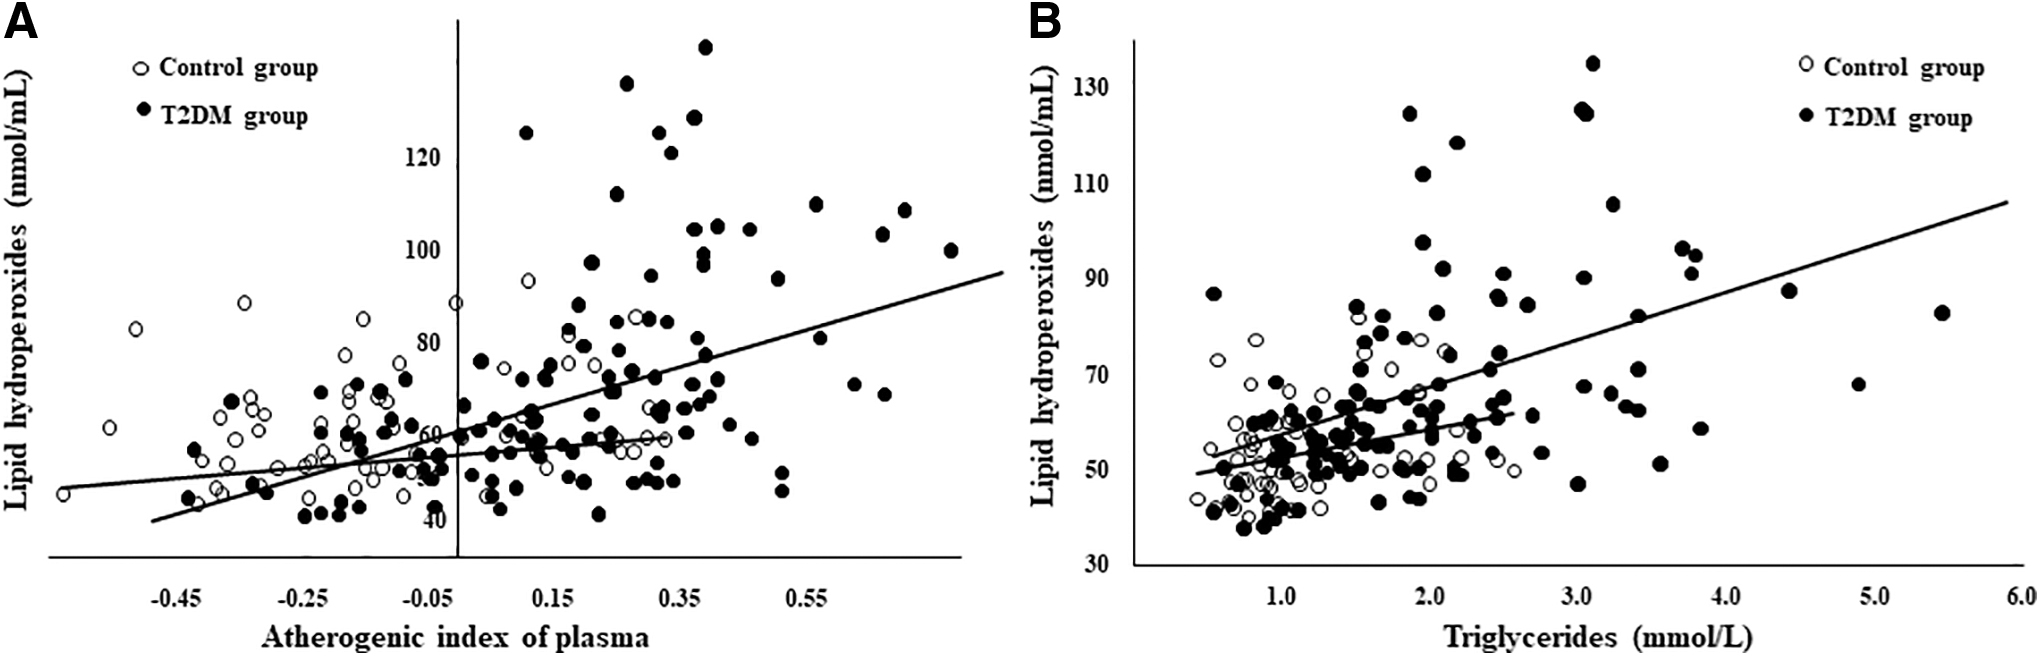
Relationships of lipid hydroperoxides with AIP
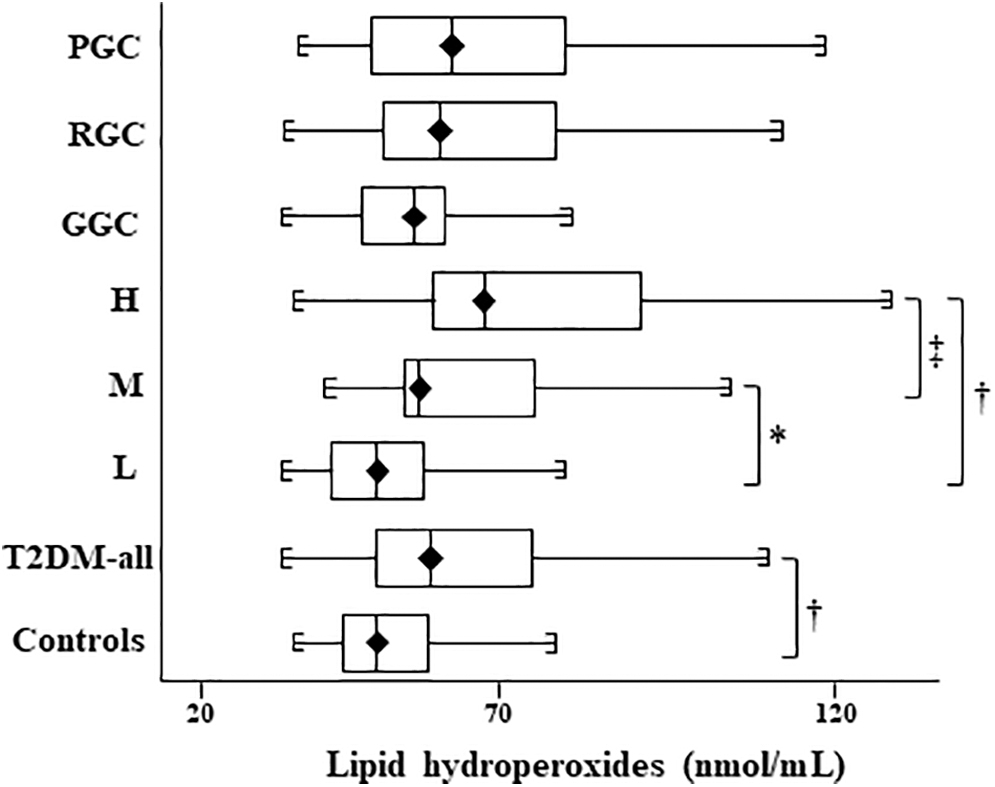
Comparison of lipid hydroperoxide levels in subjects with type 2 diabetes stratified by AIP risk categories and HbA1c levels as well as the control group AIP risk categories: L group: AIP <0.11 (low risk), M group: AIP = 0.11–0.21 (moderate risk), H group: AIP >0.21 (high risk) Glycemic control levels: GGC group: HbA1c <6%; RGC group: HbA1c = 6%–7.5%; PGC group: HbA1c >7.5% *P < 0.005 between the L and M groups. † P < 0.0001 between the L and H groups as well as the T2DM-all and control groups. ‡ P < 0.05 between the M and H groups. T2DM-all, type 2 diabetes-all group; HbA1c, glycated hemoglobin; GGC, good glycemic control; PGC, poor glycemic control; RGC, reasonable glycemic control.
Spearman's Correlations of Investigated Variables in the Study Population
r is Spearman's rank correlation coefficient (rho).
P < 0.05 is defined as statistically significant.
Indicates the statistical significance of the difference between two correlation coefficients using the Fisher r-to-z transformation (P < 0.05).
After dividing T2DM patients according to the HbA1c level (Table 3), there were no statistically significant differences in the LOOH level between the GGC, RGC, and PGC groups. HDL-c was significantly lower in the RGC and PGC groups than in the GGC group. No significant differences in the TG level between these groups were recorded. T2DM patients with HbA1c >7.5% (>58 mmol/mol) had significantly higher levels of AIP, non-HDL-c, and non-HDL/HDL than those in the GGC group. Moreover, AIP levels in the RGC group were close to those in the PGC group and nonsignificantly higher than in the GGC group. Based on the levels of TG and HDL-c (AIP), subjects in the PGC group did not appear to have a tendency to an increased CVD risk over those in the H group. In the PGC group, there were significant relationships of AIP with LOOH and non-HDL/HDL (r = 0.424, P < 0.05; r = 0.750, P < 0.0001, respectively), as well as of TG with LOOH and non-HDL/HDL (r = 0.473, P < 0.005; r = 0.666, P < 0.0001, respectively). However, correlation analysis showed that the statistical power had a decreasing tendency for the relationship of AIP with LOOH, as well as the relationship of TG with LOOH, due to the increasing level of HbA1c in all HbA1c-stratified groups (data not shown).
Discussion
The present study presents some interesting findings based on the AIP risk categories and glycemic control. There were significantly higher levels of AIP, LOOH, TG, and non-HDL/HDL and a significantly lower HDL-c level in the T2DM group than in the control group. The strong relationships of AIP and TG with LOOH in T2DM subjects indicate increased oxidative damage to lipids. Moreover, AIP and TG significantly correlated with other lipid risk factors, such as non-HDL-c and non-HDL/HDL. Therefore, we can speculate that strong correlations of AIP with these risk indexes signal increased plasma atherogenicity in T2DM patients. On the one hand, slightly elevated AIP levels may point to a potential CVD risk in subjects who have not yet shown a significant change in lipid levels. On the other hand, significant changes in the levels of parameters from which this index is calculated can disturb the balance between plasma atherogenic and antiatherogenic particles, and this will indicate markedly elevated AIP.
In recent years, researchers have made much effort to improve CVD risk prediction. Some clinical trials evaluated the atherogenic effects not only of standard lipid markers but also of lesser-known risk factors not routinely used in clinical practice. They concluded that when several lipid parameters are included in a single risk index [log(TG/HDL) 12 –14 non-HDL/HDL ratio, 20,21 ApoB/ApoA1 ratio 22 ], this index has a better predictive value than any individual lipid parameters. A combination of standard lipid parameters included in lipid risk indexes can facilitate the optimization of diagnostic and therapeutic strategies in subjects at a high CVD risk. We speculate that changes in the levels of the risk indexes found by our study may signal their higher predictive value than changes in the level of TG, HDL-c, CHOL-t, ApoB, or ApoA1 alone. According to this, our results demonstrate an increased CVD risk despite systematic glycemic control and lipid-lowering therapy.
As reported, poorly controlled diabetes can be associated with an increased CVD incidence in T2DM subjects. 23,24 Unlike these studies, our study found no significant difference in the level of TG, LDL, CHOL-T, or LOOH between GGC and PGC groups. Moreover, we found significant differences in the levels of other lipid risk factors between the low-risk and high-risk groups than between the good and poor glycemic control groups. Our results showed that the levels of these parameters (directly or indirectly associated with oxidative stress), mainly LOOH, in both groups with good and poor glycemic control, were very similar and independent of the HbA1c level. HbA1c level in patients with T2DM does not appear to be directly associated with the plasma atherogenic spectrum represented by these parameters. This finding is also supported by the nonsignificant correlations between HbA1c and the above lipid parameters in these patients. Moreover, when T2DM subjects were divided according to the AIP risk category, no significant differences in the HbA1c level among AIP-stratified groups were found.
Lipid peroxidation is a crucial process of atherosclerosis, in which oxidized LDL represents a strong proatherogenic factor. LDL lipoprotein is a major carrier of plasma LOOH, and therefore the plasma concentration of LOOH may reflect the extent of oxidative damage to LDL. 6 In accordance with this, we found statistically significant differences in LOOH levels among all AIP-stratified groups. LOOH in the H group was higher (48%) than in the L group. The highest levels of LOOH and TG and the lowest levels of HDL-c occurred only in the H group, which was characterized by the highest AIP. These results indicate that AIP is closely associated with other atherosclerosis-related risk factors in T2DM patients. Moreover, this finding is supported by significant relationships of AIP with LOOH and non-HDL/HDL, as well as of TG with LOOH and non-HDL-c, in the H group. The highest level of AIP was closely associated with the highest level of LOOH in the high-risk group. Therefore, we conclude that patients from the H group (47%) are at the potential risk of developing cardiovascular complications despite reasonable glycemic control. Interestingly, our study showed that there were no differences in the AIP level between the low-risk group and healthy controls. This indicates that AIP risk categories can clearly identify high-risk patients and separate them from low-risk and/or healthy subjects. From a clinical perspective, our findings may suggest a special role for AIP in estimating CVD risk in T2DM subjects.
After subdividing T2DM patients according to the HbA1c level, there were significantly lower HDL-c levels in the RGC and PGC groups compared with the GGC group. However, the TG level did not differ between these groups. Patients in the PGC group had significantly higher AIP than those in the GGC group. It is surprising that AIP in the RGC group was close to that in the PGC group and nonsignificantly higher than in the GGC group. Moreover, this study did not find statistically significant differences in LOOH levels between the GGC, RGC, and PGC groups. Therefore, we can speculate that oxidative damage to lipids (the extent of oxidative stress) in the PGC group was comparable to that in the GGC group. With regard to TG and HDL-c (AIP) levels, patients with poor glycemic control do not appear to have a tendency to an increased plasma atherogenicity compared with the H group. Interestingly, there were no statistically significant differences in HbA1c levels among all AIP-stratified groups. Although the HbA1c level was higher in the H group than in the L group, the difference was not significant. Our results are consistent with a recent cohort study 25 that concluded that hyperglycemia does not appear to be a key indicator of macrovascular risk in T2DM, unlike hyperlipidemia or hypertension. In addition, several clinical trials have not clearly confirmed a direct causal role of HbA1c in the etiopathogenesis of atherosclerosis. 26,27 This could be related to the fact that macrovascular complications of diabetes usually manifest earlier than microvascular complications and may not be related to glycemic control.
Although LDL-c has been suggested as the primary target of lipid-lowering treatment, 1 recent reports propose the use of other therapeutic targets. 3 Moreover, the method for determining the plasma sdLDL particles is demanding and is not commonly used in clinical practice. For this reason, it seems that AIP may be a better indicator of increased levels of sdLDL particles and plasma atherogenicity, 12,13 which are associated with atherogenic risk. Changes in the levels of TG, HDL, and LDL are metabolically interrelated. HDL is usually inversely associated with TG in T2DM due to the exchange of VLDL-TG for HDL-cholesteryl esters catalyzed by the cholesteryl ester transfer protein. 9,28,29 Consistent with these findings, our study also detected inverse correlations of TG with HDL-c in all study groups.
This study has some limitations, such as the relatively small sample-size, related to the strict inclusion criteria. Following the division of T2DM subjects according to the AIP risk category and HbA1c level, there was a smaller sample size of individual groups. Moreover, this study enrolled T2DM patients with or without a history of CVD. Because the occurrence of CVD was very low among these patients, the differences between variables in these groups were not evaluated. We are also aware that future studies with larger cohorts are needed to confirm a direct link of the AIP risk category with the incidence of CVD. Despite these limitations, our study has some strengths, represented by the precisely defined criteria for the limits of lipid risk factors and by some parameters (AIP, non-HDL-c, ApoB, and ApoA1) that are not routinely investigated in clinical practice. This study also highlights some advantages of the use of AIP in routine clinical practice related to its specific properties. From a statistical perspective, the logarithmically transformed ratio of TG/HDL eliminates the problem of nonnormal data distributions; and therefore, AIP is a more suitable marker than individual lipid parameters or a simple TG/HDL ratio.s 30 Regarding clinical utility, AIP may be a therapeutic target to monitor the efficacy of lipid-modifying therapy in subjects with atherogenic dyslipidemia.
In conclusion, AIP can be easily calculated from two parameters (TG and HDL-c) of the standard lipid spectrum (routinely measured), which does not require additional financial costs. Therefore, the use of AIP in routine clinical practice can be beneficial not only for patients themselves but also for the general health system. AIP may reflect an increased atherogenic risk and developing CVD. In addition, AIP risk categories and their long-term monitoring may be used not only to predict CVD risk in preclinical stages of atherosclerosis but also to distinguish those subjects in whom CVD is progressing from those who remain clinically stable. AIP, as an additional marker of CVD risk and disease progression, has a promising future in clinical practice.
Footnotes
Acknowledgments
The authors thank Mrs. O. Kopacikova and Z. Uliasova for their technical assistance and for taking blood samples from the study participants.
Author Disclosure Statement
No conflicting financial interests exist.
Funding Information
This study was supported by the Ministry of Education, Science, Research and Sport of the Slovak Republic, Bratislava, Slovakia ([Scientific Grant Agency] grant 1/0451/12).