
Abstract
Background:
While the overweight and obesity epidemic in the adolescent population is well described, a comprehensive evaluation of cardiometabolic health markers has not been reported. Our purpose was therefore to determine the prevalence of cardiometabolic risk factors among non-diabetic individuals 12 to19 years of age in the United States.
Methods:
We analyzed data from nationally representative samples of U.S. adolescents (NHANES, 2007–2016). Optimal cardiometabolic health was defined as an absence of risk factors, that is, at least normal values on each of the following 11 measures: body mass index (BMI) percentile, waist circumference percentile, blood pressure, total cholesterol, high-density lipoprotein (HDL) cholesterol, low-density lipoprotein cholesterol, non-HDL cholesterol, triglycerides, fasting plasma glucose, alanine aminotransferase, and insulin resistance. Domain analyses were conducted with Rao-Scott chi-square tests of independence. Multivariable linear/logistic regressions examined sociodemographic associations with cardiometabolic health.
Results:
Less than a quarter of the population (22.0%; 95% CI; 19.4%–24.8%) was found to have no cardiometabolic risk factors. Among individuals with a normal BMI, 35.7% (95% CI; 31.6%–40.1%) had no cardiometabolic risk factors. Family poverty-to-income ratio was identified as an independent predictor of cardiometabolic health (P = 0.01). A consistent trend was present between increasing BMI percentile and number of cardiometabolic risk markers.
Conclusions:
The overall prevalence of U.S. adolescents with no cardiometabolic risk factors is less than 25%. Even among those without increased BMI, less than half meet all metabolic health criteria. In addition, socioeconomic disparities are predictors of metabolic health.
Introduction
Poor cardiometabolic health in adults has been recognized and defined in various ways for decades. 1 The National Cholesterol Education Adult Treatment Panel III in 2001 defined “metabolic syndrome” based on five criteria: central obesity as measured by waist circumference (WC), elevated triglycerides, decreased high-density lipoprotein cholesterol (HDL-C), elevated blood pressure (BP), and abnormal fasting plasma glucose (FPG). 2 In 2007, the International Diabetes Federation defined metabolic syndrome in children and adolescents using the same criteria with age-adjusted thresholds. 3
What has been less well described is the percentage of those in the United States with optimal metabolic health. If optimal metabolic health is defined as having normal levels of each component of the metabolic syndrome, only 12.2% of U.S. adults would be considered healthy. 4 For children and adolescents, while the rates of metabolic syndrome and abnormalities in individual markers of risk have been published, 5 –10 a comprehensive evaluation of those who are considered healthy is lacking. For instance, can those who are overweight or obese be metabolically healthy, and what proportion of those with normal weight is metabolically unhealthy? Therefore, our aim was to evaluate the cardiometabolic risk burden among the non-diabetic U.S. adolescent population.
Methods
Data source
The National Health and Nutrition Examination Survey (NHANES) is a series of cross-sectional health assessments conducted under the auspices of the Centers for Disease Control and Prevention (CDC). The NHANES sampling procedure utilizes a complex multistage probability cluster design, which oversamples specific groups to provide meaningful subgroup analyses and more reliable parameter estimates. 11 The design and weighting methodology have previously been described. 12
Five consecutive, 2-year data collection cycles covering the period from 2007 to 2016 were examined. Through probability sampling, weighted data from each cycle are designed to reflect the noninstitutionalized U.S. population. Participation rates for NHANES ranged from 68.5% (2013–2014) to 75.4% (2007–2008). Written consent was obtained from participants 12 years of age and older and from parents or guardians of participants younger than 18 years. 11
This study received institutional approval through the Womack Army Medical Center Human Research Protection Office.
Sample
Participant selection is detailed in Figure 1; only adolescents (12–19 years of age) with valid anthropometric measures, BP, and laboratory results were included in this study. Exclusionary criteria were prior diagnosis of diabetes and taking prescription medications labeled for diabetes, dyslipidemia, hypertension, and/or obesity. A complete list of exclusionary medications is in Supplementary eTable 1 in the Supplement.
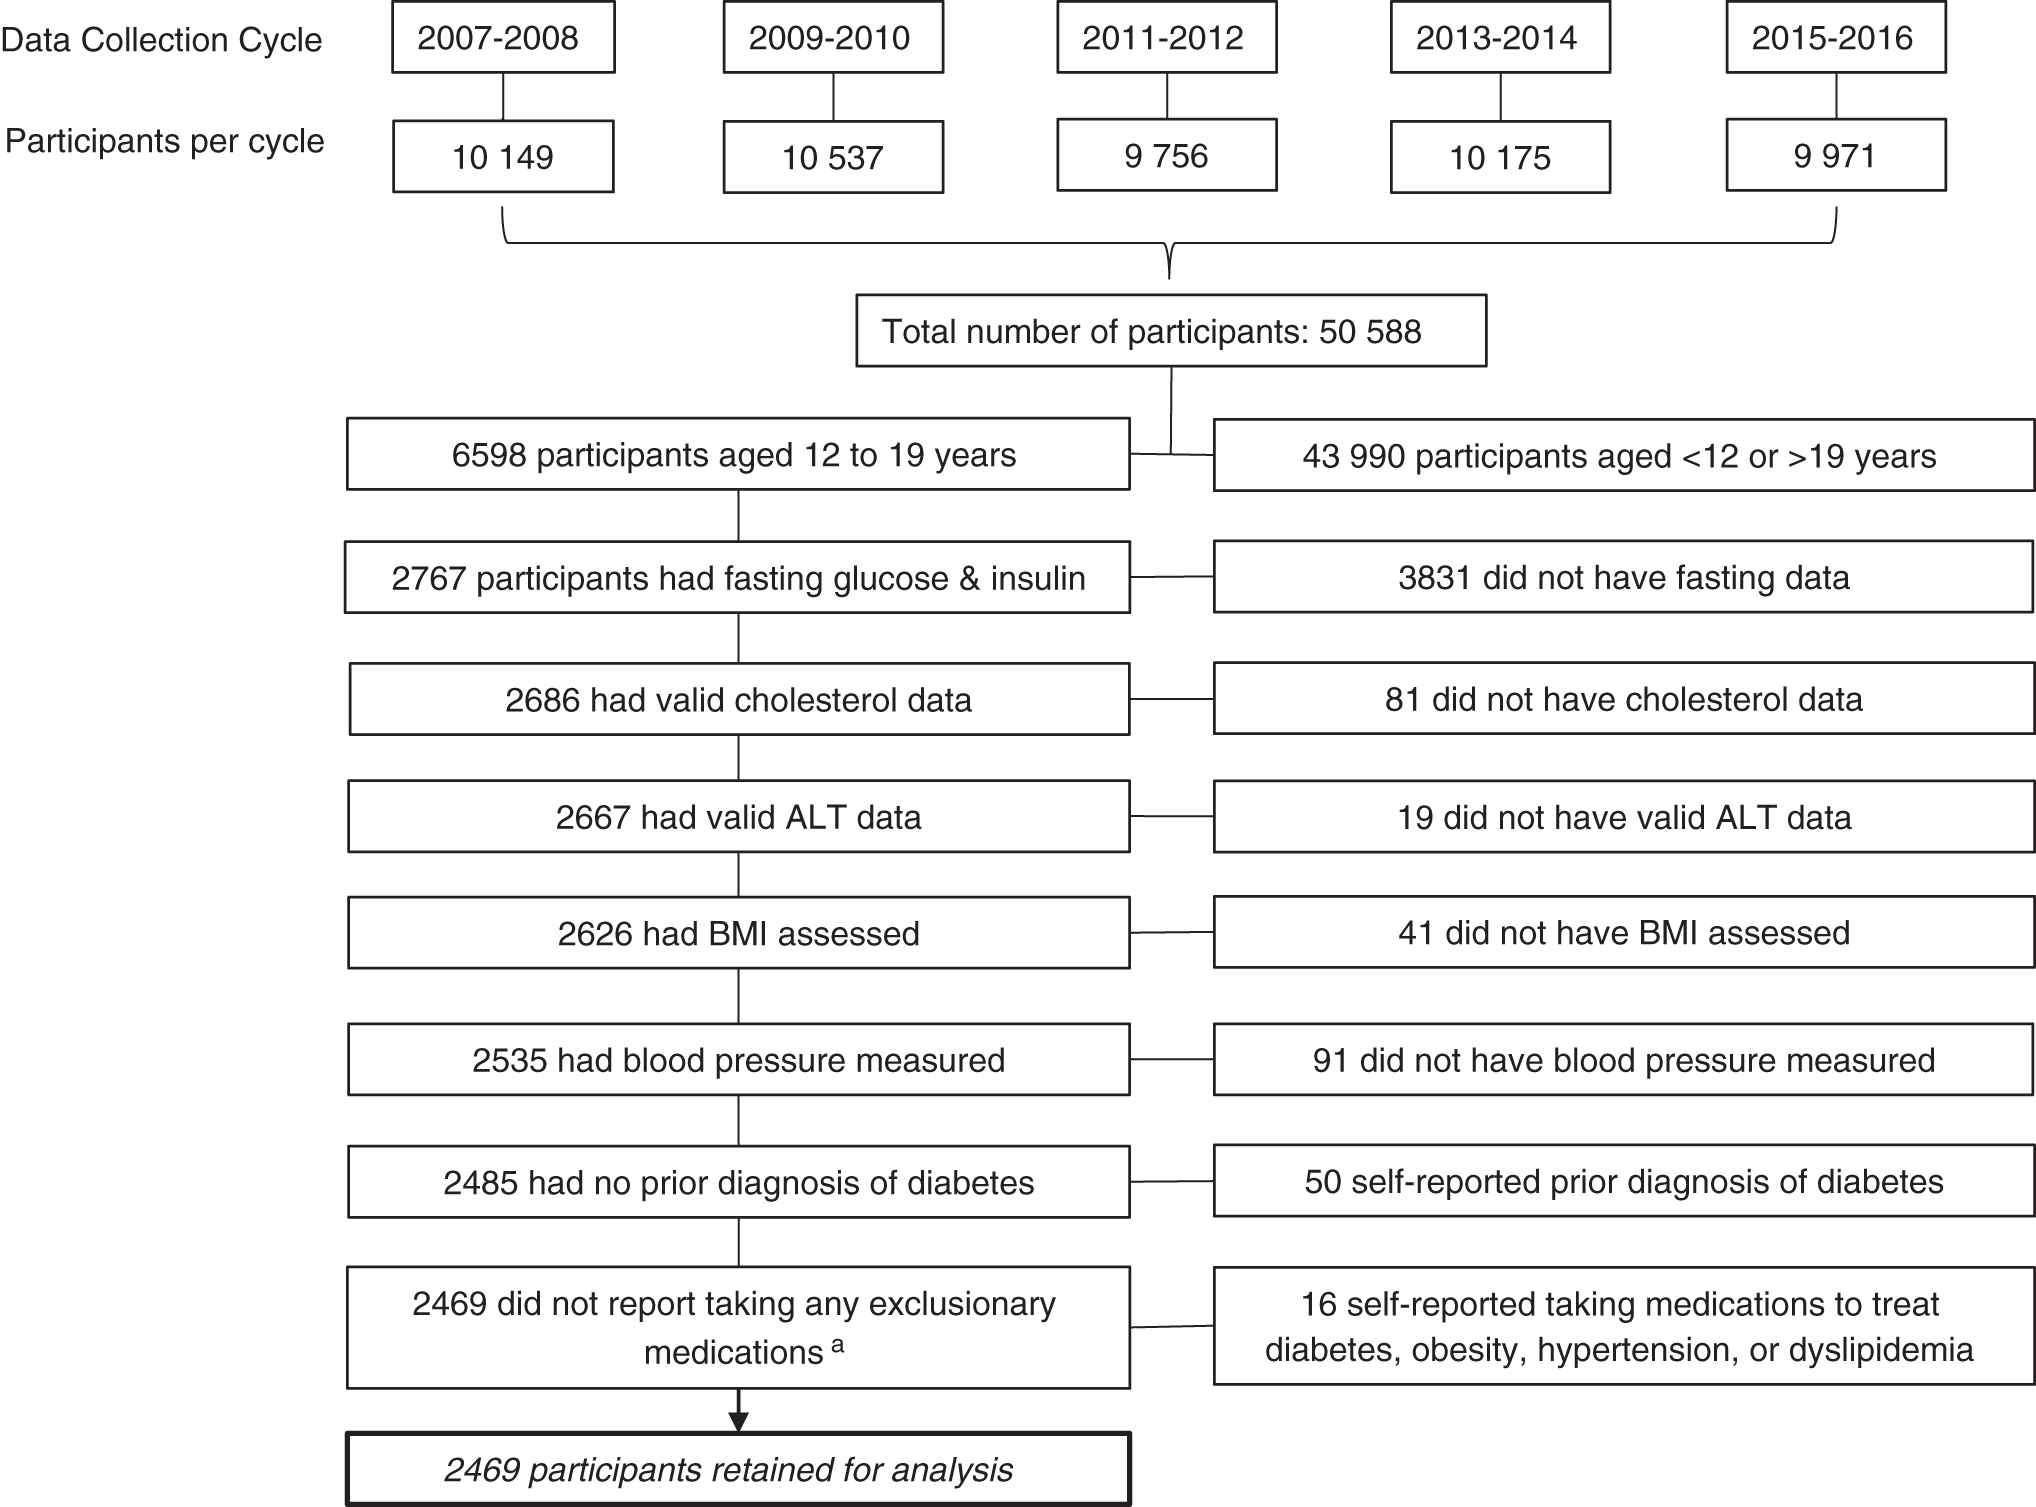
Participant Selection. aFor a list of exclusionary medications, see Supplementary eTable 1. ALT, alanine aminotransferase; BMI, body mass index.
Demographic Characteristics of 10-Year NHANES Sample, n = 2469
Significance based on Rao-Scott chi-square statistic comparing characteristic with metabolic health as defined by the 11-component model.
n = 2256 across domains due to nonresponse.
BMI classification based on age- and gender-adjusted CDC growth charts.
Classification based on gender- and race-/ethnic-specific cut points for serum cotinine (ng/mL). n = 2032 across domains due to lack of serum data.
BMI, body mass index; CI, confidence interval.
Data collection
NHANES data collection consists of participant and family questionnaires, clinical examinations, and laboratory tests. Participants completed a home-based interview followed by a physical examination and sample collection conducted in a mobile examination center (MEC). Participant characteristics of interest included age, gender (male or female), race/ethnicity (non-Hispanic white, non-Hispanic black, Hispanic, or other, including multiracial), and a poverty to family income ratio ([PIR]; ≤130%, >130% to 350%, or >350%).
The PIR was calculated by dividing family's total income by the federal poverty threshold index adjusted for family size at the time of the interview. The poverty threshold index was provided by the Department of Health and Human Services. Cut points for income comparisons were determined using the cutoff point for participation in the Supplemental Nutrition Assistance Program (130% of the federal poverty level [FPL]) as well as the previously established upper band of 350% FPL to delineate high-income families. 13 During the interview portion, self-reported medical history and current prescription medication use were recorded.
Clinical evaluations were performed during the MEC visit and included physical examinations, wherein body mass index (BMI), WC, and BP measures were obtained. Based on age- and gender-adjusted BMI percentiles, participants were classified as normal weight (<85th percentile), overweight (85th to <95th percentile), or obese (≥95th percentile) with CDC's gender-specific BMI-for-age growth tables. 10
After sera were collected and processed, specimens were shipped to the Division of Laboratory Sciences, National Center for Environmental Health, for analysis. Samples were subsequently assayed for serum cotinine, alanine aminotransferase (ALT), FPG, total cholesterol (TC), HDL-C, low-density lipoprotein cholesterol (LDL-C), and triglyceride levels. Participants were stratified by cotinine into nicotine user/nonuser using previously determined gender-specific racial and ethnic based cut points. 14 Insulin resistance (IR) was evaluated with the homeostasis model assessment (HOMA) score, which was calculated using the following formula: [fasting insulin (microU/mL) × fasting glucose (mM)]/22.5. All participants included in this study fasted for a minimum of 8 hrs before sera collection. Cut points for all measures are summarized in Supplementary eTable 2.
Prevalence of Normal Values on Metabolic Health Components by Gender
SI conversion factors: to convert cholesterol to mM, multiply values by 0.0259; to convert ALT to ukat/L, multiply by 0.0167; to convert triglycerides to mM, multiply by 0.0113; and to convert glucose to mM, multiply by 0.0555.
Statistical significance between genders from Rao-Scott adjusted chi-squares.
ORs tabulated for significant results only. Referent, gender = male.
ALT cut points: <26 IU/L for males and <23 IU/L for females.
BP cut points: <90th percentile (age, gender, and height adjusted) for participants age 12; <120 mm Hg systolic and <80 mm Hg diastolic for participants age ≥13.
BMI percentile cut points: <85th percentile (age and gender adjusted per CDC growth charts).
Waist circumference cut points: <90th percentile (age, gender, and height adjusted).
ALT, alanine aminotransferase; BMI, body mass index; BP: blood pressure; CI, confidence interval; FPG, fasting plasma glucose; HDL-C, high-density lipoprotein cholesterol; HOMA-IR, homeostatic model assessment of insulin resistance; LDL-C, low-density lipoprotein cholesterol; OR, odds ratio.
Metabolic health
Due to lack of consensus regarding criteria for metabolic health in the pediatric population, we took a faceted approach to classifying our sample. First, 11 cardiometabolic risk factors were chosen as recommended by major societal guidelines: BMI percentile, WC percentile, BP, TC, HDL-C, LDL-C, non-HDL cholesterol, triglycerides, FPG, ALT, and IR. 3,4,15 –18 Our definition of optimal metabolic health required measurements within established normal reference ranges on each model component.
Normal values included a BMI below the 85th percentile (age and gender adjusted) and a WC below the 90th percentile (age, height, and gender adjusted). For participants 12 years of age, BP less than the 90th percentile (age, gender, and height adjusted) was considered normal; for older adolescents (13–19 years of age), normal BP was less than both 120 mm Hg systolic and 80 mm Hg diastolic. 15,16 Normal levels were also defined as TC <170 mg/dL, LDL-C <110 mg/dL, non-HDL cholesterol <120mg/dL, HDL-C >45 mg/dL, triglycerides <90 mg/dL, and ALT <26 IU/L for boys or <23 IU/L for girls. 5,15 Finally, metabolically healthy participants had an FPG <100 mg/dL and a HOMA-IR score <3.4. 17,19
Statistical analysis
To account for unequal selection probabilities among participants and adjustments for nonresponse, appropriate sampling weights were applied. Variances were estimated using Taylor series linearization. Weighted prevalence estimates are reported with 95% Wald confidence intervals (CI). Estimates with relative standard errors exceeding 30% are noted. When data were incomplete in the analyzed sample, missing values were not imputed, but rather treated as missing through complete case analysis.
Domain analyses were conducted with Rao-Scott chi-square tests of independence. Participant characteristics such as age, gender, PIR, and nicotine use were examined using logistic regression modeling. For all analyses, statistics with P values <0.05 were declared statistically significant. Analyses were conducted using SPSS Complex Samples version 25 and SAS version 9.4.
Results
A total of 2469 individuals representing ∼13 million noninstitutionalized U.S. youth 12–19 years of age were examined. Sociodemographic characteristics of the analyzed sample are shown in Table 1. No significant temporal variation across NHANES cycles was observed with regard to the distributions of gender, age, race/ethnicity, nicotine use, or PIR category (all P > 0.05). In addition, no difference by time was found with respect to the rate of adolescents with optimal metabolic health (meeting all 11 components for cardiometabolic fitness). The mean number of risk factors present (number of measures for which the individual was not at least in the established healthy range) was 2.5 (95% CI: 2.4–2.6).
The overall prevalence of optimal metabolic health among adolescents was 22.0% (95% CI: 19.4%–24.8%) when utilizing the 11-component model for cardiometabolic risk (BMI percentile, WC, TC, HDL-C, LDL-C, non-HDL cholesterol, triglycerides, ALT, FPG, BP, and HOMA-IR). If the less common measures of HOMA-IR and WC were excluded, 24.2% (95% CI: 21.6%–27.0%) of adolescents had normal levels. In contrast, the 5-component metabolic syndrome model (WC, BP, FPG, triglycerides, and HDL-C) classified 45.5% of participants (95% CI: 42.3%–48.6%) as metabolically healthy.
We observed no statistically significant difference in the proportion of metabolically healthy individuals based on gender, age, or race/ethnicity (all P > 0.05). Approximately one-fifth (20.1%; 95% CI: 16.3%–24.6%) of participants 12–14 years of age were found to be metabolically healthy compared to 24.2% (95% CI: 19.4%–29.8%) among those 15–16 years of age and 22.3% (95% CI: 18.7%–26.4%) among those 17 years of age or older. Among males, 20.2% (95% CI: 17.2%–23.6%) were classified as metabolically healthy versus 24.0% (95% CI: 20.5%–27.8%) of females. Although no difference in the proportion of individuals meeting all 11 criteria was found based on gender, boys and girls did differ on specific measures. Percentages of participants with normal levels on each component are shown by gender in Table 2.
Overall, Hispanics appeared to have the lowest rate of metabolic health with only 18.7% (95% CI: 16.1%–21.7%) meeting all criteria. In contrast, 22.9% (95% CI: 18.9%–27.5%) of non-Hispanic whites and 21.9% (95% CI: 18.3%–25.9%) of non-Hispanic blacks were classified as metabolically healthy. Individuals of other ethnic groups, including multiracial participants, had the highest rate of optimal metabolic health (24.4%; 95% CI: 17.4%–33.1%). As stated above, none of these race/ethnicity comparisons was statistically significant. In examining nicotine use among participants, we found no difference between nicotine users and nonusers with respect to the rate of those who met all 11 criteria for metabolic fitness. Similarly, no dose–response effect was observed between serum cotinine and the number of risk factors present.
In contrast to the demographic characteristics of our sample, family PIR was found to be an independent predictor of metabolic health (P = 0.01). Among participants whose family income was at or below 130% FPL, 19.3% (95% CI: 16.3%–22.6%) met all 11 criteria for metabolic health. In contrast, 27.3% of participants (95% CI: 21.1%–34.4%) with a family income greater than 350% FPL were classified as metabolically healthy. Individuals in this income group had greater odds (OR 1.57; 95% CI: 1.11–2.23) of being metabolically healthy than individuals with family income at or below 130% FPL. No difference was observed in metabolic fitness between adolescents above 350% FPL and those >130%, but ≤350% FPL (P = 0.08). The prevalence of cardiometabolic risk factors by PIR is shown in Table 3.
Prevalence of Cardiometabolic Risk Factors by Family Income
Total does not sum to 2469 due to nonresponse regarding income.
Assessed cardiometabolic risk factors: alanine aminotransferase; body mass index; blood pressure; total cholesterol; high-density lipoprotein cholesterol; homeostatic model assessment of insulin resistance; low-density lipoprotein cholesterol; non-high-density lipoprotein cholesterol; plasma fasting glucose; triglycerides; and waist circumference.
Standard error >30%.
CI, confidence interval; FPL, federal poverty level.
Table 4 shows the frequency of cardiometabolic risk factors by age- and gender-adjusted BMI classification. Among individuals with a BMI percentile indicating normal weight, 35.7% (95% CI: 31.6%–40.1%) had no cardiometabolic risk factor. Excluding BMI and WC percentiles, 21.4% (95% CI: 17.6%–25.7%) of overweight individuals and 5.7% (95% CI: 2.8%–11.2%) of obese individuals had no other risk factor present. In examining the various weight categories and the presence of risk factors other than BMI or WC percentiles, the presence of three or more risk factors was found in 23.9% (95% CI: 21.0%–27.0%), 45.8% (95% CI: 41.3%–50.5%), and 63.9% (95% CI: 56.2%–70.9%) of normal-weight, overweight, and obese adolescents, respectively. Similarly, excluding BMI and WC percentiles, normal-weight individuals have a mean of 1.5 risk factors (95% CI: 1.3–1.6). This is significantly lower (P < 0.001) than the number of risk factors in adolescents who are overweight or obese (overweight: 2.4, 95% CI: 2.3–2.6; obese: 3.5, 95% CI: 3.2–3.8).
Prevalence of Cardiometabolic Risk Factors by Age- and Gender-Adjusted Body Mass Index Classification
Assessed cardiometabolic risk factors: alanine aminotransferase; body mass index; blood pressure; total cholesterol; high-density lipoprotein cholesterol; homeostatic model assessment of insulin resistance; low-density lipoprotein cholesterol; non-high-density lipoprotein cholesterol; plasma fasting glucose; triglycerides; and waist circumference.
Standard error >30%.
CI, confidence interval.
Discussion
Current guidelines establish cutoffs for markers of cardiometabolic risk in children. 5,15 –17 When using our 11-component model to define metabolic health, we found that 22.0% of all U.S. adolescents are deemed to have optimal metabolic health. If the less commonly used measures of WC and HOMA-IR are eliminated, 24.2% of all U.S. adolescents are in optimal health. Furthermore, when a less aggressive threshold of 150 mg/dL or less is used for triglycerides, 20 only 24.2% are considered in optimal health. Hence, less than 25% of U.S. adolescents are metabolically healthy.
The greatest body of literature related to metabolic health in children describes the prevalence of children meeting the criteria for metabolic syndrome. A review of 85 publications found the median overall prevalence of metabolic syndrome was 3.3%; for those classified as overweight or obese, the prevalence was 11.9% and 29.2%, respectively. 9 Previous work has also looked at the prevalence of individual cardiometabolic risks. The Avon Longitudinal Study of Parents and Children (95% white) used a composite health score based on HDL-C, non-HDL cholesterol, BP, and HOMA-IR. 21 Defining optimal cardiometabolic health as having one or less abnormal markers, 62% were in optimal health at 17 years of age. 21 Skinner et al. reported the risks of abnormal HDL-C, systolic and diastolic BP, triglycerides, and glycated hemoglobin to increase with increasing severity of obesity. 22 In a study most similar to ours, Lambert et al. assessed cardiometabolic risk factors across BMI categories in Canadian youth at ages 9, 13, and 16 years by measuring systolic BP, TC, LDL-C, HDL-C, apolipoprotein B, triglycerides, FPG, insulin, and C-reactive protein. 23 Consistent with our findings, the prevalence of cardiometabolic risk factors increased with increasing BMI. In addition, they reported that 46.4% of boys and 42.3% of girls with normal weight had no risk factors, compared to 35.7% for all adolescents in our study. 23
What is not clear is whether the presence of cardiometabolic risk markers augments the risk already present in someone with increased BMI. Data from the Bogalusa Heart Study and the Cardiovascular Risk in Young Finns Study showed that in youth, BMI was just as good as metabolic syndrome for predicting metabolic syndrome later in adulthood. 24 IR, which may be a key determinant of cardiometabolic risk, 25 is preceded by childhood obesity. 26 In addition, data using NHANES showed that in teenagers with normal fasting glucose, increased BMI was the best predictor of IR. 27 According to our research, we found a consistent trend in cardiometabolic risk factors and BMI, with 1.5, 3.6, and 5.0 risk factors present in normal-weight, overweight, and obese adolescents, respectively. Regardless of the presence of other risk factors, it is clear that an increased BMI has significant ramifications to cardiometabolic health.
In the setting of normal BMI in children or adolescents, the importance of cardiometabolic risk markers is not well elucidated. 28,29 In adults, cardiovascular morbidity is increased in those who have normal weight, but are metabolically unhealthy. 30 A recent NHANES study using the 5-component model of metabolic syndrome found that 68.9% of normal-weight adults were metabolically unhealthy. 4 Similarly, using our 11-component model, we found that 64.3% of children without increased BMI were metabolically unhealthy. In children, while direct cardiovascular morbidity data are lacking, autopsy studies in those who have died from non-cardiovascular causes have shown that cardiovascular risk markers can be associated with subclinical atherosclerosis independent of BMI. 31,32 Furthermore, numerous studies have shown that the presence of cardiovascular risk markers in youth can be associated with subclinical atherosclerosis in adulthood. 33
Due to the increased number of metabolically unhealthy children with a normal BMI, it was of interest to the authors to measure the prevalence of metabolically healthy children with an increased BMI. In a study of 181 children, 21.5% with an increased BMI were considered metabolically healthy when using lipids, BP, glucose, and IR. 34 In the 2012 NHANES National Youth Fitness Survey, the percentage of youth 12–15 years of age who had adequate levels of cardiorespiratory fitness was 29.9% (overweight) and 20.0% (obese). 35 Our study showed that 15.6% of adolescents who were overweight were considered optimally healthy when using the recommended variables of risk other than BMI and WC. In subjects who were obese, this decreased to only 7.2%. Data from the Bogalusa Heart Study showed that children who were identified as metabolically healthy, but overweight/obese, were likely to retain metabolically healthy status into adulthood and have a cardiometabolic profile similar to children who were of a normal weight. 36 However, subclinical atherosclerosis is increased in obese children regardless of their metabolic status. 37 In adults, cardiovascular morbidity is increased in those who have a normal weight, but are metabolically unhealthy. 38 This information further highlights the adverse effects of an elevated BMI on cardiometabolic health.
We found that those with a family income in the upper stratum were more likely to have optimal metabolic health than those in the lowest stratum. Others have shown that the prevalence of obesity in adolescents has stabilized in high-income families, but not in low-income families. 39,40 In addition, when measuring cardiometabolic dysfunction scores based on glycosylated hemoglobin, BP, HDL-C, and WC, adolescents who lived in the highest poverty areas were more likely to have worse scores than those living in the lowest poverty areas. 41 However, we observed no demographic characteristic (age, gender, or race/ethnicity) or combination that was a significant predictor of metabolic health. These and other studies underscore the socioeconomic disparities that exist for metabolic health.
There are several important limitations to our study. We recognize that defining optimal metabolic health as having normal levels of all risk factors is arbitrary, and with increasing markers used, the likelihood of being found in optimal metabolic health decreases. However, we did not find a significant difference if we used 7 or 11 factors to define metabolic health, so our estimation of less than 25% of U.S. adolescents as being metabolically healthy is likely reasonable. The precise cutoff point at which cardiovascular risk begins is unknown, and for some measures, it may not be agreed upon which threshold should be used or if percentiles are preferable to absolute values. Also, consensus is lacking regarding which factors should be routinely monitored, for example, we did not include apolipoprotein B or A-1. Our approach was to use only those factors that were generally agreed upon by major societal recommendations. In addition, there is concern that that not all risk factors should be equally weighted when assessing metabolic health. While a weighted scalar assessment of overall metabolic health would be of value, there is little consensus in primacy among the measures. Furthermore, determining appropriate weights and a cut point for optimal metabolic health on a cardiometabolic fitness index score is beyond the scope of this project.
Other limitations included the inability to exclude pregnancy as it was not publicly available for females younger than 20 years. Similarly, data limitations precluded assessment of influences due to diet and physical activity. Pubertal stage, which may have affected various markers, for example, insulin resistance, was not considered. Markers of inflammation, for example, C-reactive protein, a potentially important marker of metabolic health, were not evaluated. We also did not control for prescriptions used for nonmetabolic conditions, which could have adversely affected metabolic markers. Although we measured traditional cardiometabolic risk factors, we did not consider other medical conditions that can increase the risk for future cardiovascular disease, for example, chronic renal disease or chronic inflammatory conditions. All these would have decreased the prevalence of metabolically healthy adolescents. Finally, we were not able to assess for measures of body fat, particularly visceral fat. This would have been helpful to better characterize those who had normal BMI, but were metabolically unhealthy or had increased BMI, but were otherwise metabolically healthy.
Conclusion
Based on currently established thresholds for pediatric cardiometabolic risk markers, the prevalence of optimal metabolic health in U.S. adolescents is less than 25%. Even among those who are not overweight or obese, only approximately one-third would be considered metabolically healthy. Family income is an independent predictor of metabolic health, suggesting a socioeconomic impact. These findings have significant implications for future cardiovascular risk and underscore the need for a comprehensive metabolic approach that includes, but is not limited to, weight control.
Footnotes
Acknowledgment
The authors acknowledge the invaluable work of Ms. Lindy Hall with the Womack Army Medical Center Medical Library and Learning Resource Center.
Author Disclosure Statement
The views expressed herein are those of the authors and do not necessarily reflect the official policy of the Department of Defense, Defense Health Agency, Department of Army, or the U.S. Government. No competing financial interests exist.
Funding Information
No funding was received for this article.
Supplementary Material
Supplementary eTable 1
Supplementary eTable 2
References
Supplementary Material
Please find the following supplemental material available below.
For Open Access articles published under a Creative Commons License, all supplemental material carries the same license as the article it is associated with.
For non-Open Access articles published, all supplemental material carries a non-exclusive license, and permission requests for re-use of supplemental material or any part of supplemental material shall be sent directly to the copyright owner as specified in the copyright notice associated with the article.