
Abstract
Background:
The triglyceride glucose (TyG) index has been proposed as a reliable surrogate marker for nonalcoholic fatty liver disease (NAFLD). Furthermore, NAFLD is strongly related with obesity. This study aimed to compare TyG index and its related parameters (TyG-waist circumference [WC] and TyG-body mass index [BMI]), comprising TyG and obesity markers, in predicting NAFLD and liver fibrosis in overweight/obese individuals without diabetes.
Methods:
This was a cross-sectional study consisting of 184 overweight/obese people (96 with and 88 without NAFLD), 30–65 years of age. TyG, TyG-BMI, and TyG-WC were computed using the established formula. Liver stiffness measurement (LSM) and controlled attenuation parameter (CAP) were determined by transient elastography (FibroScan).
Results:
In correlation analyses, CAP and LSM were significantly associated with WC, BMI, TyG, TyG-BMI, and TyG-WC. Regression analyses highlighted TyG-WC as a significant predictor of NAFLD, with the highest standardized odds ratio (2.25, P < 0.001); while liver fibrosis was associated more strongly with TyG-BMI. In receiver operating characteristic (ROC) analysis, TyG-WC showed the largest area under the ROC curve (AUC) for detection of NAFLD (0.693, 95% confidence interval [CI]: 0.617–0.769). However, TyG-BMI was a better discriminator of liver fibrosis (AUC: 0.635, 95% CI: 0.554–0.714). TyG-WC value of 876 (sensitivity: 81.3%, specificity: 52.3%) and TyG-BMI value of 259 (sensitivity: 78.3%, specificity: 51.3%) were the optimal cutoff points to predict NAFLD and liver fibrosis, respectively.
Conclusions:
The results highlight the significant associations of TyG and its related indices with NAFLD, with TyG-WC being a better indicator. TyG-BMI and TyG-WC could reliably predict liver fibrosis in this population. These indices appear to be simple, practical, and affordable tools for screening NAFLD and liver fibrosis in clinical settings.
Introduction
Nonalcoholic fatty liver disease (NAFLD) is the most common cause of chronic liver disease worldwide, comprising a spectrum of liver diseases from simple steatosis to liver fibrosis and cirrhosis. 1 NAFLD was estimated to affect 20%–30% of the world population in 2013, 2 whereas its incidence is rapidly rising mainly due to an increase in obesity. 3 Moreover, it is closely associated with type 2 diabetes mellitus, hypertension, insulin resistance, dyslipidemia, and increased risk of cardiovascular disease. 1,4,5 Despite these facts, most of the patients with NAFLD are asymptomatic, 6 emphasizing the need to explore an effective tool for prediction and early diagnosis of fatty liver.
NAFLD is considered as the hepatic manifestation of metabolic syndrome, and the two main components of metabolic syndrome, including high triglyceride (TG) and fasting plasma glucose (FPG), play key roles in the development of fatty liver. 7,8 The triglyceride glucose (TyG) index, a product of fasting blood glucose and triglyceride, was first introduced as a reliable surrogate marker for insulin resistance. 9 Subsequent investigations, however, highlighted that TyG index could also be an effective indicator for screening individuals at risk of NAFLD, 10 –12 with a predictive power stronger than HOMA-IR (homeostasis model assessment insulin resistance). 13 More recently, there is evidence showing that given the close relationship between insulin resistance and obesity, the TyG-related parameters comprising both TyG and anthropometric indices of obesity (e.g., TyG-body mass index [BMI], TyG-waist circumference [WC]) are superior to TyG alone for predicting insulin resistance. 14 However, despite the known association between NAFLD and obesity, 3,5 there have been limited studies assessing the predictive power of these parameters with respect to NAFLD. 15,16 Furthermore, to the best of our knowledge, there has been no previous published study evaluating the associations of these indices with liver fibrosis. Therefore, this study aimed to compare TyG index and its related parameters (TyG-WC and TyG-BMI) for the prediction of NAFLD and liver fibrosis in overweight/obese individuals without diabetes.
Methods
Subjects and study design
This was a cross-sectional study consisting of a total of 184 adult participants with BMI ≥25 kg/m2 and aged 30–65 years. Individuals with type 2 diabetes, any known active or chronic liver disease (including autoimmune hepatitis, viral hepatitis, primary biliary cirrhosis, primary sclerosing cholangitis, or drug-induced hepatitis), or excessive alcohol consumption (>20 g/day), as well as women who were pregnant or breast feeding were excluded. The current study was carried out under Helsinki Declaration and approved by the Ethics Committee of Iran University of Medical Sciences (approval number: IR.IUMS.REC.1398.1108).
Clinical measurements
Weight and height were measured to the nearest 0.1 cm and 0.1 kg using a wall-mounted stadiometer and OMRON BF511 body composition monitor, respectively. BMI was then calculated as the body weight (kg) divided by the square of body height (m2). WC was measured midway between the lowest ribs and the iliac crest using a nonelastic tape. Fasting blood samples were collected through venipuncture into the vacutainer tubes. Aliquots of separated plasma and serum were then stored at −80°C until analyzing. Liver stiffness measurement (LSM) and controlled attenuation parameter (CAP) were determined by transient elastography (TE) using the FibroScan®. A CAP value ≥288 dB/m and LSM value ≥5.9 kPa were considered as having NAFLD and liver fibrosis, respectively. 17,18
Laboratory measurements
Blood glucose levels were measured using the enzymatic colorimetric method. Enzymatic assays were also used to determine the levels of serum triglyceride, total cholesterol, and high-density lipoprotein (HDL) cholesterol. All these analyses were performed using the Pars Azmun Diagnostic Kits (Pars Azmun Co., Tehran, Iran) with a between- and within-run coefficient of variation <6.2%. Low-density lipoprotein (LDL) cholesterol was calculated using a modified version of Friedewald equation. 19 Serum insulin was determined with ECLIA method using the Roche Diagnostics Kits (Roche Cobas 6000 analyzer). HOMA-IR was calculated as fasting glucose (mg/dL) × fasting insulin (μU/mL)/405. TyG index was computed using the formula: Ln [TG (mg/dL) × fasting glucose (mg/dL)/2]. 9 TyG-WC and TyG-BMI are defined as TyG index × WC and TyG index × BMI, 20 respectively.
Statistical analyses
All data were analyzed using IBM SPSS Statistics for windows (Version 20.0 Released 2011. IBM Corp., Armonk, NY). Demographic and clinical characteristics of participants are presented as mean ± standard deviation or medians with interquartile range (IQR) for skewed data. Between-group comparisons were performed using χ 2 test, independent sample t-test, or nonparametric tests, as appropriate (Table 1). The correlations of CAP score and LSM with other variables were assessed using Spearman's rank-order correlation coefficients (r s), after controlling for age and gender. The associations of CAP score with markers of interest were also explored using regression analyses. For these analyses, CAP score was entered into the separate regression models as: (1) a continuous dependent variable (Table 2) and, (2) a dichotomous dependent variable categorized in terms of the CAP cut off values established for the diagnosis of hepatic steatosis (Table 3). The discriminative power of TyG and related markers were evaluated using the receiver operating characteristic (ROC) curve analysis (Table 4). All tests were two-tailed, and P < 0.05 was considered statistically significant.
Demographic and Clinical Characteristics of Participants for the Presence of Nonalcoholic Fatty Liver Disease
Continuous data are presented as means ± SD or medians with IQR for skewed data; categorical data are presented as number (%); between-group comparisons were performed using χ 2 test, independent sample t-test or nonparametric tests, as appropriate.
ALT, alanine aminotransferase; AST, aspartate aminotransferase; BMI, body mass index; CAP, controlled attenuation parameter; DBP, diastolic blood pressure; HDL, high-density lipoprotein; IQR, interquartile range; LDL, low-density lipoprotein; LSM, liver stiffness measurement; NAFLD, nonalcoholic fatty liver disease; SBP, systolic blood pressure; TG, triglyceride; WC, waist circumference; WHR, waist-to-hip ratio.
Results of the Linear Regression Models Evaluating the Associations of Controlled Attenuation Parameter Score with Triglyceride Glucose Waist Circumference, Triglyceride Glucose Body Mass Index and Their Components
Dependent variable: CAP score
Each parameter was entered as covariate in a separate analysis. Model 1: with no adjustment; Model 2: parameter plus age, gender, waist-to-hip ratio, SBP, DBP, serum cholesterol, ALT, AST, HOMA-IR, statin medication, smoking and physical activity were entered in the model as covariates.
CI, confidence interval; FPG, fasting plasma glucose.
The Results of Logistic Regression Models Evaluating the Association of Triglyceride Glucose Index and Triglyceride Glucose-Related Parameters with Presence of Nonalcoholic Fatty Liver Disease and Liver Fibrosis
Each parameter was entered as covariate in a separate analysis; Model 1: with no adjustment; Model 2: adjusted for age, gender, waist-to-hip ratio, SBP, DBP, serum cholesterol, ALT, AST, HOMA-IR, statin medication, smoking and physical activity.
Calculated by multiplying the unstandardized B weight by the predictor's standard deviation.
Results of the Receiver Operating Characteristic Curve Analyses of Triglyceride Glucose Index and Related Parameters for Predicting Nonalcoholic Fatty Liver Disease and Liver Fibrosis
AUROC, area under the receiver operating characteristic curve; SE, standard error.
Results
To achieve the main objective of this study, data of 184 participants (93 men and 91 women), including 96 participants with and 88 without NAFLD (control group), were analyzed. The demographic and clinical characteristics of participants by the presence of NAFLD are summarized in Table 1. The mean ages of participants in the NAFLD and control groups were 44.4 ± 9.3 and 45.0 ± 8.7 years, respectively. There was no significant difference between two study groups in terms of age, systolic blood pressure, diastolic blood pressure, and HDL-cholesterol. However, participants with NAFLD had significantly higher BMI, WC, FPG, HOMA-IR, total cholesterol, TG, LDL-cholesterol, CAP score, LSM, TyG, TyG-BMI, TyG-WC, alanine aminotransferase (ALT), and aspartate aminotransferase (AST) compared with the normal group (all P values <0.05).
In correlation analyses, CAP score was significantly associated with WC (r s = 0.318, P < 0.001), BMI (r s = 0.312, P < 0.001), FPG (r s = 0.172, P = 0.020), TG (r s = 0.284, P < 0.001), TyG (r s = 0.296, P < 0.001), TyG-BMI (r s = 0.403, P < 0.001), TyG-WC (r s = 0.423, P < 0.001), AST (r s = 0.197, P = 0.008), ALT (r s = 0.309, P < 0.001), and LSM (r s = 0.547, P < 0.001). Similarly, we found significant correlations of LSM with WC (r s = 0.208, P = 0.005), BMI (r s = 0.244, P = 0.001), TyG (r s = 0.168, P = 0.023), TyG-BMI (r s = 0.262, P < 0.001), and TyG-WC (r s = 0.254, P = 0.001).
Subsequent linear regression analyses performed for TyG-WC, TyG-BMI, and their components highlighted TyG-WC as a significant predictor of CAP with the highest standardized coefficient (β = 0.491, P < 0.001), followed by TyG-BMI (β = 0.463, P < 0.001) (Table 2).
The significant association between TyG-WC and the presence of NAFLD was also confirmed by logistic regression analysis showing the highest standardized OR compared with TyG and TyG-BMI, before and after adjustments. However, the presence of fibrosis was associated more strongly with TyG-BMI compared with other indices (Table 3).
Table 4 presents the results of the (ROC) curve analyses of TyG index and related parameters for predicting NAFLD and liver fibrosis. TyG-WC showed the largest area under the ROC curve (AUC) for detection of NAFLD (0.693, 95% confidence interval [CI]: 0.617–0.769, P < 0.001), followed by TyG-index (0.676, 95% CI: 0.598–0.754, P < 0.001) and TyG-BMI (0.675, 95% CI: 0.598–0.752, P < 0.001). However, TyG-BMI (AUC: 0.635, 95% CI: 0.554–0.714, P = 0.002) was a better discriminator of liver fibrosis (Fig. 1), compared with TyG-WC (AUC: 0.618, 95% CI: 0.536–0.700, P = 0.008) and TyG-index (AUC: 0.581, 95% CI: 0.499–0.663, P = 0.07).
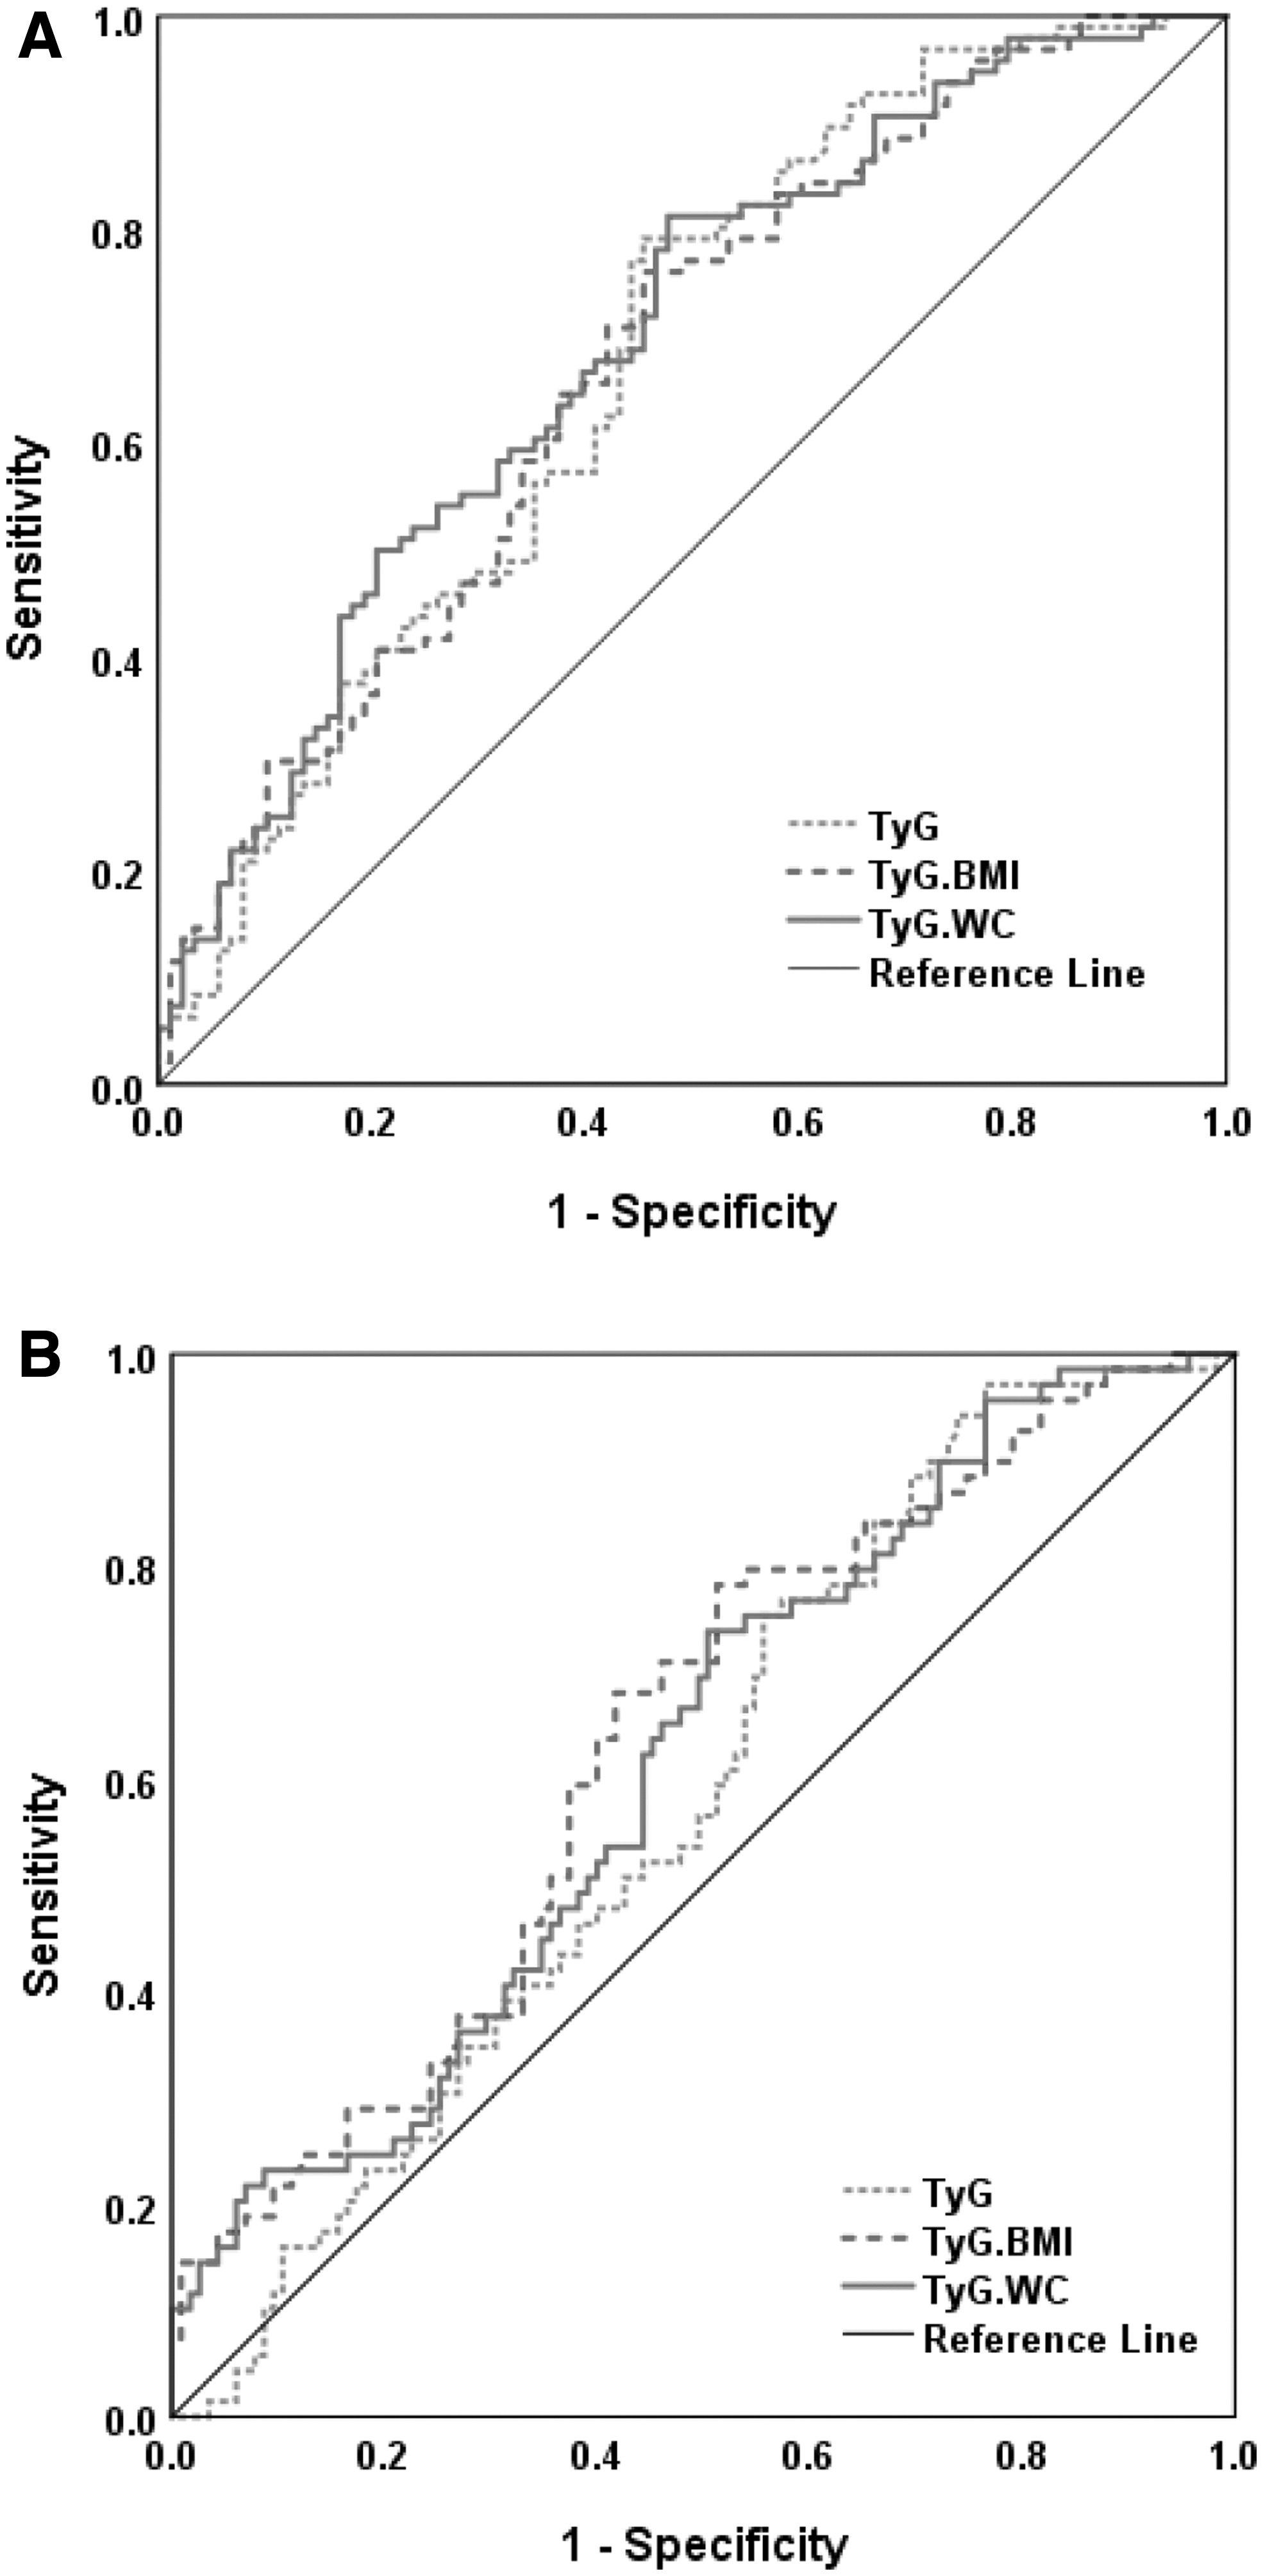
The ROC curve of TyG index and related parameters for prediction of NAFLD
Using ROC analysis, TyG-WC value of 876.17 (sensitivity: 81.3%, specificity: 52.3%, P < 0.001) and TyG-BMI value of 259.12 (sensitivity: 78.3%, specificity: 51.3%, P < 0.001) were the best cutoff points to predict NAFLD and liver fibrosis in overweight/obese individuals without diabetes, respectively.
Discussion
This study demonstrated the significant association of TyG and its related parameters with the presence of NAFLD in overweight/obese individuals without diabetes. These findings are in line with previous studies, showing TyG index as a reliable indicator for screening NAFLD in the general population. 10 –12
A number of indices have been developed for early detection of NAFLD like Fatty Liver Index, SteatoTest, NashTest, Hepatic Steatosis Index, and OXNASH score. 21 –24 However, these are not often used in the clinical setting routinely, mainly because of involving several variables, complexity in calculations, or being costly. 10 After introducing TyG index as a surrogate for identifying insulin resistance, 9 TyG index was also considered as an effective, practical, and affordable tool to identify individuals at risk of hepatic steatosis with a high sensitivity and specificity. 10 Subsequently, several studies confirmed the usefulness of TyG index for fatty liver screening in large healthy populations. 11,12 The predictive ability of TyG-index could be explained by the close relationships of its two key components (TG and FPG) with insulin resistance, which in turn plays a critical role in the development of fatty liver particularly in individuals with obesity. 9,25,26 Another possible explanation may involve glucotoxicity and lipotoxicity mechanisms, contributing to the pathogenesis of NAFLD. 8,13,27
Meanwhile, the present study highlighted TyG-WC as a significant predictor of NAFLD with the highest standardized OR compared with TyG and TyG-BMI. Considering the known association between NAFLD and obesity, 3,5 it has been proposed that the TyG-related parameters combining both TyG and anthropometric indices of obesity could be a more comprehensive predictor of hepatic steatosis compared with TyG alone. In a cross-sectional study, Zhang et al. showed that TyG-BMI was superior to its components, including TG, FBS, BMI, and TyG index to identify NAFLD assessed by ultrasonography in a nonobese Chinese population. 16 Also, the significant association between TyG-BMI and incident fatty liver was demonstrated in a population-based cohort study conducted on Japanese people with a median (IQR) BMI of 21.2 (3.4) kg/m2. 12 However, neither of these two studies evaluated the effectiveness of TyG-WC in identifying NAFLD. To our knowledge, there has been only one published study conducted by Lim, 15 which has considered TyG-WC for NAFLD detection. In agreement with our results, they showed that the AUC for TyG-WC determined in a healthy Korean population was higher than those for TyG and TyG-BMI indices. However, the optimal cutoff point of 697.48 (with an AUC of 0.841) for TyG-WC suggested in the Lim's study was different from that of 876.17 found in the present study. Although, this may be due to the different metabolic status of participants in the two studies, it could be explained by differences in the ethnicities as well. 11 In this context, it should be noted that all previous studies in this field were mainly limited to East Asian people, exhibiting an ethnic-specific body composition. 28 Hence, the generalizability of their results is unclear. Accordingly, the present study investigated the association of TyG-related indices with NAFLD in a different ethnic group, with focus on overweight and obese individuals.
In this study, we showed that both WC and BMI were independently associated with CAP score, with WC which was a better predictor. As mentioned before, the strong correlation between obesity and NAFLD have been demonstrated in several studies. 3,5 However, emerging evidence reveals that the patterns of fat distribution could affect this relationship. 29 In a recent meta-analysis, Pang et al. have explored the independent associations of central and general obesity with NAFLD. 30 They found that, when the indices were expressed as binary variables with nonobese group as reference, the pooled OR in WC was greater than that in BMI [3.14 (95% CI: 2.07–4.77) vs. 2.85 (95% CI: 1.60–5.08)], suggesting that abdominal obesity may induce a greater risk of NAFLD than general obesity. As a result, the parameters incorporating TyG and an index of central obesity (e.g., TyG-WC) could be expected to exhibit a better discriminative ability to predict NAFLD compared with TyG-BMI.
However, we found that liver fibrosis was correlated more strongly with TyG-BMI than TyG and TyG-WC. To our knowledge, there has been no previous published research investigating the associations of TyG-related indices with liver fibrosis. Recently, Kim et al. reported a significant relationship between the TyG index and liver fibrosis assessed by NAFLD fibrosis score in Korean adults. 31 Furthermore, previous studies demonstrated the significant correlations of anthropometric indices of obesity with the presence of liver fibrosis. Namely, in a case-series study by Rocha et al., 32 overweight (BMI ≥25 and ≤29.9 kg/m2) and increased WC were observed in 68% and 41% of patients with hepatic fibrosis diagnosed by liver biopsy. Similarly, in a cross-sectional study conducted in China, BMI and WC were shown as significant predictors of liver fibrosis in obese patients with NAFLD, with AUCs of 0.74 and 0.65 (P values <0.001), respectively. 33 Considering these preliminary findings, the present study is the first to compare the discriminative power of TyG and its related indices with respect to the hepatic fibrosis. Our results indicated that TyG-related parameters comprising both TyG and anthropometric indices of obesity could improve prediction of liver fibrosis in overweight/obese individuals. That is, both TyG-BMI and TyG-WC could reliably predict liver fibrosis in this population, with TyG-BMI showing a relatively larger AUC for detection of liver fibrosis compared with TyG-WC in ROC analysis. Further research is needed to verify these findings.
The strengths of the present study are its novelty and using TE, which is more sensitive and specific than ultrasonography in detecting liver steatosis and fibrosis. 34 The study had also some limitations. The sample size was relatively small, limiting us to examine the associations of TyG and its related parameters with liver steatosis and fibrosis by gender. Besides, this study includes adult individuals with overweight and obesity. Hence, generalizability of the results to nonobese populations may be limited.
TyG-related parameters comprising both TyG and anthropometric indices of obesity (TyG-BMI and TyG-WC) could improve prediction of NAFLD and liver fibrosis in overweight/obese individuals. Since these indices can be simply calculated by the routine laboratory tests and anthropometric measurements, they may be widely used for screening NAFLD and liver fibrosis in clinical settings.
Footnotes
Author Contributions
F.A.-S. and M.E.K. were involved in the conception and design of the study. M.M., H.T., and M.L. were involved in data collection. Data were analyzed and interpreted by F.A.-S. R.A. and F.A.-S. were involved in drafting the article. F.A.-S. is guarantor of this work and takes responsibility of the data analysis. All authors have participated in reviewing the article and approved the final version.
Author Disclosure Statement
No conflicting financial interests exist.
Funding Information
This study was supported by Iran University of Medical Sciences (IUMS) (research project no.: 98-3-24-16273).