
Abstract
Background:
Variations of serum biomarkers and bacterial diversity of the gastrointestinal tract in obese patients with diabetes or hypothyroid are poorly understood. The aim of this study was to provide recent findings in this regard.
Methods:
A total of 119 obese patients [17 with diabetes, 23 with hypothyroid, and 79 patients without either diabetes or hypothyroid (control)] were recruited in this study. Serum biomarkers such as biochemical, hormonal (insulin and glucagon), and cytokine levels [interleukin (IL)-6, IL-1β, tumor necrosis factor-alpha, IL-10, and transforming growth factor beta-1 (TGF-β1)] were measured under fasting conditions. Bacterial abundance of gut microbiota was also quantitated by real-time polymerase chain reaction using 16S rRNA gene-based specific primers.
Results:
Average value of blood sugar (P: 0.0184), hemoglobin A1c, insulin, homeostasis model assessment insulin resistance, TGF-β 1, IL-6, IL-1β, interferon gamma (P for each < 0.001), and phylum Actinobacteria [odds ratio (OR): 1.5, P: 0.032] was significantly higher in diabetic versus control group. In contrast, the levels of IL-10 (P < 0.001), Firmicutes (OR: 0.6, P: 0.058), and Akkermansia muciniphila (OR: 0.4, P: 0.053) were significantly lower in diabetic versus control group. However, there was no statistically significant difference between the values in hypothyroid versus control group either in crude or adjusted models.
Conclusion:
While there are some relationships between serum biomarkers or bacterial abundance with diabetes prediction in obese patients, this prognostication is less likely in obese patients with hypothyroid. Further investigation is warranted in the application of identified preclinical biomarkers in the diagnosis of diabetes or hypothyroid in obese patients.
Introduction
Based on the World Health Organization (WHO) definition, extreme fat accumulation in people with body mass index (BMI) [weight (kg) divided by square of height (meter)] ≥30 is described as obesity. Obesity or overweight can remarkably influence the quality of life in the obese population. 1
Genetic determinants and environmental factors, including an unhealthy and sedentary lifestyle, and high consumption of fattening foods have been attributed to an increased rate of obesity in the world. 2,3
The prevalence of obesity and severe obesity (having a greater risk of health conditions) has alarmingly increased from 1999 to 2018 in the United States. 4 It is projected that 18% of male and 21% of the female population will experience obesity by 2025 worldwide. 5
Severe obesity is implicated in the development of many medical conditions such as cardiovascular diseases, diabetes, hypothyroidism, hypertension, and cancers. 2 Recently, many studies have investigated the concomitance of endocrine disorders such as diabetes mellitus and hypothyroidism in the obese population. 6,7
According to the latest report from the International Diabetes Federation (IDF), the number of people with diabetes is expected to rise from 425 million in 2017 to 600 million with a 366 mortality rate by 2030. 7,8
An insufficient level of thyroid hormones released by the thyroid gland is characterized as hypothyroidism and has been linked with noticeable consequences, including low metabolism rate and increased incidence of obesity. 6,9
The gastrointestinal tract is the natural habitat of a wide variety of bacterial communities in which four main bacterial phylum Firmicutes, Bacteroidetes, Actinobacteria, and Proteobacteria are among the most dominant bacterial population. 10 The human gastrointestinal microbiota, also known as gut microbiota (GM), is estimated to be ∼1013–1014 microbial cells among which Bacteroidetes and Firmicutes account for 90% of the total bacterial species. 3
As a result, the overall well-being of humans has been associated with a healthy and normal GM, which contributes to the maintenance of gastrointestinal function, host metabolism, and immune homeostasis. In contrast, human and animal models have shown that the unbalanced GM has been involved in the development of many human disorders, including metabolic complications such as obesity and diabetes. 3,11
Based on previous investigations, there is a reciprocal interaction between the development of metabolic complications (fluctuation in hormonal and cytokine levels) and GM in obese patients. 7,11,12 However, stool samples from many previous studies were evaluated using the amplicon sequencing of the 16S gene, which does not provide quantitative calculations of bacterial population and, therefore, could possibly hinder efforts to quantitatively evaluate the GM.
To obtain this level of understanding, we evaluated the GM using 16S gene quantitative real-time polymerase chain reaction (qPCR) and serum biomarkers of diabetic and hypothyroid obese patients. Such information can provide clinically valuable information in the diagnosis and improvement of lifestyle and therapeutical approaches in the affected population.
Several factors influence the GM and serum biomarkers for endocrine disorders that are not fully addressed yet, including genetics, lifestyle, diet and medications, pregnancy and delivery pattern, recent surgery, trauma, infection, or serious injury, and so on. 13,14 Many of these factors are interrelated and should be considered in a comprehensive study. So, more research is needed to explore change in these parameters.
Therefore, the aim of this study was to analyze the GM composition and serum biomarkers in adult obese patients diagnosed with diabetes and hypothyroid disorder compared to the control group.
Materials and Methods
Ethics statement
All procedures performed in this study involving human participants were in accordance with the principles of the 1964 Helsinki declaration and its later amendments or comparable ethical standards.
All the participants were thoroughly informed about the study and procedures before signing consent forms. Participants were assured of anonymity and confidentiality.
The Research Ethics Committee of the Pasteur Institute of Iran, Tehran, approved this study (Approval ID: IR.PII. REC.1397.029).
Patient population
In this hospital-based case–control study, 119 obese patients presenting to the Department of Surgery in Shariati Educational Hospital (Tehran, Iran) with a clinical diagnosis of diabetes or hypothyroidism (17 with diabetes, 23 with hypothyroidism, and 79 without either diabetes or hypothyroidism as a control group) who were candidates for laparoscopic sleeve gastrectomy (LSG) enrolled from September 2018 to January 2020.
The inclusion criteria were: (1) age limit from 30 to 50 years; (2) BMI ≥35 kg/m2; (3) without dairy allergy; (4) no infectious disease; (5) no use of antibiotic, probiotic, and medication affecting the findings over the last 6 months before the enrollment; (6) no gastrointestinal disease; and (7) nonpregnant/nonlactating women. Our exclusion criteria include: (1) recent illnesses (i.e., 1 month before the enrollment or less), (2) genetic or psychotic disorders, and (3) psychoactive drug misuse.
In addition, obese control subjects (n = 79) were selected at random among candidates for LSG, and subjects with a current or past diabetic and the hypothyroid syndrome were excluded from the control group.
Collection of clinical data
Each patient was provided with a standardized questionnaire regarding sociodemographic, lifestyle, anthropometric (height, weight, and BMI), medical treatments, and underlying medical history.
Hypothyroidism was diagnosed by a physician according to increased serum thyroid-stimulating hormone level. 9 Diabetes mellitus was diagnosed according to the IDF criteria. 15
Sample collection and DNA extraction
Stool samples were collected in a hermetically sealed sterile container and placed into the freezer immediately at −80°C until DNA extraction. Total bacterial DNA was extracted from feces samples using the QIAamp DNA Stool Mini Kit (QIAGEN, GmbH, Hilden, Germany) following the manufacturer's instructions. DNA purity and quantity were evaluated using a NanoDrop spectrophotometer (BioTek Instruments, Inc., Winooski, VT) and stored at −20°C until processed.
Quantitative real-time polymerase chain reaction
Bacterial abundance of extracted DNA from feces samples was evaluated using quantitative real-time PCR with 16S rRNA gene-based specific primers (Metabion, Germany, Table 1).
Specific Primers Used to Amplify Different Bacterial Groups and Species of Gut Microbiota Based on the 16S Ribosomal RNA Genes
bp, base pair; F, forward; R, reverse.
DNA amplifications were performed in a final volume of 20 μL containing 10 μL 2 × QPCR Green Master Mix HRox (Biotechrabbit GmbH, Hennigsdorf, Germany), 5 μM of each primer, and 2 μL of target DNA.
Amplification reactions were performed in a thermal cycler (StepOne™ Real-Time PCR System, Applied Biosystems) under following conditions: 1 cycle of initial denaturation at 95°C for 3 min, 40 cycles of 95°C for 15 sec, and annealing temperature suitable for each primer pair for 30 sec.
Standard curves were made for each run using 10-fold serial dilutions of known concentration of bacterial genomic DNA (Phylum Proteobacteria) and then the copy number of the 16S rRNA gene for each species calculated using the following equation:
Number of copies = (DNA concentration (ng/μL) × [6.022 × 10²³])/(length of template (bp) × [1 × 109] × 650). In addition, qPCR products were visualized in an agarose gel electrophoresis (Fig. 1).
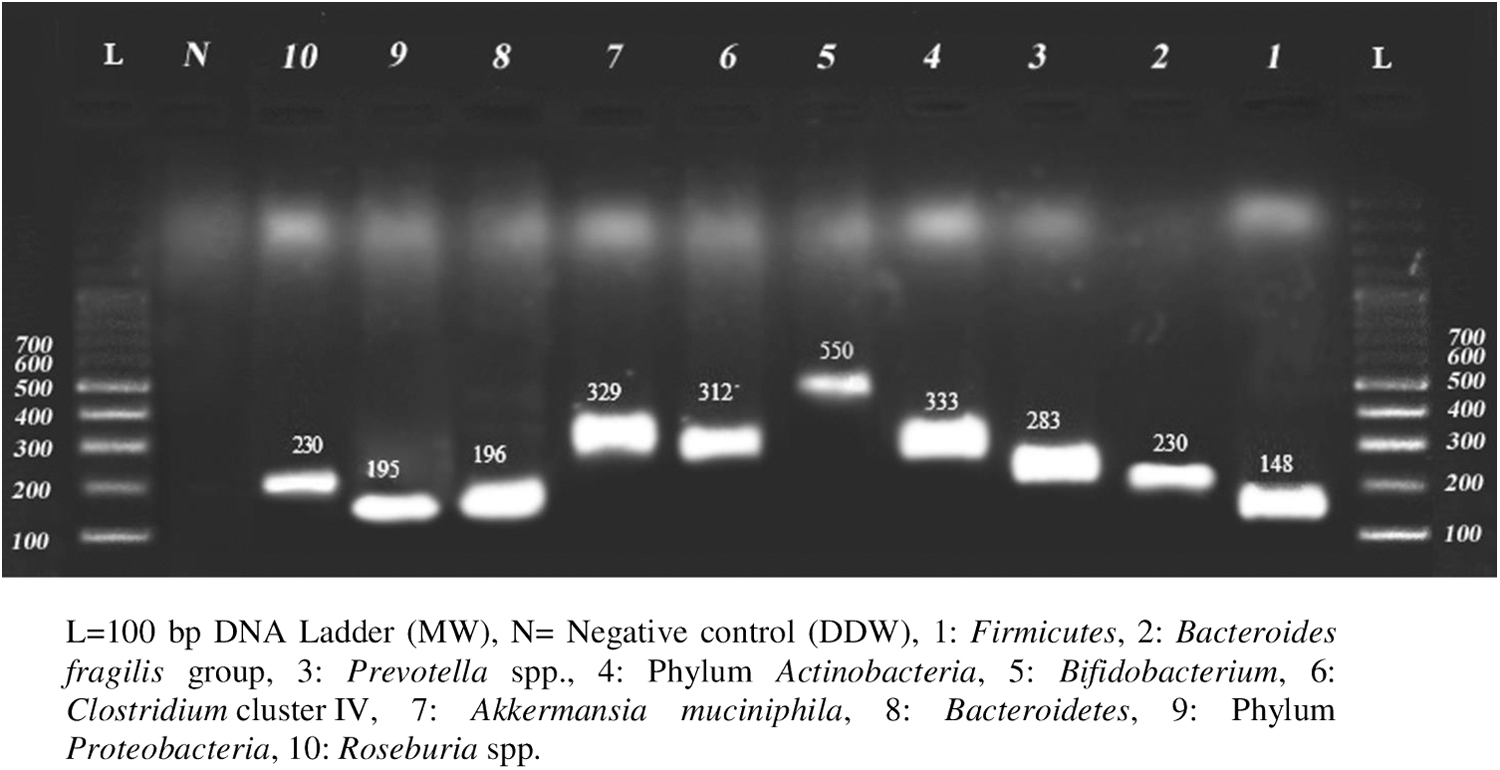
qPCR products of 16S rRNA associated genes in detected bacterial groups and species of gut microbiota. qPCR, quantitative real-time polymerase chain reaction.
Biochemical and cytokine evaluation
Biochemistry and cytokine parameters were detected in fasting peripheral venous blood obtained from patients. Fasting blood sugar (FBS), triglycerides (Tg), low-density lipoprotein, high-density lipoprotein, aspartate aminotransferase (serum glutamate-oxaloacetate transaminase), alanine aminotransferase (serum glutamic-pyruvic transaminase), blood urea nitrogen, creatinine, 10 and alkaline phosphatase were measured by colorimetric enzymatic assays (COBAS MIRA® Plus). In addition, the percentage of glycosylated hemoglobin A1c (% HbA1c) was measured with an immunoturbidimetric assay (Hitachi 917).
Inflammatory cytokines [interleukin (IL)-6, IL-1β, and tumor necrosis factor-alpha], anti-inflammatory cytokines [IL-10 and transforming growth factor beta-1 (TGF-β1)], insulin, and glucagon were analyzed using ELISA Kits (Abcam, Cambridge, UK).
Blood insulin was used to calculate the insulin resistance, as defined by the equation homeostasis model assessment of insulin resistance (HOMA-IR) = fasting insulin (μU/mL) × fasting glucose (mmol/L)/22.5. Each measure was evaluated in duplicate, and the median of the two measurements was reported.
Statistical analysis
Categorical variables were compared between diabetic/hypothyroid obese patients and the control group using Fisher's exact test. To check for normality Kolmogorov–Smirnov test was used. To compare the association between diabetic/hypothyroid obese patients and the control group, the Kruskal–Wallis test was used.
Copy/μL of the Bacteroides fragilis group, Akkermansia muciniphila, Clostridium cluster IV, Roseburia spp., and Prevotella spp. was analyzed in log10 scale. Binary logistic regression analysis was used to estimate the effect of each unit increase in bacterial abundance to the chance of diabetes/hypothyroidism, either in crude and adjusted models. In the adjusted model, best-fitting model was selected using the backward method.
Results
Subject characteristics
In this study, 17 diabetic, 23 hypothyroid, and 79 control group with an average age of 37 ± 6.3 years old were included. In the diabetic group, 13 (76.5%) were females. Patients had a median age of 44 years, with a mean age of 42.5 years (±7.1 years ranging from 32 to 50 years) and BMI mean of 42.6 ± 3.9 kg/m2. In subjects with hypothyroid 19 (82.6%) were female. The median age was 36 years, with mean age of 36.1 years (±4.9 years ranging from 30 to 49 years) and BMI mean of 42.7 ± 6.8 kg/m2 (Table 2).
Demographic, Anthropometric, and Clinical Characteristics of Obese Patients with Diabetes Mellitus or Hypothyroidism and the Control Group a
The control group in this study was selected among nondiabetic and nonhypothyroid obese individuals.
Student's t-test.
Fisher's exact test.
BMI, body mass index; DM, diabetes mellitus; SD, standard deviation.
The mean age group of diabetic patients was significantly higher than the control group (P = 0.0054). This association, however, was not statistically significant in hypothyroid patients (P = 0.7799). There was no significant difference in the distribution of other demographic, anthropometric, and clinical characteristics between diabetes/hypothyroidism and the control group (Table 2).
Biochemical and cytokine analysis
No significant difference between biochemical indices of diabetic/hypothyroid patients and the control group was identified, except for FBS (P = 0.0184), glucagon (P < 0.001), insulin (P < 0.001), HbA1c (P < 0.001), and HOMA-IR (P < 0.001), which were significantly higher in diabetic patients compared to the control group (Table 3).
Biochemical Indices and Cytokines in Obese Patients with Diabetes Mellitus or Hypothyroidism and Control Group a
Data are expressed as mean ± SD.
The control group in this study was selected among nondiabetic and nonhypothyroid obese individuals.
P values are generated using Kruskal–Wallis test.
ALP, alkaline phosphatase; BUN, blood urea nitrogen; Cre, creatinine; FBS, fasting blood sugar; HbA1c, hemoglobin A1c; HDL, high-density lipoprotein; HOMA-IR, Homeostatic Model Assessment of Insulin Resistance; IFNγ, interferon gamma; IL-1β, interleukin-1β; IL-6, interleukin 6; IL-10, interleukin 10; Tg, triglycerides; LDL, low-density lipoprotein; SGOT, serum glutamate-oxaloacetate transaminase; SGPT, serum glutamic-pyruvic transaminase; TGF-β1, transforming growth factor beta-1.
The mean value of TGF-β 1, IL-6, IL-1β, and interferon gamma (IFNγ) was significantly higher in diabetic obese patients compared to the control group (P < 0.001). Moreover, opposite result was observed for IL-10 where its mean value was significantly lower in diabetic patients compared to the control group (P < 0.001). None of the cytokines showed a significant difference between hypothyroid and the control group (Table 3).
Fecal microbiota analysis
In diabetic patients, the mean value of phylum Actinobacteria, Firmicutes, and A. muciniphila was significantly different compared to the control group; however, none of the investigated bacterial communities showed significant increase/decrease in hypothyroid patients compared to the control group (Table 4).
Crude and Adjusted Odds Ratio of the Association Between Gut Microbiota and Risk of Diabetes Mellitus or Hypothyroidism in Obese Patients
CI, confidence interval; F/B ratio, Firmicutes to Bacteroidetes ratio; OR, odds ratio.
The crude logistic analysis showed that each unit increase in the concentration of phylum Actinobacteria is associated with a 1.5-fold increased chance of being diabetic compared to the control group (P = 0.032). Adjustment for the confounding effect of blood sugar and other bacterial population increased the strength of this association by up to 2.4-folds. Other bacterial populations showed a slight protective effect against diabetes in a way that their mean concentration was higher in nondiabetic versus diabetic patients. However, this association was only significant for the effect of Firmicutes (P = 0.058) and A. muciniphila (P = 0.053).
Adjustment for confounding variables also did not change the direction of these associations (Table 4). An increased concentration of the phylum Actinobacteria was also associated with an increased chance of hypothyroidism compared to the control group. This association was not statistically significant either in crude or adjusted models. Other bacterial species also did not show significant effect on the likelihood of hypothyroidism, either in crude or adjusted models (Table 4).
Correlations of gut microbial composition with biomarkers
Significant associations between nine microbial phylum and species and various biomarkers in obese individuals are illustrated in Supplementary Table S1. Correlation analysis showed that BMI was positively associated with Firmicutes, Prevotella spp., and B. fragilis group (P < 0.01 for all). Conversely, BMI negatively correlated with Bifidobacterium, Bacteroidetes, (P < 0.01 for all), as well as with A. muciniphila and Roseburia spp. (0.01 < P < 0.05).
Surprisingly, we found that the levels of A. muciniphila were strongly and negatively correlated with the BMI, glucose and lipid markers, liver function tests, glucagon, insulin, HOMA-IR, and pro-inflammatory cytokines. We also observed that seven microbial phylum and species were associated with IL-10, except for Actinobacteria and B. fragilis. These findings provide insights into the role played by metabolic disorders in the development of GM dysbiosis.
Discussion
In recent years, many studies have begun to support the notion that GM and biomarkers are tightly linked to metabolic diseases. 7,11,13 In the present study, a group of obese patients diagnosed with diabetes and hypothyroid disorders have been investigated. The abundance of bacterial communities in the gastrointestinal tract (GM) and the possible correlation between major serum biomarkers and the development of these disorders have been evaluated.
Based on previous reports, adults are more likely to face debilitating consequences of obesity such as diabetes, hypertension, and chronic pains. 20 More importantly, being older, overweight, and more sedentary can make seniors more susceptible to complications of diabetes. Our initial investigation has also shown a significant difference between the age of diabetic patients and the control population (P < 0.05). Based on our findings, diabetic patients tended to be older than the control population, which may imply the high vulnerability of people to medical conditions as they aged and the riskier lifestyle in this group (Table 2).
This study revealed that the presence of a chronic disease such as diabetes increases the concentration of some biochemical parameters and accentuates the presence of pro-inflammatory cytokines and decreases IL-10, a regulatory cytokine, confirming the presence of the chronic inflammatory process, likely accentuated in patients with diabetes.
Our findings showed a significant increase of glucagon, FBS, insulin, HbA1c, and HOMA-IR in obese diabetic patients compared to the control group (P < 0.05). Consistent with our results, diabetes can lead to a heterogeneous group of cellular and hormonal abnormalities, including cell metabolic dysregulation, hyperglycemia, lipid abnormalities, and other hormonal deficiencies. 21
In addition, we have observed increased levels of IFNγ, TGF-β 1, IL-6, and IL-1β in diabetic obese patients compared to the control group (P < 0.05), which may serve as a potential predictor in the development of metabolic disorders and their resultant complications in obese patients. Several studies have shown the increased levels of cytokines as a result of metabolic disorders in patients, which were consistent with our findings. 22 –25
In addition, it has been reported that increased serum concentrations of IFNγ can influence the insulin sensitivity in diabetic patients. 26 In contrast, a significant reduction was observed in the serum level of IL-10 in obese patients diagnosed with diabetes compared to the control group (P < 0.05). Previous investigations have also shown the association of IL-10 reduction with type 2 diabetes mellitus. 27,28 However, some studies showed varying results in which obese subjects experienced a higher concentration of serum IL-10 compared to healthy individuals. 29 We found some correlations between IL-10 and seven microbial phylum and species (Supplementary Table S1). Overall, IL-10 is a pleiotropic anti-inflammatory cytokine involved in the maintenance of immune tolerance in the gut and prevents inflammatory responses. 30 Several studies have indicated that the GM plays a crucial role in the regulation of IL-10 produced by various immune cell types in the colon. 28 –30
Under normal circumstances, the GM is relatively stable over time and largely dominated by obligate anaerobic bacteria. 31 This study revealed the intestinal microbiota dysbiosis of obese patients and how it was accentuated in the presence of cardiometabolic diseases such as diabetes.
Our results showed dramatic shifts in community structures and composition of GM in obese patients suffering from the underlying diseases. Quantitative evaluation of GM showed that the abundance of the phylum Actinobacteria, Firmicutes, and A. muciniphila was significantly different in diabetic obese patients compared to the control group, which might be due to different reasons, including consumption of medicines, varying geographical regions, lifestyle, and other impacting factors (Table 4).
The intestinal qPCR analysis revealed an increased abundance of Actinobacteria in the hypothyroid group compared to the control group. Although this association was not statistically significant, these findings suggested the highlighting influence of the GM on the development of thyroid disorders through modulating the immune system and host metabolism. 32
We have also observed a direct correlation between the increased abundance of Actinobacteria and the higher likelihood of diabetes in obese patients, which was in agreement with previous findings conducted by Turnbaugh et al. 33 The abundance rate of A. muciniphila has been previously linked with reduced obesity and insulin resistance, as well as improved glucose homeostasis in obese patients, which was consistent with our findings (Supplementary Table S1). 34,35
Firmicutes and A. muciniphila showed a protective effect against diabetes, in a way that the decrease in the concentration of these bacteria was associated with an increased chance of being diabetic (Table 4). In this respect, some studies have pointed to a close relationship between the composition of intestinal microbiota and diabetes. 36 In agreement with our findings, a study shows that A. muciniphila has the ability to reduce obesity and improve glucose intolerance and insulin resistance in diabetic patients. 34 Finally, although the correlation of GM alterations and biomarkers in chronic metabolic diseases has been discussed, the consequences or causes of these bacterial changes are still unknown.
In conclusion, serum biomarkers and significantly changed bacterial communities identified in this study may be potential targets in the diagnosis, prevention, and treatment of diabetes or hypothyroid in obese patients. Although this study helped to form the basis of our current understanding of the distribution of microbiota and serum biomarkers in obese patients with endocrine disorders, we posit that a more comprehensive investigation would be beneficial for obtaining a higher resolution picture of variations in the composition of GM over time and its influence on patient's life-sustaining metabolism and development of underlying medical conditions.
Availability of Data and Materials
All data generated or analyzed in this study are included in the present article.
Footnotes
Acknowledgments
Each listed author is submitting the article in their own personal professional capacity and are not employees for an U.S.-sanctioned government.
This article was part of the project conducted by Mohsen Tabasi to fulfill the requirement for a PhD degree. The authors express their gratitude to the Pasteur Institute of Iran and Legal Medicine Research Center for providing financial support. The authors also express our appreciation to Dr. Nader Shahrokhi, Dr. Sara Ahmadi Badi, Mr. Milad Kheirvari, Mr. Mohammad Reza Yazdannasab, and staff in Shariati Hospital of Tehran, Iran for their technical assistance.
Authors' Contributions
M.T. and S.E. design the study and data analysis. F.S.H, S.D.S., G.M., and F.E. for data collecting and writing article and investigation, writing-review, and editing. A.R.S. and S.B. conceptualization, investigation, formal analysis, writing-review, and editing. All coauthors commented on the article. All authors read and approved the final article.
Author Disclosure Statement
No conflicting financial interests exist.
Funding Information
This project was financially supported by the Pasteur Institute of Iran (grant no. TP-9567).
Supplementary Material
Supplementary Table S1
References
Supplementary Material
Please find the following supplemental material available below.
For Open Access articles published under a Creative Commons License, all supplemental material carries the same license as the article it is associated with.
For non-Open Access articles published, all supplemental material carries a non-exclusive license, and permission requests for re-use of supplemental material or any part of supplemental material shall be sent directly to the copyright owner as specified in the copyright notice associated with the article.