
Abstract
Background:
Certain inflammatory biomarkers, such as interleukin-6, interleukin-1, C-reactive protein (CRP), and fibrinogen, are prototypical acute-phase parameters that can also be predictors of cardiovascular disease. However, this inflammatory response can also be linked to the development of type 2 diabetes mellitus (T2DM).
Methods:
We performed a cross-sectional, retrospective study of hypertensive patients in an outpatient setting. Demographic, clinical, and laboratory parameters, such as the Homeostatic Model Assessment of Insulin Resistance (HOMA-IR), CRP, and fibrinogen, were recorded. The outcome was progression to overt T2DM over the 12-year observation period.
Results:
A total of 3,472 hypertensive patients were screened, but 1,576 individuals without T2DM were ultimately included in the analyses. Patients with elevated fibrinogen, CRP, and insulin resistance had a significantly greater incidence of progression to T2DM. During follow-up, 199 patients progressed to T2DM. Multivariate logistic regression analyses showed that body mass index [odds ratio (OR) 1.04, 95% confidence interval (CI): 1.01–1.07], HOMA-IR (OR 1.13, 95% CI: 1.08–1.16), age (OR 1.05, 95% CI: 1.03–1.07), log(CRP) (OR 1.37, 95% CI: 1.14–1.55), and fibrinogen (OR 1.44, 95% CI: 1.23–1.66) were the most important predictors of progression to T2DM. The area under the receiver operating characteristic curve (AUC) of this model was 0.76. Using machine learning methods, we built a model that included HOMA-IR, fibrinogen, and log(CRP) that was more accurate than the logistic regression model, with an AUC of 0.9.
Conclusion:
Our results suggest that inflammatory biomarkers and HOMA-IR have a strong prognostic value in predicting progression to T2DM. Machine learning methods can provide more accurate results to better understand the implications of these features in terms of progression to T2DM. A successful therapeutic approach based on these features can avoid progression to T2DM and thus improve long-term survival.
Introduction
Type 2
The classic biomarkers of acute inflammation in humans are C-reactive protein (CRP) and fibrinogen. Although cytokines, adhesion molecules, and growth factors are involved in inflammatory processes, these mediators increase plasma concentrations of both CRP and fibrinogen, which can amplify the inflammatory response. Interleukin-6 (IL-6) is the main cytokine involved in this amplification process. 2 Other cytokines, including interleukin-1 (IL-1) and tumor necrosis factor (TNF), have important roles in these processes as well.
Of these biomarkers, high-sensitivity CRP (hs-CRP) and fibrinogen are reliable, have well-standardized assays, and are widely available in almost any clinical setting. 3 Thus, they can be measured and used to assess inflammation at any time. 4 –6
Regarding hs-CRP and metabolic syndrome, the former is a reliable biomarker of cardiovascular risk because of its role in underlying systemic inflammation. CRP levels can increase as a result of infection or trauma, but its role in cardiovascular risk and metabolic syndrome has been highlighted in asymptomatic individuals when plasma levels remain in the high-normal range for a long period without any identifiable cause. 2,6 Metabolic syndrome is characterized by abdominal obesity, hypertriglyceridemia, elevated blood pressure (BP), and insulin resistance. These features have been linked to elevated plasma levels of CRP. 7 Low-grade inflammation, determined with CRP, is also associated with metabolic syndrome, regardless of infection. 8 Because CRP is also implicated in the development of T2DM through the sharing of common inflammatory processes with cardiovascular risk and atherosclerosis, 4 these findings suggest the importance of biomarkers of acute inflammation in the development of cardiovascular disease and T2DM and thus can be considered a therapeutic target in the future.
Our aim in this study was to evaluate the role of abnormalities such as body mass index (BMI), elevated FPG, decreased insulin response to glucose and low-grade inflammation biomarkers in the deterioration of beta cell function linked to progression to T2DM, as improved understanding may enable physicians to better manage patients to avoid this progression. We thus compared individuals without T2DM who progressed to T2DM (progressors) and individuals who did not (nonprogressors). A further objective was to use machine learning to determine the relationships between inflammatory biomarkers and progression to T2DM.
Methods
Study design and patient selection
We conducted a retrospective, observational, and longitudinal cohort study of patients seen in our hypertension unit between 2005 and 2018. All patients were hypertensive, and some met criteria for a diagnosis of diabetes at baseline. Participants were referred by their general practitioners to our unit. After the first visit, they were followed at 6-month intervals in an outpatient setting. We collected data retrospectively from electronic health records and recorded demographic, clinical, and laboratory data at baseline (i.e., the first time patients were seen in our unit).
Variables and outcome
Demographic and clinical characteristics, such as age, sex, BMI, and BP, were recorded. We also recorded several laboratory parameters: uric acid, cholesterol [high-density lipoprotein cholesterol (HDL-C) and low-density lipoprotein cholesterol (LDL-C)], triglycerides, and ferritin. Glycemic status and insulin resistance were assessed with FPG, HbA1c, blood insulin, and the Homeostatic Model Assessment of Insulin Resistance (HOMA-IR). HOMA-IR estimates insulin resistance using the following formula: fasting insulin (mU/L) × FPG (mg/dL)/22.5.
Hypertension was defined as systolic BP above 139 mmHg and/or diastolic blood pressure (DBP) above 89 mmHg as measured using an Omron HEM-907 device (Omron Healthcare, Bannockburn, IL). Patients who were on antihypertensive drugs were also considered to be hypertensive. Brachial BP was determined at the office as the mean of three measurements taken at 1 min intervals while the patient was seated. Renal function was determined with urine albumin-to-creatinine ratio (ACR), serum levels of creatinine at baseline, and creatinine-based glomerular filtration rate, which was calculated using Chronic Kidney Disease Epidemiology Collaboration (CKD-EPI) equations. 9 Albuminuria was defined as ACR >30 mg/gram. Inflammatory biomarkers were hs-CRP and fibrinogen. Laboratory parameters were determined in a Cobas 8000 e602 analyzer (Roche Diagnostics, Mannheim, Germany).
The primary outcome was progression to T2DM. During the observation period, some patients progressed to T2DM, whereas others did not. A diagnosis of T2DM was based on criteria established by the American Diabetes Association: FPG levels >126 mg/dL (7.0 mmol/L) or HbA1c >6.5% (>48 mmol/mol). 1 All patients diagnosed with diabetes mellitus (either type 1 or type 2) at the beginning of the observation period were excluded from the study.
Standard statistical analyses
For descriptive and univariate correlation analyses, we used the Shapiro–Wilk test to assess the shape of the distribution of the continuous variables and to compute mean ± standard deviations or medians (interquartile ranges). Categorical variables are reported as percentages. Given the binary outcome variable (progression to T2DM), the chi-squared test was used for categorical variables (only sex) and the Mann–Whitney–Wilcoxon test was used for continuous variables (all other variables). Multivariate logistic regression analyses were performed to compute odds ratios (ORs).
Machine learning algorithms, preprocessing, and feature engineering
We performed feature engineering to add new variables obtained from those features present in the data set, as coming up with new informative variables might be useful for understanding the relationships among variables and getting more insight into the data. We did not want to add more noise to the data set, so we replaced some variables with transformed ones. As mentioned before, we used the Shapiro–Wilk test to check the distribution of the variables, not just to properly compute means and medians but because some univariate and multivariate tests require that residuals be normally distributed and homoscedastic. That is, to ensure that the relationships between independent variables and the outcome are approximately linear, the former should be approximately normal in distribution, and some variables should be transformed to better meet these assumptions. We noticed that fibrinogen was normally distributed, but hs-CRP was heavily skewed to the left, and including hs-CRP in the model led to unstable estimates. We thus decided to use a base-10 logarithm for hs-CRP, that is, log(hs-CRP), because it significantly improved the model.
As mentioned before, we used standard logistic regression, as this is the most common approach to multivariate analysis in the biomedical literature. However, given the number of variables to analyze and the likely nonlinear relationships between them, we also used an artificial intelligence approach that involved several machine learning algorithms. Machine learning has proved useful for gaining insight into the development of diabetes and characterizing metabolic syndrome in several scenarios. 10 –12 Our aim was to gain insight into the development of T2DM by revealing relationships between our variables and progression to T2DM. We did this both by developing an accurate predictive model and by choosing the most relevant variables that play an important role in the progression to T2DM.
The first step in our machine learning approach was to address the classification problem. After performing exploratory, univariate, and multivariate analyses, we applied some machine learning algorithms to our data set using the caret 13 package in R. Since we did not know which algorithm would perform best, we used a simple linear algorithm [linear discriminant analysis (LDA)], two nonlinear decision tree-based algorithms [random forest (RF) and classification and regression trees (CART)], and two complex nonlinear algorithms [support vector machines (SVM) and K-nearest neighbors (KNN)]. 14 –16 A further explanation of each algorithm is beyond the scope of this work, but the interested reader can consult Hastie et al.. 17
As part of the preprocessing step, before we passed the data into the proposed algorithms, we checked the data set for missing values and scaled and centered the data through z-score transformation. No data imputation was needed. Also, we addressed class imbalance, as the use of imbalanced data sets may result in biased or inaccurate predictions. 18,19 Imbalanced data reflect a classification problem in which there are unequal instances of different classes (in our study, progressors vs. nonprogressors). Having imbalanced data is actually very common in health research, because there are usually more healthy controls than disease cases. Most machine learning classification algorithms are sensitive to class imbalance and can produce overfitting and overly optimistic results. Methods of dealing with imbalanced data include undersampling, oversampling, and cost-sensitive learning (CSL). Undersampling works by removing observations but can result in a loss of important information. Oversampling, in contrast, does not lead to information loss, but because it adds duplicated observations to the original data set, it leads to overfitting. We ultimately chose CSL, 20 as it evaluates the cost associated with misclassifying observations. CSL does not create a new balanced data distribution. Instead, it produces cost matrices that describe the cost of misclassification in a classification task. Research has shown that CSL can outperform sampling methods and therefore is a more accurate alternative to sampling methods. 21 –23
Our second step in our machine learning approach was to perform feature selection. Data sets may have correlated data or variables that add noise to the final result. In such cases, irrelevant variables should be removed. Since we used the caret package in R, we used two methods of feature selection: ranking of features by importance (we took advantage of the fact that tree-based methods have a built-in mechanism for reporting the importance of variables) and recursive feature elimination (RFE; many models are built with different subsets of a data set to identify those attributes that are required to build an accurate model).
The train function from the caret package was used for model building and to evaluate, using resampling, the effect of model tuning parameters on performance. Therefore, the specified algorithms chose the more accurate model across these parameters, and estimated model performance from our training set. We used repeated 10-fold crossvalidation as a resampling method. After this process, a profile of performance metrics was provided, along with tuning parameter values that should be chosen. The train function automatically chooses the tuning parameters associated with the best value.
Metrics for evaluating machine learning models
We evaluated the machine learning algorithms using the evaluation metrics provided by the caret package in R (i.e., accuracy and kappa), as these are the default metrics used to evaluate algorithms with binary and multiclass classification data sets. Accuracy is the percentage of correctly classified instances out of all instances. Kappa, or Cohen's kappa, is like classification accuracy except that it is normalized at the baseline of random chance on a given data set. It is used to measure interobserver agreement for categorical classes. Some authors consider kappa >0.75 excellent, kappa = 0.40–0.75 fair to good, and kappa <0.40 poor. 24 The area under the receiver operating characteristic curve (AUC) was computed to assess the diagnostic ability of the chosen classifier system. 25
We used R language version 3.5 (Vienna, Austria) 26 to perform statistical analyses. P < 0.05 was considered statistically significant. All observations with missing values were deleted from the final data set.
Results
Exploratory data analyses
A total of 3,472 hypertensive patients were screened, of whom 1,576 were nondiabetic at the beginning of the observation period and were included in the study. Over a median follow-up period of 6.5 years and a maximum period of 12 years, 199 patients progressed to T2DM (progressors) and 1,377 did not (nonprogressors). Patients were obese or overweight (BMI = 30.4), but progressors had a higher BMI than nonprogressors (BMI = 31.7 vs. 29.2, respectively). Primary characteristics of the population studied are shown in Table 1.
Baseline Characteristics
Values are medians (interquartile ranges) or mean ± standard deviations.
ACR, urine albumin-to-creatinine ratio; BMI, body mass index; CKD-EPI, Chronic Kidney Disease Epidemiology Collaboration; DBP, diastolic blood pressure; FPG, fasting plasma glucose; HbA1c, glycated hemoglobin; HDL-C, high-density lipoprotein cholesterol; HOMA-IR, Homeostatic Model Assessment of Insulin Resistance; hs-CRP, high-sensitivity C-reactive protein; LDL-C, low-density lipoprotein cholesterol; SBP, systolic blood pressure.
Univariate and multivariate analyses
A total of 20 variables were compared in univariate tests. There were significant differences in almost all characteristics, except DBP, HDL-C, and creatinine. Progressors were older than nonprogressors. Moreover, BMI, uric acid, total cholesterol, LDL-C, triglycerides, basal glycemia, HbA1c, insulin, HOMA-IR, albuminuria, and inflammatory markers (both hs-CRP and fibrinogen) differed between the two cohorts in univariate analyses.
Results of multivariate analyses using the variables that were significant in univariate analyses are shown in Table 2. When we adjusted for age and sex, only HOMA-IR (OR = 1.13), BMI (OR = 1.04), and log(hs-CRP) and fibrinogen (ORs = 1.37 and 1.44, respectively) were associated with progression to T2DM.
Multivariate Analyses
CI, confidence interval.
Machine learning analyses
We first developed a predictive model matrix using the aforementioned algorithms. Figure 1 shows both the accuracy and kappa of every evaluated model.
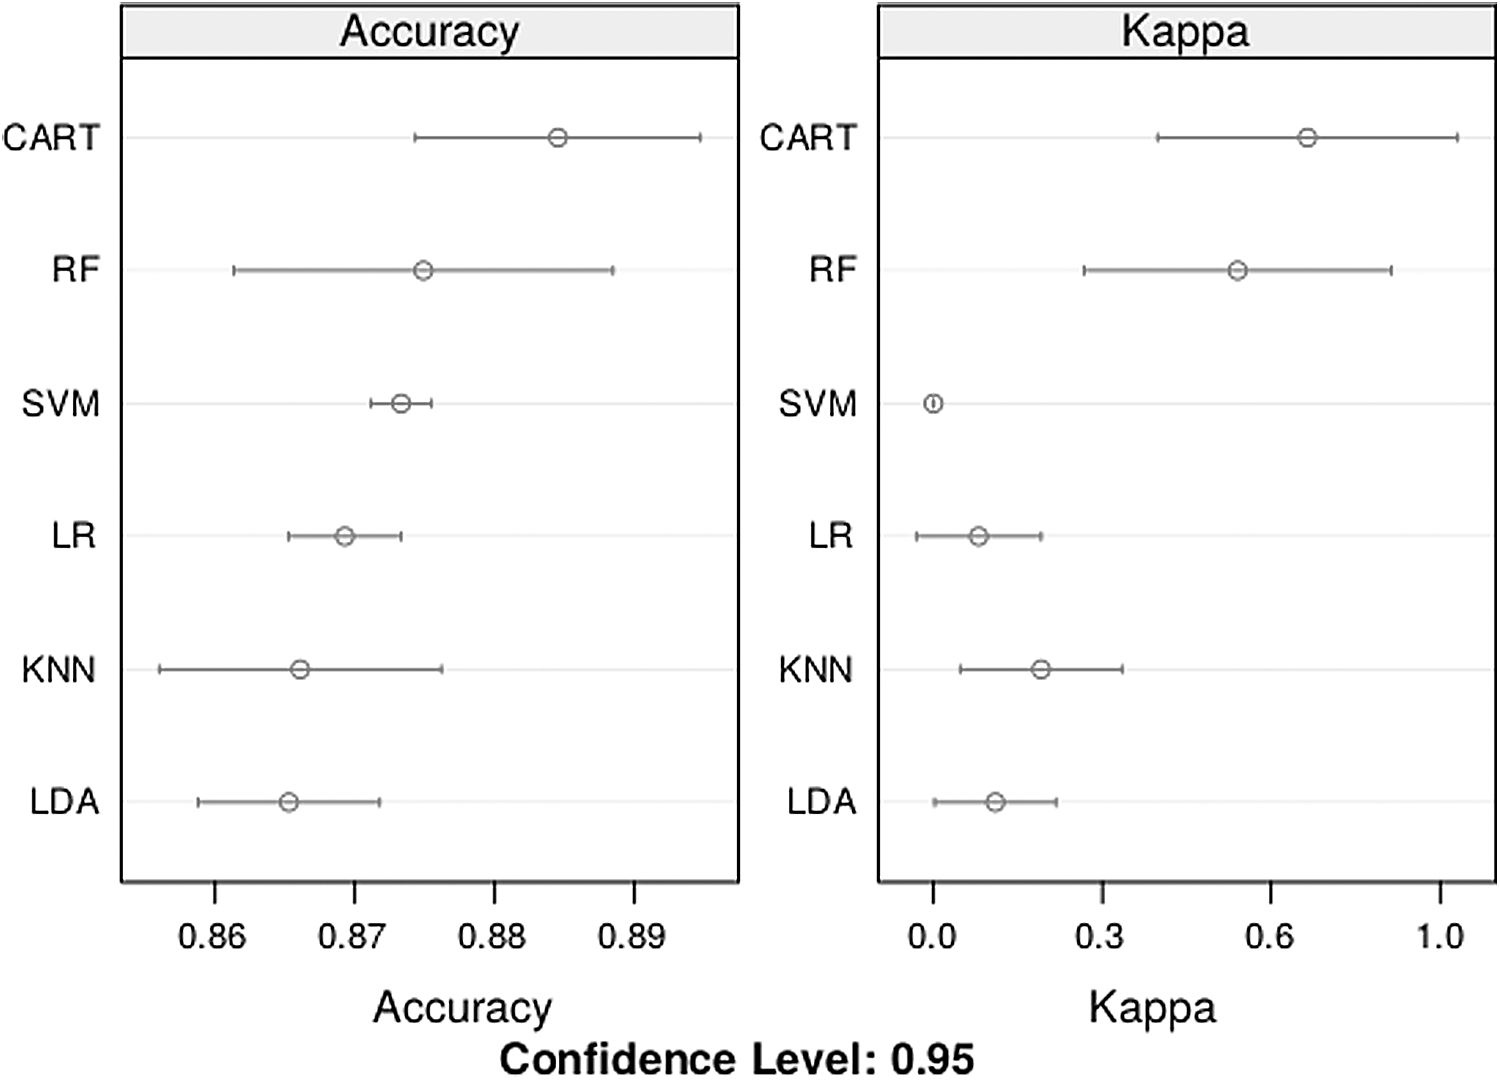
Performance metrics of the evaluated algorithms. CART, classification and regression trees; KNN, K-nearest neighbors; LDA, linear discriminant analysis; LR, logistic regression; RF, random forest; SVM, support vector machines.
The accuracy of all six models was similar, between 0.86 and 0.89. However, kappas were higher for CART and RF than the other models. Furthermore, SVM, LR, KNN, and LDA had kappa coefficients below 0.3 (poor agreement). Table 3 shows some performance metrics when our six models were applied to a testing set, that is, not seen data.
Summary of Metrics of the Evaluated Models Using a Testing Set
For the CART model, the best value for the tuning parameter (complexity parameter, or cp, which determines depth of the tree and number of terminal nodes) was 0.038.
CART, classification and regression trees; KNN, K-nearest neighbors; LDA, linear discriminant analysis; LR, logistic regression; RF, random forest; SVM, support vector machines.
We then applied RFE from the caret package. It provided six variables: log(hs-CRP), fibrinogen, age, sex, BMI, and HOMA-IR. Figure 2 shows how a built-in RF algorithm was used on each iteration (in our case, 10-fold crossvalidation) to evaluate the models. RFE was configured to explore all possible subsets of the variables. Although all 20 variables were evaluated, the plot shows that the accuracy of the different subset sizes was optimal with just 6 variables.

Feature selection using recursive feature elimination.
The next step was to rank the variables by importance using the CART model that had been chosen in the classification step. Since methods based on decision trees have a built-in method of determining the importance of variables, we plotted the results in Fig. 3.
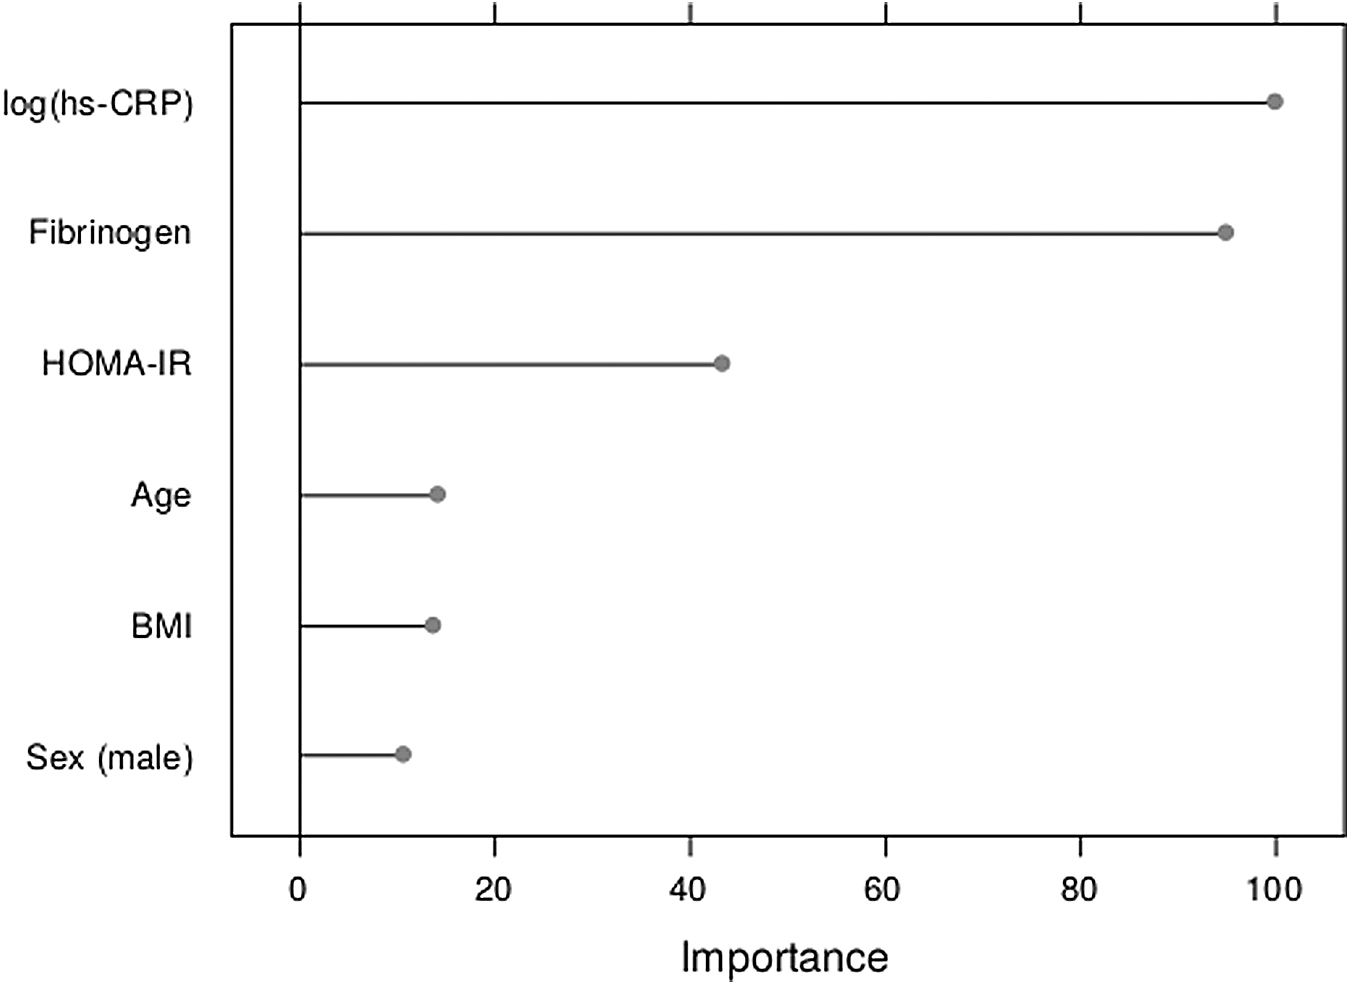
Rank of variables by importance using the CART model. BMI, body mass index; HOMA-IR, Homeostatic Model Assessment of Insulin Resistance; hs-CRP, high-sensitivity C-reactive protein.
HOMA-IR, fibrinogen, and log(hs-CRP) were the three most relevant variables in our data set, whereas sex, BMI, and age were the least important.
Finally, we evaluated the performance of the CART model. Its accuracy was 0.88 (95% confidence interval: 0.84–0.91), sensitivity was 0.98, specificity was 0.77, positive predictive value was 0.89, and negative predictive value was 0.63. The AUC was 0.90, as shown in Fig. 4. The AUC of the previously computed logistic regression model was 0.76.
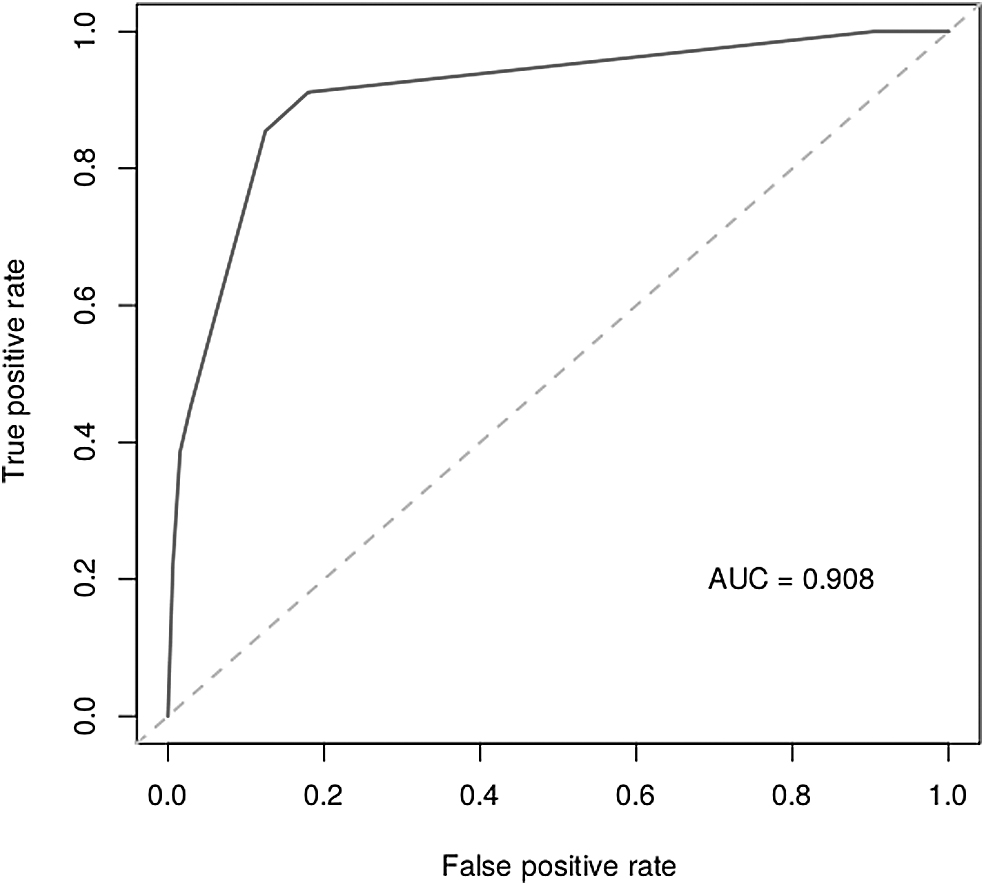
AUC plotted with the CART model. AUC, area under the receiver operating characteristic curve.
Discussion
Our main objective was to establish relationships between an activated acute-phase response and risk for progression to T2DM to reveal the therapeutic implications of such findings. Some inflammatory biomarkers are linked to atherosclerosis and cardiovascular disease in patients with diabetes mellitus, but mechanisms of progression to established T2DM through inflammatory biomarkers remain unclear. Therefore, the purpose of our study was to determine the influence of inflammatory biomarkers, such as fibrinogen and CRP, on progression to T2DM. Our main finding was that hs-CRP, fibrinogen, and HOMA-IR were higher in progressors than in nonprogressors. By using complex machine learning algorithms to both develop a predictive model and identify the most relevant features in our patients, we demonstrated that these biomarkers were associated with this progression.
Nichols et al. 27 demonstrated that an initial abnormal FPG, higher BMI, BP, and triglycerides predict progression to T2DM. However, the underlying mechanism is the deterioration of beta cell function, which plays a major role in the progression to T2DM. 28,29 Pancreatic beta cells respond to insulin resistance by increasing plasma levels of insulin. In patients with T2DM, beta cells are not able to adequately respond to the needs of tissues and thus cannot compensate for insulin resistance. This deterioration occurs over time, and patients show an increase in plasma glucose until T2DM develops. The U.K. Prospective Diabetes Study (UKPDS), 30 using HOMA-IR as a predictor, demonstrated that the decline in beta cell function can begin as early as 12 years before the onset of overt T2DM.
Although genetic predisposition can play an important role in progression to T2DM, 31 this genetic profile cannot be proved in clinical practice, and environmental factors likely prevail. Impaired insulin secretion can be related to glucotoxicity and lipotoxicity. Chronic hyperglycemia depletes insulin from beta cells, and fatty infiltration of the pancreas leads to the deterioration of beta cells. 32,33
In addition to these factors, other local or systemic factors may be associated with the decline in beta cell function and the progression to T2DM. Inflammatory biomarkers can be involved in this deterioration. In response to glucotoxicity and lipotoxicity, pancreatic cells produce IL-1, IL-6, and TNF, among the most significant inflammatory mediators. This can lead to amyloid deposits and fibrosis and, eventually, the death of beta cells. 34,35
Regarding fibrinogen and CRP, some studies have found an increased risk for vascular disease in patients with diabetes beyond classic risk factors, such as FPG, obesity, hypertension, and dyslipidemia. In agreement with our findings, some studies have found a positive association between low-grade chronic inflammation involving cytokines (TNF, IL-1, IL-6) and both cardiovascular disease and the onset of T2DM, 36 highlighting the role of CRP and fibrinogen in the initiation and aggravation of insulin resistance, metabolic syndrome, and diabetic vascular disease. 37 Likewise, other studies have proposed a relationship between metabolic syndrome, insulin resistance, and progression to T2DM on the one hand and inflammation on the other. 38 According to these studies, CRP levels are increased in patients with metabolic syndrome or established T2DM 37 and are correlated with obesity, insulin resistance, and hypercoagulability. In line with these studies, Spanish research demonstrated that both fibrinogen and CRP levels are linked to BMI and FPG and that chronic proinflammatory status is involved in the initiation of and progression to T2DM from preclinical phases of the disease. 39 Also, a Chinese study found a direct relationship between inflammation (determined by IL-6 and CRP) and progression from prediabetes to overt T2DM, beyond the role of inflammation in atherosclerosis at a stage of T2DM. 40
Inflammatory biomarkers can provide further information on patients' risk of progressing to T2DM and may become new therapeutic targets. Drugs with anti-inflammatory properties, such as insulin, metformin, glitazones, and statins, may reduce the risk for progression to T2DM, as they can reduce CRP levels despite their effects on lipid and glucose plasma levels. 41 –44
The role of machine learning approaches
Our intention was not only to study the relationships between inflammatory biomarkers and progression to T2DM but to expand analyses of our data set by executing a full supervised machine learning workflow to describe further approaches to similar problems using a systematic, methodical approach. In the health sciences, it is essential to accurately estimate the involvement of certain demographic, clinical, or laboratory features to develop accurate predictive models. Features in patients have a wide variety of parameters that interact in complex ways. A model that can reliably predict disease given a list of variables can result in better decision-making processes.
The study of class imbalance, the skewness of the distribution of the variables, or the need to impute data justify the preprocessing of the data set. The concept of “garbage in, garbage out” is popular in artificial intelligence and other computer sciences, as it means that nonsense input produces nonsense output. Data cleansing and preparation are crucial to producing good-quality information. For instance, working with the base-10 logarithm of hs-CRP allowed us to improve predictability (as verified separately; data not shown).
It is worth noting that we used several different algorithms to develop a predictive model. Since we did not know which ones would be good for this particular problem, we decided to avoid making any assumptions about the linearity of the relationships between variables. However, the proposed mixture of linear, nonlinear, and decision tree-based methods covered a wide range of algorithms.
Machine learning approaches could be reliably applied to our data set and produced significant results: Inflammatory biomarkers such as hs-CRP and fibrinogen were involved in the progression to T2DM. Compared with standard logistic regression, determining OR alone can lead to a loss of information and loss of insight. The results provided by techniques such as RFE and feature selection helped us gain insight into our data set, providing greater predictive power than standard logistic regression (AUC = 0.9 vs. 0.76, respectively). Therefore, we identified HOMA-IR, fibrinogen, and hs-CRP as the most important variables predicting the progression to T2DM, whereas age, BMI, or sex were deemed less relevant.
Conclusion
Inflammation determined by CRP and fibrinogen plays a role not just in cardiovascular disease but in progression to T2DM. New approaches to dealing with the diagnosis and management of inflammation are needed. We demonstrated the predictive power of certain inflammatory biomarkers in an obese, hypertensive population. We found that CRP and fibrinogen were higher in progressors than in nonprogressors. Moreover, we used complex machine learning algorithms to both develop a predictive model and identify those biomarkers as the most relevant features in our patients, and thus we demonstrated that these biomarkers are associated with the progression to T2DM.
Management should focus on diagnosing and preventing the deterioration of pancreatic beta cells. Current therapies focus on lowering glucose levels or improving insulin resistance. However, identifying inflammatory biomarkers such as CRP or fibrinogen can lead to further research on therapies that could halt declines in beta cell function.
Limitations
The main limitation of our study had to do with the intrinsic characteristics of our population. Individuals in our cohort were obese and hypertensive, and many of them had prediabetes or metabolic syndrome. This high-risk population tends to progress to T2DM more easily than the general population. Although the inflammatory biomarkers identified here were relevant in this cohort, we do not know their true importance in other populations.
Future research
Performing an exploratory analysis can reveal new questions or future lines of research. In this study, we demonstrated the predictive power of certain biomarkers in an obese, hypertensive population, but the importance of these biomarkers should be demonstrated in other populations or even in the general population. Furthermore, the role of HOMA-IR as a prognostic factor in the development of T2DM in hypertensive patients should be investigated in greater depth. New therapeutic strategies are needed to address the contribution of inflammation to the deterioration of beta cells.
Data Availability
According to the terms of a contract signed with Mostoles University Hospital, which provided the data set, the authors cannot provide the data set to any other researcher. Furthermore, they destroyed the data set at the conclusion of the research.
Ethics Approval and Consent to Participate
Our retrospective research was approved by the Research and Ethics Committee of Mostoles University Hospital (Reference No. CEIC 2020/025). All procedures involving human participants were conducted in accordance with the ethical standards of the responsible Institutional and/or National Research Committee and with the tenets of the 1964 Helsinki Declaration and its later amendments or comparable ethical standards. The authors obtained consent for publication from their institution and its Research and Ethics Committee.
Footnotes
Authors' Contributions
R.G.-C. designed and conceived the study. He also preprocessed the data and made substantial contributions to the analysis and interpretation of the data. He wrote the first draft of the article. L.V.-M. critically reviewed the first draft and made valuable suggestions. O.B.-P. critically reviewed the final article. All authors read and approved the final article.
Author Disclosure Statement
The authors have no conflicts of interest to declare.
Funding Information
The authors received no financial support for this research or the authorship or publication of this article.