




Abstract
Background:
Neopterin, marker of cellular immunity and oxidative stress, is mainly produced by activated macrophages. It could play a crucial role in the development of insulin resistance (IR) and type 2 diabetes (T2D). The aim of this study was to investigate the circulating levels of neopterin in different stages of glucose dysregulation from obesity through prediabetes to newly diagnosed diabetes.
Methods:
Neopterin levels were determined using a commercially available human enzyme-linked immunosorbent assay kit. The homeostasis model assessment of IR was used as an index to assess IR.
Results:
The sample consisted of 163 subjects with mean age 52.5 ± 11.3 years, divided in three age- and body mass index (BMI)-matched groups—obesity, prediabetes, and diabetes. The control group consisted of 42 healthy individuals. Neopterin levels were significantly higher in patients with obesity and/or prediabetes and newly diagnosed diabetes than those in the control group, respectively (4.14 ± 2.51; 4.04 ± 2.80 and 2.17 ± 1.93 vs. 0.87 ± 0.84; P < 0.05). Correlation analysis showed that the level of neopterin positively correlated with BMI, waist, waist-to-stature ratio, waist-to-hip ratio, fasting glucose, and triglycerides. Receiver operating characteristic analysis established neopterin suitable for distinguishing subjects with obesity [area under the curve (AUC) = 0.83; P < 0.001] and carbohydrate disturbances (AUC = 0.59; P < 0.05) from those without these conditions. Neopterin ≥0.47 ng/mL have an odds ratio (OR) of 2.71 for development of dysglycemia, whereas threshold value of neopterin ≥0.56 ng/mL shows an OR of 5.94 for development of obesity.
Conclusion:
The levels of neopterin were increased in patients with obesity and carbohydrate disturbances. Further studies will elucidate the role of the biomarker in development of T2D and its complications.
Introduction
Diabetes mellitus is one of the most serious health issues which has reached an alarming prevalence in the past decade. In 2019 it was estimated that 463.0 million adults 20–79 years of age worldwide have diabetes. 1 As a heterogeneous syndrome, type 2 diabetes (T2D) is characterized by abnormalities in the carbohydrate and lipid metabolism. The majority of individuals suffering from T2D are obese, with central visceral adiposity. Therefore, the adipose tissue (AT) plays a crucial role in the pathogenesis of T2D. 2 Obesity results from a chronic imbalance between caloric intake and energy expenditure that is characterized as a low-grade, chronic inflammatory disease that contributes to the metabolic dysfunction and insulin resistance (IR). 3 Although the molecular basis underpinning this inflammation is not fully understood, it is widely known and the scientific community agrees that macrophage activation in AT precedes the development of IR and contributes to a proinflammatory state. 4,5 Nutrient excess tips the scale toward the development of a more inflammatory adipocyte state, including the secretion of potent chemoattractants such as monocyte chemotactic protein 1 and leukotriene B4, which supply a chemotactic gradient for the recruitment of monocytes to AT, where they subsequently mature into adipose tissue macrophages (ATMs). ATMs, themselves produce further chemokines, initiating a feed-forward loop and potentiating the inflammatory reaction. Furthermore, in the setting of obesity, macrophage emigration from AT is also impaired. 6
Nowadays, many studies have shown that circulating markers of inflammation and acute-phase reactants are strong predictors of the development of T2D. 7 –9 Neopterin, which is produced by activated macrophages/monocytes primarily upon stimulation by interferon-γ (IFN-γ), is a potential marker of immune activation.
Neopterin as a pteridine derivative, is also produced in lesser amounts by the IFN-γ-stimulated renal epithelial cells, fibroblasts, and vascular smooth muscle. 10 –12
It has been shown that the levels of neopterin are increased in conditions in which inflammation plays a role in the pathogenesis, as neopterin is an important indicator of monocyte activation in the inflammatory response. Thus, some studies aim to elucidate its role in diabetes development, as well as inflammatory markers and diabetes-related complications, such as diabetes nephropathy and atherosclerosis. 13,14
This study aimed to investigate the circulating levels of neopterin in different stages of glucose dysregulation from obesity through prediabetes to newly diagnosed diabetes.
Methods
Study population
A total of 163 Caucasian subjects, recruited from 2017 to 2019 in a tertiary university hospital setting participated in the study.
Inclusion criteria were as follows: age between 45 and 74 years, presence of body mass index (BMI) ≥30 kg/m2 and/or impaired fasting glucose (IFG) (fasting glucose between 6.1 and 6.9 mM) and/or impaired glucose tolerance (IGT) [glucose on 120 min of oral glucose tolerance test (OGTT) between 7.8 and 11.0 mM] and/or newly diagnosed diabetes within 1 month before hospital admission and without any previous antidiabetic therapy.
The majority of patients with T2D (>70%) were on a treatment for hypertension, including beta-blockers, calcium channel blockers, angiotensin II receptor blockers, and diuretics. In addition, part of them took statins owing to dyslipidemia.
Forty-two subjects were part of the control group. The health status of all individuals in the control group was evaluated in detail. Those who did not take any medication before the study and who did not have any acute or chronic disease were included in the control group.
Exclusion criteria were as follows: liver dysfunction (any hepatic enzyme 3 times above the upper limit of the reference range); chronic kidney disease (estimated glomerular filtration rate estimated by chronic kidney disease epidemiology collaboration calculation <60 mL/min/1.73 m2); neoplastic disease; and intake of any oral antidiabetic drug 3 months before inclusion.
The study was approved by the Science Studies Ethics Committee of the Medical University Sofia (KENIMUS) (Protocol no. 22/05.12.2018) and all subjects included in the study signed informed consent for participation in the project.
The following study methods were used: Anthropometric measurements included waist circumference (WC), weight, height, hip circumference, BMI, and arterial blood pressure. BMI was calculated as weight in kilograms divided by height squared in square meters as a measure of general obesity. People with BMI ≥30 kg/m2 were considered to be obese (EASO 2015).
15
WC was measured at the midpoint between the inferior costal margin and the superior border of the iliac crest on the mid-axillary line. Central obesity was defined as a WC of ≥94 cm in men and ≥80 cm in nonpregnant women (Alberti et al.).
16
Hip circumference was measured at the level of the greater trochanter. Waist-to-hip ratio (WHR) and waist-to-stature ratio (WSR) were calculated using the equations as follows: WC/hip circumference and WC/height. According to WHR, the cutoff for central obesity is ≥0.85 for women and ≥0.90 for men (WHO).
17
The normal value for WSR is <0.50 (WHO).
17
Estimation of VAI (visceral adiposity index) was performed using the following formula: female VAI = (WC/(36.58 + (1.89 × BMI))) × [triglycerides (TG)/0.81] × [1.52/high-density lipoprotein (HDL)]; male VAI = (WC/(39.68 + (1.88 × BMI))) × (TG/1.03) × (1.31/HDL). Percentage body fat (body fat%) was evaluated using body impedance by a TANITA™ TBF-215 GS Body Composition Analyzer in fasting state. Investigation of carbohydrate metabolism—An OGTT with measurement of glucose and immunoreactive insulin (IRI) (ECLIA—Roche Diagnostics™) on 0, 60, and 120 min. Homeostasis model assessment (HOMA) index (fasting glucose × fasting IRI)/22.5) was calculated. IR was assumed as HOMA index above 2.5.
18,19
The presence of metabolic syndrome (MS) was determined based on the IDF criteria (Alberti et al.).
16
Patients were considered to have MS if they meet at least three of the following criteria: (1) abdominal obesity, defined as WC ≥94 cm for men, and ≥80 cm for women. (2) Elevated blood pressure, defined as systolic blood pressure ≥130 mm Hg or diastolic blood pressure ≥85 mmHg, or current antihypertensive drug treatment; (3) elevated fasting blood glucose level ≥5.6 mM or current use of blood glucose- lowering agents or history/diagnosis of T2D; (4) decreased HDL cholesterol level (<1.03 mM in men or <1.30 mM in women) or drug treatment aimed to increase HDL cholesterol; and (5) hypertriglyceridemia (triglyceride level ≥1.70 mM) or drug treatment for elevated TG. Measurement of intima-media thickness (IMT) by Panasonic CardioHealth station (Panasonic, Japan), ankle-brachial index (ABI) (Elite Natus); assessment of autonomic nervous system by evaluation of sudomotor function with Food and Drug Administration (FDA)-approved Sudoscan (Itamar Medical Israel) and assessment of peripheral nervous system through neuropathy disability score. Measurement of serum neopterin was performed by enzyme-linked immunosorbent assay (ELISA) (Abbexa Ltd, Cambridge, United Kingdom) with a detection range of −0.156 to 10 ng/mL and sensitivity <0.094 ng/mL. The blood samples were taken after overnight fasting and were immediately centrifuged for 15 min on 4000 rpm, subsequently the serum was stored at (−80°C) until the laboratory test was performed.
Statistical analysis
The data were processed using the statistical package SPSS 25.0 (IBMTM). The level of significance for rejecting the null hypothesis was P < 0.05. The following statistical methods were applied: descriptive analysis, variation analysis, Kolmogorov–Smirnov's one-sample nonparametric test, Student's t-test for two independent samples, Kruskal–Wallis nonparametric test for more than two independent samples, one-way analysis of variance (ANOVA) for between groups, correlation analysis, receiver operating characteristic (ROC) curve analysis, and binary logistics regression analysis. Data are presented as mean ± standard deviation.
Results
In this study, we included 163 subjects with mean age 52.5 ± 11.3 years, divided into four groups, as follows: group 1 (control group) who neither have obesity nor any carbohydrate disturbances (n = 42); group 2—obese without glycemic disturbances (n = 40); group 3—individuals with obesity and prediabetes (n = 42); and group 4—patients with obesity and newly diagnosed T2D (n = 39). The characteristics of the four groups are presented in Table 1. In the group with prediabetes, 17 patients (40.48%) were with IFG, 22 (52.38%) with IGT, and 3 (7.14%) with both IFG and IGT.
Anthropometric Characteristics of the Study Groups
P < 0.05 compared with group 1.
P < 0.001 compared with group 1.
BMI, body mass index; SD, standard deviation; WHR, waist-to-hip ratio; WSR, waist-to-stature ratio.
The four groups did not differ in age; however, those with obesity, prediabetes, and diabetes had higher BMI, WSR, WHR, and WC than those in the control group. With regard to cardiovascular risk factors, we found a higher level of TG and total cholesterol and lower level of HDL in patients with diabetes compared with those with obesity and IGT. Patients with diabetes had a higher level of fasting glucose in comparison with subjects with obesity and prediabetes. In addition, HOMA index was higher in patients with prediabetes and diabetes compared with the control group (Table 2).
Cardiovascular Risk Factors
P < 0.05 compared with group 4.
P < 0.05 compared with group 2.
DBP, diastolic blood pressure; HDL, high-density lipoprotein; HOMA, homeostasis model assessment; LDL, low-density lipoprotein; MetS, metabolic syndrome; SBP, systolic blood pressure; Tchol, total cholesterol; TG, triglycerides.
The levels of neopterin in patients with obesity, prediabetes, and diabetes were higher compared with the control group (4.14 ± 2.51; 4.04 ± 2.79; 2.17 ± 1.93 vs. 0.87 ± 0.84 ng/mL; P < 0.05) (Fig. 1). Furthermore, the level of neopterin was significantly higher in obese patients without any carbohydrate disturbances and in those with prediabetes compared with those with newly diagnosed diabetes. There was a positive correlation between the level of neopterin and BMI (r = 0.45, P < 0.001), WC (r = 0.40, P < 0.001), WSR (r = 0.42, P < 0.001), WHR (r = 0.21, P < 0.05), fasting glucose (r = 0.29; P < 0.01), and TG (r = 0.21, P < 0.05) (Table 3). Regarding the presence of MS, there was no difference in neopterin levels.
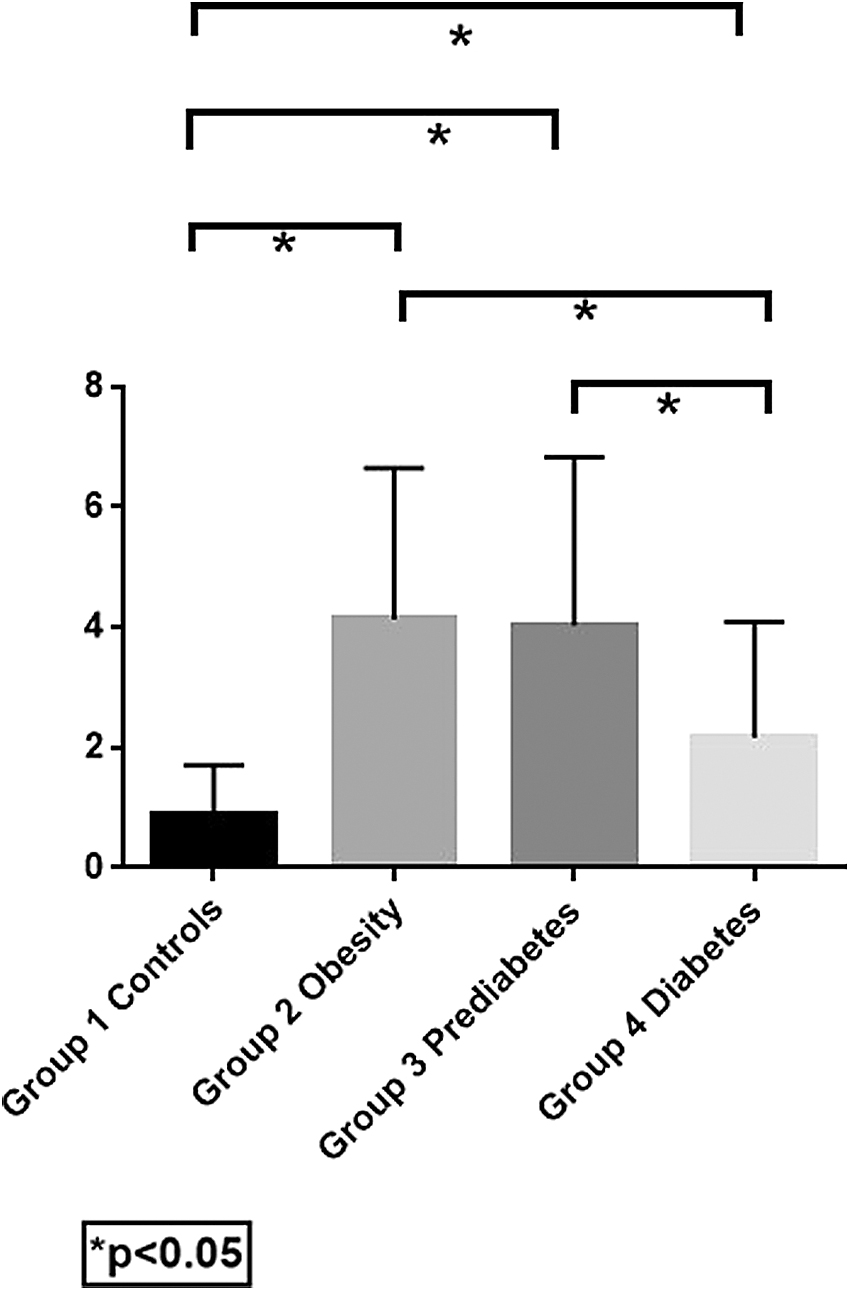
Serum neopterin (ng/mL) between the groups. The levels of neopterin in patients with obesity, prediabetes, and diabetes are higher compared with healthy control group (4.14 ± 2.51; 4.04 ± 2.79; 2.17 ± 1.93 vs. 0.87 ± 0.84 ng/mL; P < 0.05). Furthermore, the level of neopterin was significantly higher in patients with obesity and without carbohydrate disturbances and in those with prediabetes compared with patients with newly diagnosed diabetes.
Correlation Between Neopterin and Laboratory and Instrumental Results
P < 0.05, ** P < 0.01; *** P < 0.001.
ABI, ankle-brachial index; ALAT, alanine aminotransferase; ANR, autonomic neuropathy risk; ASAT, alanine aminotransferase; GGT, gamma-glutamyltransferase; IMT, intima-media thickness; NDS, neuropathy disability score; QUICKI, quantitative insulin sensitivity check index; VAI, visceral adiposity index.
ROC curve analysis was performed to determine whether neopterin can be used for differentiating between subjects with carbohydrate disturbances and those with obesity. Utilizing ROC curve analysis [area under the curve (AUC) = 0.83; P < 0.001; Fig. 2], we found that neopterin ≥0.56 ng/mL had 80% sensitivity and 60% specificity for distinguishing subjects with obesity. Furthermore, neopterin ≥0.47 ng/mL had 84% sensitivity and 34% specificity for distinguishing subjects with carbohydrate disturbances (AUC = 0.59; P < 0.05; Fig. 3). Binary logistic regression analysis determined that subjects with neopterin >0.47 ng/mL had an odds ratio (OR) of 2.71 for development of dysglycemia (Table 4), whereas threshold value of neopterin ≥0.56 ng/mL showed an OR of 5.94 for development of obesity (Table 5).

ROC curve of neopterin (AUC = 0.827, P < 0.001) used to determine the threshold value for differentiation between patients with and without obesity. AUC, area under the curve; ROC, receiver operating characteristic.
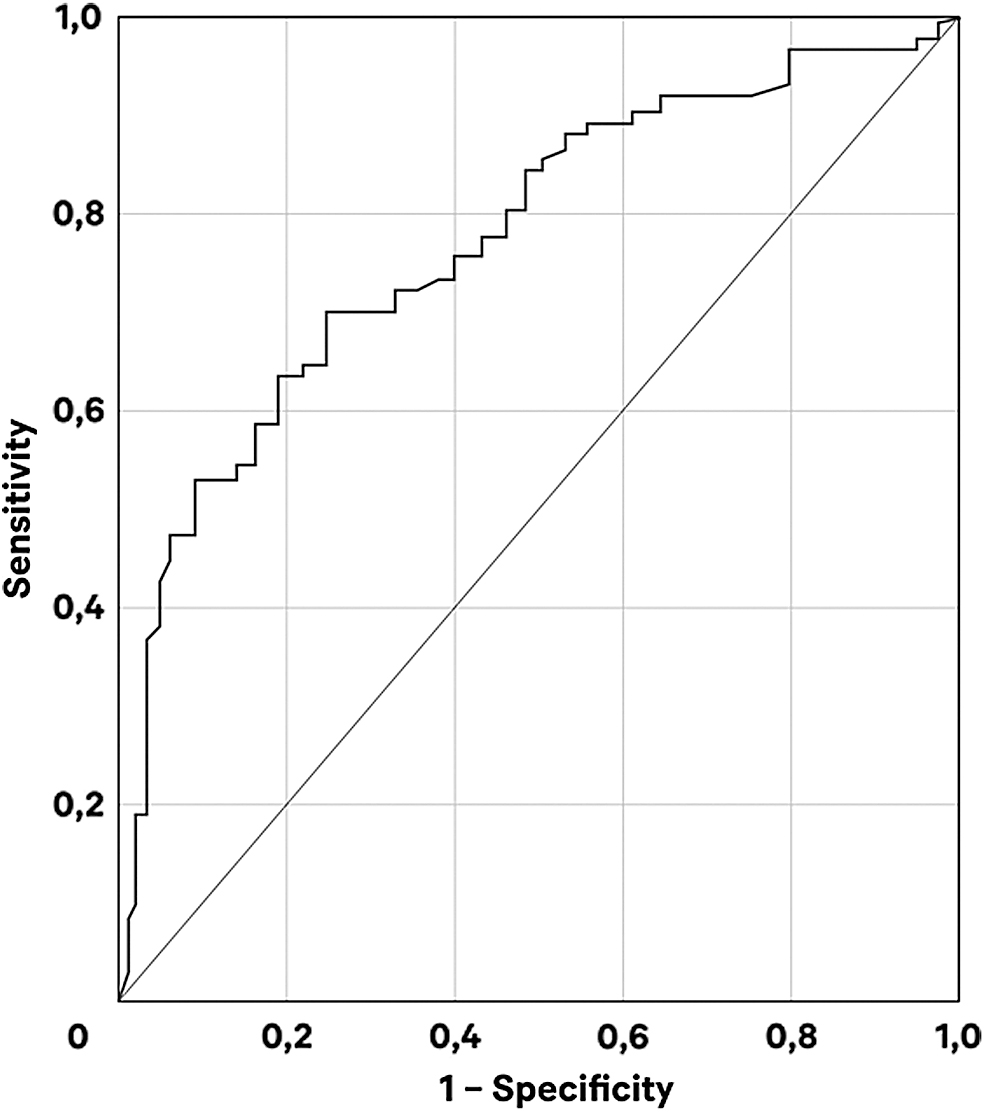
ROC curve of neopterin (AUC 0.591, P < 0.05) for determination of the threshold value for differentiation between patients with and without carbohydrate disturbances.
Odds Ratios and 95% Confidence Intervals for Distinguishing Patients With and Without Carbohydrate Disturbances
CI, confidence interval; OR, odds ratio.
Odds Ratios and 95% Confidence Intervals for Distinguishing Patients With and Without Obesity
We also investigated the association between serum neopterin levels and some instrumental methods, assessing micro- and macrovascular complications. We did not find a significant correlation between neopterin and the thickness of intima-media of the common carotid artery—a biomarker for early atherosclerosis. No relationship was established also between the latter-mentioned biomarker and the index, evaluating the presence of peripheral artery disease (ABI) and the sudomotor function, evaluated by SUDOSCAN.
Discussion
Our study provides data on the serum neopterin concentrations across the whole spectrum of carbohydrate disturbances among patients with obesity. We found that serum neopterin concentration was significantly associated with anthropometric parameters such as BMI, WC, WHR, WSR, VAI, and the level of fasting glucose levels. The level of neopterin was higher in patients with obesity, prediabetes, and T2D than those in the control group when compared across all four groups.
Although the biological function of neopterin is still not completely clear, it has been shown that it plays a crucial role in the pathogenesis and progression of various diseases through its effect on the stages of activation of the cellular immune system. Moreover, neopterin is supposed to be not only an initial inflammatory marker, but also a predictive factor in the progression of the disease. 20 –22
Neopterin can also be regarded as a sign of reactive oxygen species produced by the active cellular immune system because its serum levels are associated with the production of reactive oxygen radicals and low antioxidant concentrations. It could predict not only the extent of cellular immune activation, but also the level of oxidative stress. 12 Furthermore, neopterin biosynthesis by monocytes/macrophages and the following tumor necrosis factor-α production are responsible for the positive correlation of neopterin with glucose concentrations and BMI, respectively. Similar to previous cohort studies, we also found a positive correlation between anthropometric parameters, associated with central obesity and neopterin levels. 23
In urine samples of rat and monkey diabetic models, increased kynurenine metabolites have been reported. 24 In human serum and urine samples of patients with diabetes, the level of the concentration of kynurenine pathway metabolites was also increased in comparison with that of nondiabetic controls. 25,26 Higher levels of neopterin were reported among patients with diabetes and microalbuminuria, diabetic foot syndrome, and in pregnant women with gestational diabetes. 27 –30 On the contrary, in a couple of population-based cohorts, neopterin was not higher in the diabetes group compared with the control. 13,31 One explanation for the different outcomes in patients with diabetes may be owing to uncontrolled factors that could potentially affect serum neopterin levels, such as age, BMI, hypoglycemic agents, or diabetic complications.
However, little is known about the role of neopterin in the early stages of carbohydrate disorders, namely prediabetes. To our knowledge, this is the first study to compare neopterin values in all stages of glucose tolerance in subjects with obesity. In a previous study, Lee et al. reported higher neopterin concentration in patients with newly diagnosed T2D in comparison with those with prediabetes and control group. However, no difference in concentration was found between patients with normal glucose levels and those with prediabetes. 32 In our study, the levels of neopterin in drug-naive newly diagnosed diabetic subjects were also higher than those in the control group. In contrast to Lee et al., where all the patients had BMI <30 kg/m2, in this study even higher level of neopterin was reported in patients with obesity without carbohydrate disturbances and in individuals with prediabetes compared with those with diabetes.
It is well established that obesity is an inflammatory disorder in which AT is largely infiltrated by macrophages, which synthesize neopterin. As shown by the ROC curves, serum neopterin has a better predictive value for the presence of obesity than for the presence of carbohydrate disturbances. Taking into consideration the above-mentioned facts and the significant positive correlation with the markers of visceral obesity, we can speculate that the main reason for increased neopterin levels in comparison with the control group in our study is the adiposity parameters, rather than the patients' glycemic status. Another potential explanation might lie in the fact that the study groups differed in the prevalence of arterial hypertension and intake of antihypertensive medications. In a previous study, it has been demonstrated that 3-month standard antihypertensive treatment reduced neopterin levels and improved endothelial function and vascular elasticity. 33 Finally, in this study neopterin levels were measured in serum using commercially available ELISA, whereas Lee et al. assessed neopterin concentration in frozen plasma. Similar to our experience, the authors also reported a positive association of serum neopterin and fasting glucose. However, contrary to Lee et al. we observed no correlation with postload glucose and IR indices. The dissimilarities of the results between studies could be explained by differences in sample sizes and distribution of carbohydrate disturbances in the investigated groups.
To our knowledge, our study is the first one to reveal neopterin as a potential predictor for the distinction of subjects with early carbohydrate disturbances as those with serum neopterin levels >0.47 ng/mL have an OR of 2.71 for the development of dysglycemia. In addition, a cutoff value ≥0.56 ng/mL had 80% sensitivity and 60% specificity and OR of 5.94 for the presence of obesity.
Existing data on the role of neopterin in the development of atherosclerosis are contradictory. Previous reports demonstrated increased plasma levels of neopterin in patients with carotid, cerebral, and coronary artery diseases and aortic aneurysm as the concentration of neopterin is positively correlated with the severity of coronary artery disease. 34 –36 Liao et al. in their study concluded that the level of serum neopterin is higher in patients with subclinical atherosclerosis. 37 In our study, we did not find a correlation between the level of neopterin and the thickness of intima-media of the common carotid artery. A potential explanation might lie in the prevalent mean level of IMT (0.7 ± 0.1) in all groups which is below the acceptable cutoff point for subclinical atherosclerosis of 0.9 mm [European Society of Hypertension (ESH)/European Society of Cardiology (ESC) Guideline 2013]. 38
Contrary to previous studies, a recent study, using both in vitro and in vivo experiments, has shown the atheroprotective effects of neopterin. Through suppression of macrophage foam cell formation and the migration and proliferation of vascular smooth muscle cells, high levels of neopterin expression in coronary lesions could be attributed to endogenous upregulation of neopterin to counteract the progression of atherosclerosis. 39
However, more studies in animals and humans are needed to clarify the exact role of neopterin—marker of immune system activation and oxidative stress or novel therapeutic target.
Limitations of our study include gender distribution, cross-sectional study design, small sizes of compared groups, which might have affected correlations and ROC analyses and the fact that part of our patients were on a treatment for hypertension and dyslipidemia.
Conclusion
This study shows that neopterin relates better to obesity indices rather than glycemic status in patients with early stages of carbohydrate disturbances. Further studies are needed to elucidate the biological mechanisms behind this finding/phenomenon and to assess whether prospective therapeutic applications of neopterin in diabetes and its complications are plausible.
Footnotes
Author Disclosure Statement
No conflicting financial interests exist.
Funding Information
The study was performed with the financial support of Medical University-Sofia, Bulgaria, project no. 8269/21.11.2018, contract D-124/2019.