




Abstract
Background:
Child malnutrition represents a major public health problem with physiological, psychological, and social short- and long-term implications.
Objective:
To compare the influence of nutritional status on oxidative stress (OS) markers in children aged 3–6 years.
Methods:
Children were categorized into four groups: underweight, normal weight, overweight, and obesity. Glucose (Glu), cholesterol (Chol), high-density lipoproteins, insulin, triacylglycerols (TG), triacylglycerols/glucose (TyG) index, and the homeostasis model assessment of insulin resistance (HOMA-IR) were analyzed. In addition, OS [malondialdehyde (MDA) and 3-nitrotyrosine (3-NT)] and antioxidant defense markers [superoxide dismutase (SOD), catalase (CAT), and the ratio of reduced/oxidized glutathione (GSH/GSSG)] were quantified.
Results:
Children with obesity showed significantly higher levels of MDA and 3-NT, and increased SOD activity compared with normal weight children. Glu, Chol, TG levels, TyG indexes, HOMA-IR, MDA, 3-NT, and SOD positively correlated with body mass index (BMI) and Centers for Disease Control and Prevention percentiles (CDC PC). However, CAT concentration and the GSH/GSSG ratio correlated negatively with BMI and CDC PC. In children with underweight, we found a positive correlation of TG levels and TyG indexes with BMI, whereas both markers positively correlated with BMI and CDC PC in children with overweight. MDA negatively correlated with BMI in children with underweight, while a positive association was observed in children with overweight. Finally, SOD, CAT, and GSH/GSSG negatively correlated with both BMI and CDC PC in children with overweight.
Conclusions:
Malnutrition, especially obesity, is associated with metabolic and OS disturbances in preschool children. It is urgent to design strategies to prevent malnutrition in this age group since this stage of development is crucial to potentially avoid future co-morbidities.
Introduction
Malnutrition involves the deficiency, excess, or imbalance of an individual's energy and nutrients intake. According to the World Health Organization (WHO), malnutrition represents a major global public health and double burden challenge because it comprises both limits, undernutrition and obesity. 1,2 Globally, one in three people is malnourished. This situation is alarming in childhood since 155 million children are reported to be with undernutrition and 41 million with overweight or obesity. 1,2 Currently, this double burden condition in children is represented in Mexico since it is the second place with undernutrition in Latin America while the first for overweight and obesity worldwide. 3,4
Food intake is fundamental in nutritional definition and health. Particularly, preschool years (ages 3–6) are critical for the nutritional status. The programming and distribution of adipose tissue that the person will have throughout life take place during this period. 5 Also, the adiposity rebound or the second body mass index (BMI) rise in childhood occurs between 5 and 6 years, but an earlier timing is associated with obesity and metabolic alterations, such as cardiovascular risk and polycystic ovary syndrome in later life. 6 Malnutrition is also associated with physiological, psychological, and social short- and long-term implications. Among these implications, cognitive deficits have been recently issued as topics of growing interest. 7 From epidemiologically approaches, undernutrition is responsible for 45% of mortality during childhood, while noncommunicable diseases (NCDs) related to overweight and obesity stand out as the leading causes of death (72%) when reaching adulthood. 3,4
For children <5 years old, nutritional status cannot be determined only by considering the BMI. Instead, it must be clinically evaluated according to the weight-for-age (w/a), weight-for-height (w/h), and pediatric BMI percentiles. 8,9 According to Sampaio et al., anthropometry has been considered the most appropriate approach to assess collective nutritional status, especially in childhood and adolescence, because it is innocuous, easy to perform, and at a low cost. 10 Anthropometric measurements are also highly sensitive to the broad spectrum of the nutritional status. 11 Moreover, population-based reference data have been used to compare anthropometric measurements among children of different ages. 12
In the case of adults, malnutrition has been associated with oxidative stress (OS) generation, 13,14 which is defined as the biochemical imbalance between pro-oxidants [free radicals (FRs) and reactive species (RS)] overproduction and antioxidant systems deficiency, causing homeostatic intracellular oxidation–reduction alterations. Chronic OS causes macromolecule damage (lipids, carbohydrates, proteins, and nucleic acids) and thus, eventual cellular deterioration and death. 13 Furthermore, some studies have proposed OS as the link between malnutrition and the premature onset of particular co-morbidities, such as insulin resistance (IR), metabolic and cardiovascular diseases, and certain neoplasms. 14 –16 As mentioned above, obesity and undernutrition are risk factors for OS in adulthood, but only a few studies have been conducted in the preschool populations. 17 –19
Although some studies have reported a relationship between nutritional status and OS markers in preschool children, 20 –23 these authors included only one side of the spectrum of malnutrition, either underweight or obesity.
As malnutrition in children is a global severe health problem, we aimed to examine the effects of the nutritional status on metabolic and OS markers in preschool children (3–6 years) including four different anthropometric groups: underweight, normal weight, overweight, and obesity.
Materials and Methods
Participants selection
A sample of 100 children from 3 to 6 years of age (54 males and 46 females) was recruited from public preschool institutions in Chiconcuac de Juárez, a semiurban municipality of the State of Mexico. Information about children's medical history was collected. A fast of ∼8 hr was requested from each participant. Exclusion criteria included secondary obesity, malignancies, immunodeficiency, collagen vascular diseases, congenital abnormalities, neurological alterations, as well as drugs used for chronic diseases or antibiotics prescribed over the last 3 months.
Our research was approved by the Research and Ethics Committees of the Hospital Regional de Alta Especialidad de Ixtapaluca (HRAEI) (NR-027-2017) and was carried out following the Helsinki Declaration. Signed informed consent form was obtained from each child's parents or guardians.
Anthropometric determination
Trained personnel performed standardized anthropometric measurements, always in the presence of the child's parents or guardians. Weight (kg) and height (cm) were obtained for each participant by using a stadiometer (Seca 700; Hamburg, Deutschland); then, w/a, w/h, and BMI values were calculated. These values were transformed into Z-scores and percentiles, and subsequently placed in the AnthroPlus software (version 3.2.2, 2011, Geneva, Switzerland) based on WHO standards and reference tables of the Centers for Disease Control and Prevention (CDC; 2000). Participants were divided into four groups according to the Z-scores and percentiles (n = 25 per group): underweight (<5th percentile and Z-score < −2), normal weight (5th–85th percentiles and Z-score −1 to 1), overweight (85th–95th percentiles and Z-score <2), and obesity (>95th percentile and Z-score ≤3).
Blood sample
Blood samples were collected by venipuncture in ethylenediaminetetraacetic acid (EDTA) tubes (BD Vacutainer, K2 EDTA, REF 368171, 4 mL) and then centrifuged at 2500–3000 rpm during 15 min at 4°C. Plasma aliquots were identified by the folio number given for each participant and stored at −80°C until further analysis.
Determination of metabolic and OS markers
Samples were prepared and processed for OS and metabolic markers quantification according to the manufacturer's instructions (Teco Diagnostics, CA). The following metabolic and OS markers were analyzed: glucose (Glu), cholesterol (Chol), high-density lipoprotein (HDL) cholesterol, triacylglycerols (TG), insulin (INS), malondialdehyde (MDA), 3-nitrotyrosine (3-NT), superoxide dismutase (SOD), catalase (CAT), and the total reduced glutathione (GSH)/oxidized glutathione (GSSG) ratio. For each sample, markers were quantified in duplicate by spectrophotometry.
Triacylglycerols/glucose index
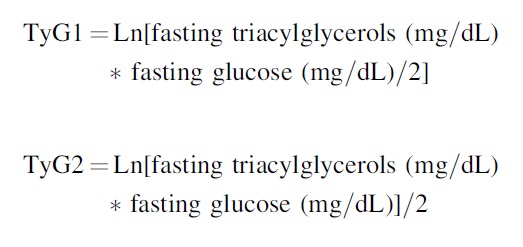
According to Rodríguez-Morán et al., the triacylglycerols/glucose (TyG) index is calculated by using triacylglycerol and glucose values. 24 This standard estimation has been used as a homeostasis model assessment analog of insulin resistance. The index was determined using the following equations:
Homeostatic model assessment for insulin resistance
The homeostasis model assessment of insulin resistance (HOMA-IR) index was calculated to determine IR using fasting glucose and insulin values with the formula:
The HOMA-β index, an estimation for insulin secretory function, is derived from fasting plasma glucose and insulin concentrations by the following formula:
Malondialdehyde
As a lipid peroxidation marker, MDA was quantified by the thiobarbituric acid (TBARS) method. 25 Values were adjusted with the dilution factor, and extrapolated for subsequent analysis and interpretation. Spectrophotometric measurements at 532 nm were performed in an EPOCH Biotek spectrophotometer (Winooski), and values were expressed as micromolar concentration (μM).
3-Nitrotyrosine
Protein concentration was determined with a Nanodrop® spectrophotometer (Thermofisher Scientific, Waltham, CA). As previously described by Pinto-Almazán et al., we performed Western blot using a mouse monoclonal antibody against 3-NT (diluted 1:1500, sc-101358; Santa Cruz, Santa Cruz, CA) and horseradish peroxidase-coupled secondary antibody (diluted 1:10,000; Santa Cruz) to determine protein oxidation. 26 Immunoreactive bands were detected by using an enhanced chemiluminescence system (Merck Millipore, Burlington, MA). Intensity of protein bands was analyzed with the C-DiGit® Blot Scanner and Image Studio™ Lite Quantification Software (Li-Cor Biosciences, Lincoln, NE).
Activity of SOD
SOD enzymatic activity in plasma was evaluated using the 19160 SOD determination kit (Sigma-Aldrich, Saint Louis, MO) following the manufacturer's instructions. SOD activity was quantified by measuring the dye's color decrease at 440 nm, while activity rate was calculated with the following equation expressed as inhibition rate percentage:
GSH/GSSG ratio and catalase
GSH/GSSG ratio and catalase concentrations were quantified according to the manufacturer's instructions using the in vitro GSH/GSSG (EGTT-100) and EnzyChrom™ Catalase (ECAT-100) assay kits (Bioassay Systems, Hayward).
Statistical analysis
For data analysis, Prism 8.0 software (GraphPad, CA) was used. The Kolmogorov–Smirnov test was first executed to verify homogeneity of variance. Since data presented a normal distribution, one-way ANOVA followed by post hoc Tukey's test was executed to identify differences between groups. Spearman's correlation coefficients were executed to identify relations between anthropometric measurements and metabolic/oxidative biomarkers. P values <0.05 were considered statistically significant.
Results
Clinical characteristics of children by group are shown in Table 1. Regarding metabolic markers, we first analyzed glucose plasmatic levels. The group with underweight presented significantly higher glucose levels (88.82 ± 18.39 mg/dL) than the overweight (78.96 ± 9.52 mg/dL) and obesity (78.72 ± 7.86 mg/dL) (P < 0.05) groups. No statistical differences were observed when comparing the overweight and obesity groups with the normal weight group (84.42 ± 12.82 mg/dL) (Fig. 1A). Higher concentrations of cholesterol were observed in the underweight (158.3 ± 23.84 mg/dL) and obesity (156.1 ± 28.26 mg/dL) groups in comparison with the normal weight group (141.8 ± 12.83 mg/dL) (P < 0.05). Significant differences were also found when comparing the underweight and obesity groups with the overweight group (135.3 ± 17.74 mg/dL) (P < 0.05) (Fig. 1B). For HDL cholesterol, lower values were observed in the obesity group (40.56 ± 3.60 mg/dL) than in the normal weight group (45.64 ± 4.11 mg/dL) (P < 0.05). No other differences between groups were observed (Fig. 1C). Concerning TG levels, higher concentrations were observed in the obesity group (84.61 ± 24.85 mg/dL) in contrast to the normal weight group (61.31 ± 7.48 mg/dL) (P < 0.05). Although high concentrations were also observed in the underweight and overweight groups, differences were not statistically significant when compared with the normal weight group (Fig. 1D). In addition, higher values of INS were observed in the underweight (10.01 ± 3.46 μU/mL) and obesity groups (11.96 ± 3.41 μU/mL) compared with the normal weight group (7.36 ± 0.68 μU/mL) (P < 0.05) (Fig. 1E).

Effect of nutritional status in children aged 3–6 years on metabolic parameters.
Clinical Characteristics of the Children from the Study Groups
Data are presented as means ± SD.
Chol, cholesterol; Glu, glucose; HDL, high-density lipoprotein; HOMA-IR, homeostasis model assessment of insulin resistance; NW, normal weight; OB, obesity; OW, overweight; SD, standard deviation; TG, triacylglycerols; TyG, triacylglycerols/glucose; UW, underweight.
Regarding IR, we analyzed the TyG indexes and HOMA-IR. Higher values of TyG indexes 1 and 2 (P < 0.05) were observed in both limits of malnutrition, underweight (8.08 ± 0.32; 4.39 ± 0.16) and obesity (8.07 ± 0.29; 4.42 ± 0.16) groups when compared with the normal weight group (7.85 ± 0.17; 4.25 ± 0.09) (Fig. 2A, B). For HOMA-IR, higher values were observed for the underweight (2.29 ± 1) and obesity (2.32 ± 0.78) groups when compared with the normal weight group (1.52 ± 0.26) (P < 0.05) (Fig. 2C). For HOMA-β analysis, higher values were found in the obesity group (281.4 ± 105.3) than in the underweight (143.1 ± 51.05) and normal weight groups (160 ± 209.5) (P < 0.05). Also, statistical differences were identified between the children with overweight (223.7 ± 86.01) and underweight (P < 0.05) (Fig. 2D).
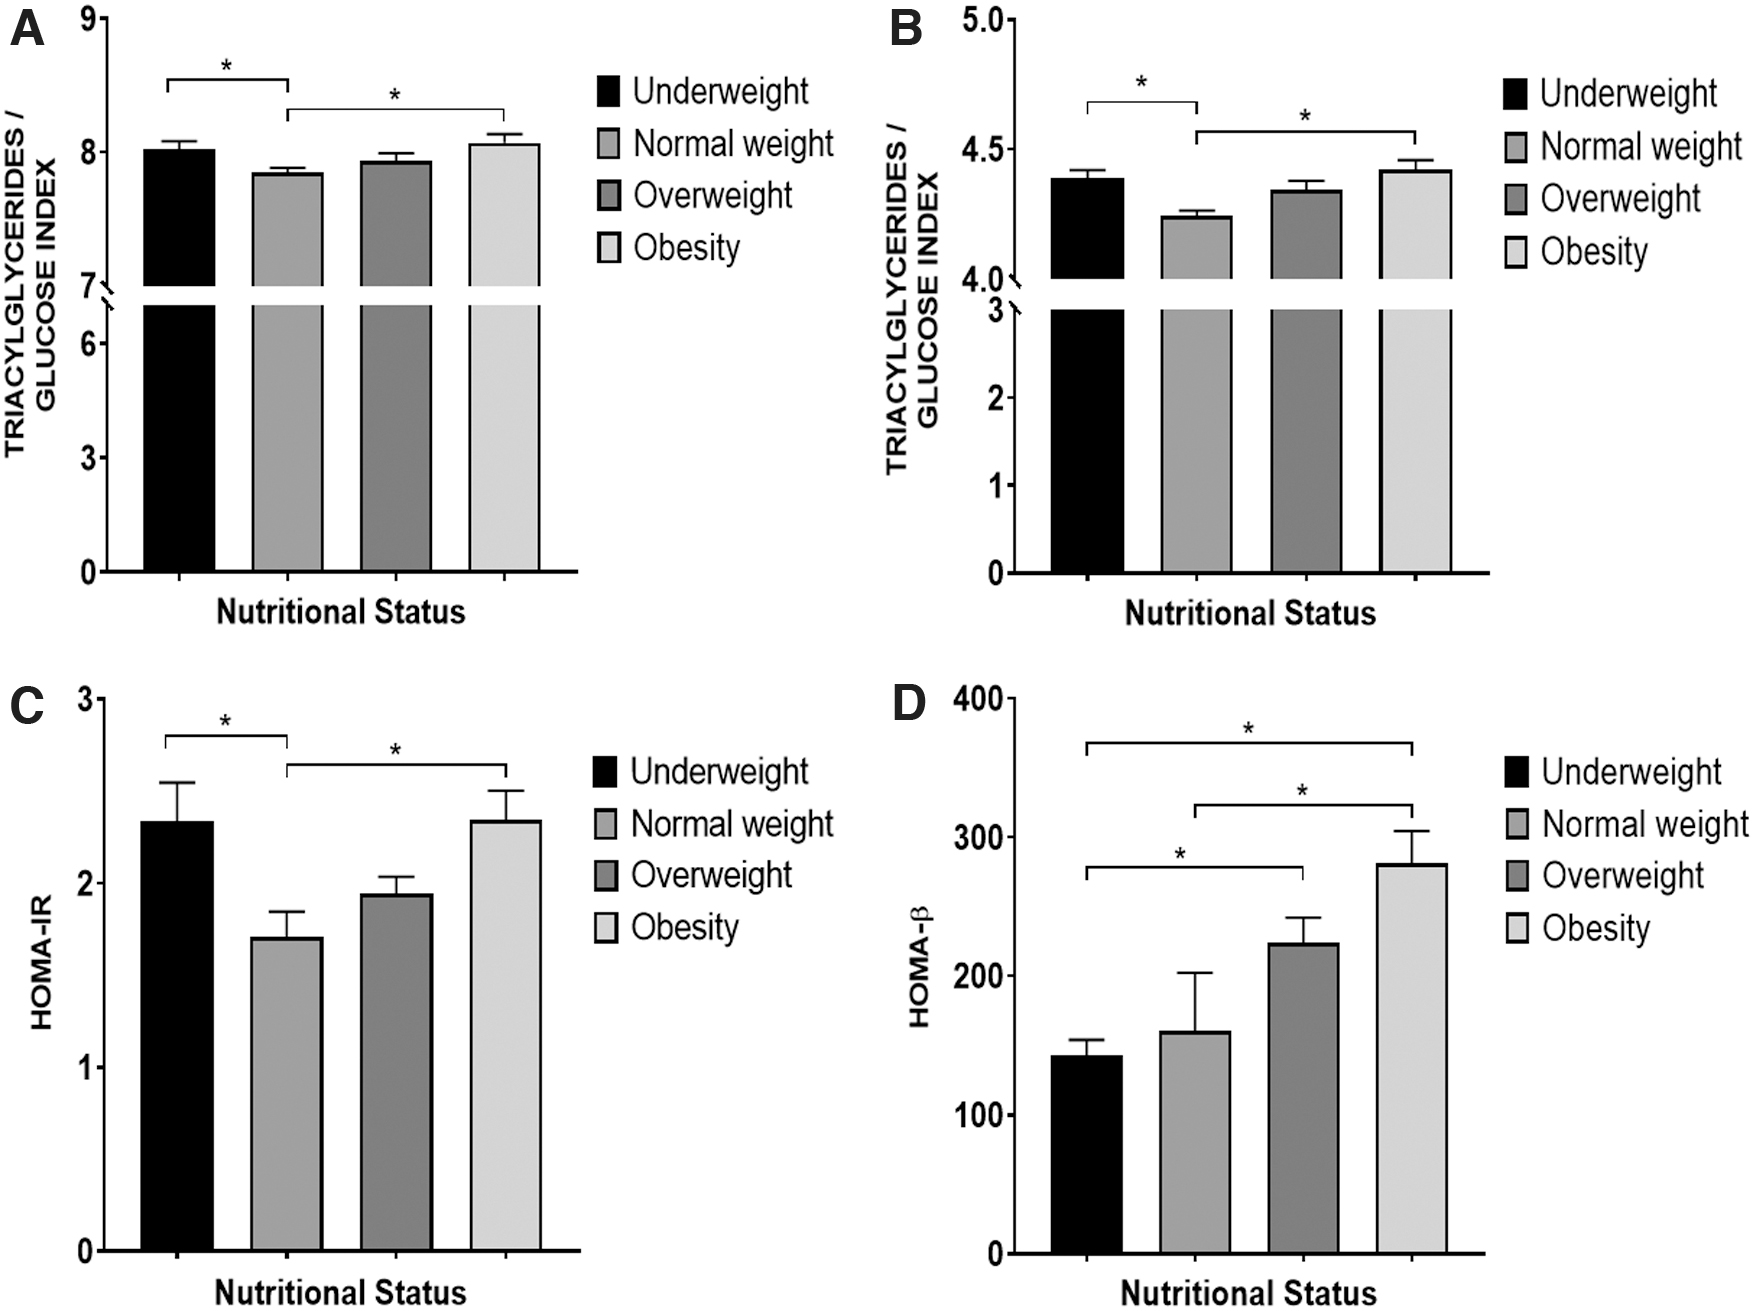
Effect of nutritional status in children aged 3–6 years on insulin resistance.
For oxidation markers, the obesity group presented significantly higher MDA levels (1.24 ± 0.09 μM) than the normal weight (1.1 ± 0.22 μM) and underweight (1.04 ± 0.25 μM) groups (P < 0.05) (Fig. 3A). 3-NT concentrations presented a similar trend to the MDA; the obesity group showed higher concentrations (1.23 ± 0.2) than the normal weight (0.92 ± 0.15) and underweight (0.83 ± 0.13) groups (P < 0.05). Also, the overweight group showed higher concentrations (1.06 ± 0.34) than the underweight group (P < 0.05) (Fig. 3B).
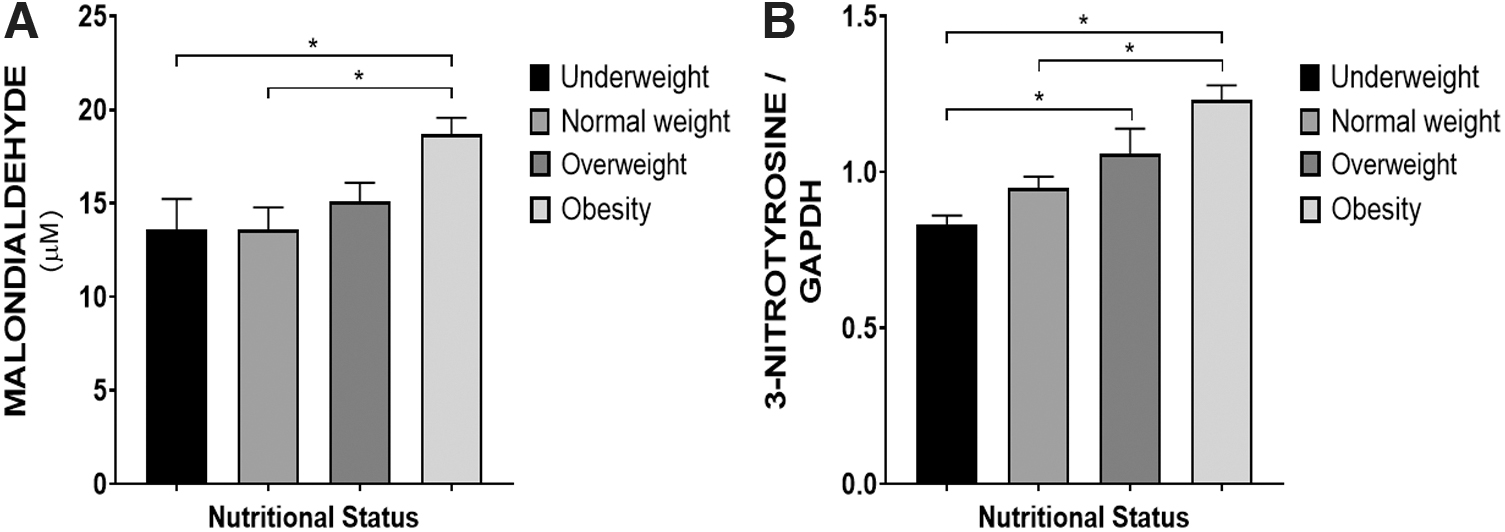
Effect of nutritional status in children aged 3–6 years on oxidative/nitrosative stress products.
Concerning endogenous antioxidants, the obesity group exhibited a significantly lower percentage of SOD activity (1.73 ± 0.22%) in comparison with the rest of the groups [underweight (1.88 ± 0.13%; P < 0.05), normal weight (1.83 ± 0.15%; P < 0.05), and overweight (1.89 ± 0.12%; P < 0.05)] (Fig. 4A). As for GSH/GSSG ratio and catalase concentrations, no significant differences were found among the studied groups (Fig. 4B, C).

Effect of nutritional status in children aged 3–6 years on endogenous antioxidants.
We also conducted Spearman's correlation analysis. Glu, Chol, HDL, INS, TG levels, TyG1 index, TyG2 index, HOMA-IR, Prot, OS, and antioxidant enzyme markers showed significant correlations with the nutritional status (Table 2).
Correlation of Nutritional Status and Metabolic/Oxidative Biomarkers
Growth standards used were the CDC PC and the BMI.
Represents statistically significant difference (P < 0.05).
3-NT, 3-nitrotyrosine; BMI, body mass pediatric index; CAT, catalase; CDC PC, Centers for Disease Control and Prevention percentiles; GSH, reduced glutathione; GSSG, oxidized gluthatione; INS, insulin; MDA, malondialdehyde; SOD, superoxide dismutase.
For the underweight group, BMI values were positively correlated with TG (r = 0.47; P = 0.04), TyG1 index (r = 0.59; P = 0.01), TyG2 index (r = 0.53; P = 0.02), HOMA-IR (r = 0.56; P = 0.02), MDA (r = −0.52; P = 0.02), and CAT (r = 0.49; P = 0.03) values. For the overweight group, two nutritional status indicators (CDC percentiles [PC] and BMI) presented significant correlation with TG, TyG1 index, TyG2 index, MDA, SOD activity, CAT, and GSH/GSSG values. For the obesity group, nutritional status indicators showed significant correlations with OS and antioxidant enzyme markers. Strong correlations were also observed with Glu, Chol, TG concentrations, TyG1 index, TyG2 index, HOMA-IR, MDA and 3-NT levels, SOD activity, CAT and the GSH/GSSG ratio (Table 2).
Discussion
Biochemical plasma markers, such as glucose concentration, lipid profile, and insulin levels, are quantified to perform a comprehensive assessment of nutritional status and metabolic alterations. 27 In this study, we quantified glucose, total and HDL cholesterol, insulin, and TG as metabolic markers, and calculated the HOMA-IR and TyG index to determine the IR.
Concerning glucose, higher levels were found in the group of children with underweight in comparison with the overweight and obesity groups. No glucose concentration differences were observed between the underweight and the normal weight groups. Previous studies have reported dysglycemia (either hypoglycemia or hyperglycemia) in children with moderate or severe undernutrition. 28 –30 According to our findings, we suggest that our underweight group presents mild and not moderate or severe undernutrition.
Based on other reports that have found high glucose levels in children with overweight or obesity, 4,31 we expected to observe a similar trend in these groups. However, our results were different probably because children with obesity show low INS sensitivity, causing impaired glucose absorption. 32,33 Consistent with our results, Sfar et al. and Chiavaroli et al. reported no significant differences in glucose values between children with obesity and children with normal weight. 34,35
Dyslipidemia is a metabolic disorder characterized by high plasma TG levels attributed to the increase in very low- and low-density lipoproteins (VLDL, LDL) and the decrease in high-density lipoproteins (HDL). 36 As in adults, dyslipidemia is also observed in children with overweight or obesity, although discrepancies regarding total cholesterol and TG concentrations have been reported in the pediatric population. 37 –39
In this study, children with obesity showed high cholesterol and TG concentrations, thus lower values of HDL cholesterol in comparison with the normal weight and overweight groups. These results are similar to those reported by Kilic et al., where children with obesity showed significant differences in lipid profiles with respect to normal weight children. 37 On the contrary, though Shashaj et al. reported an increase in TG levels and a reduction in HDL cholesterol, 38 we found no significant differences in cholesterol levels between children with normal weight and children with obesity. In addition, Rijks et al. reported high TG and cholesterol levels in children with either overweight or obesity, although no statistical differences were found between both groups. 39 Possible variables explaining the contrast between our results and those reported by other authors may involve ethnicity and/or the time that children from those studies had presented obesity.
Furthermore, several studies found no differences in cholesterol and TG concentrations between normal weight and moderate undernourished children, while a decrease in cholesterol and TG concentrations has been observed in children with severe undernutrition. 40,41 In contrast, we did not observe differences in cholesterol, HDL cholesterol, and TG concentrations between underweight children and normal weight children, probably because our underweight group only presented mild undernutrition.
Two important factors to be considered in nutritional status are INS and IR. Insulin is a key hormone for glucose uptake in cells and inhibits lipolysis, 42 while IR is related with lipid accumulation in the intramuscular and visceral compartments. 43 Also, IR alterations may cause metabolic disorders, such as diabetes, systemic high blood pressure, and heart disease. 44 In general, IR is a state in which INS exerts a suboptimal biological action. This suboptimal action leads to increased serum glucose concentrations due to the inability to regulate hepatic glucose production and glycogen degradation. 36,45 As the euglycemic–hyperinsulinemic clamp is a very sensitive but high-cost test, high-sensitivity alternatives for this analysis are the TyG indexes and HOMA-IR. Both have reported high diagnostic concordance in Mexican children. 24,45
Some studies have analyzed insulin concentration and IR in children and adolescents. 5,38,46 –52 In our study, the groups with malnutrition (underweight and obesity) showed significant higher values of insulin, TyG indexes, and HOMA-IR. In underweight children, IR could be explained as a “compensatory mechanism” to switch from an anabolic state to a catabolic state (underweight), and spend energy in the form of glucose released from the liver and free fatty acids released from adipocytes. 53 Our results concerning glucose, cholesterol, and TG concentrations in underweight children support those vital adaptations.
Some discrepancies have been reported in the formula used to calculate triacylglycerol/glucose index and the values to determine IR in preschool populations. 24,46,48,54 –61 Although only another study was conducted with children of the same age range as our sample, here we calculated the TyG index with two formulas. 48 Consistent with our results, Vieira-Ribeiro et al. reported positive associations between the total corporal adiposity, insulin concentration, and IR in children between 4 and 7 years old 48 As far as the authors know, this is the first report of the TyG index among underweight children.
Concerning HOMA-IR, Golden et al. reported higher fasting blood glucose levels and INS deficiency in children with severe undernutrition (marasmus or kwashiorkor–marasmus) compared with healthy children. Consequently, these values caused alterations in the insulin:glucose ratio, which was constantly low in children with undernutrition. 62 In addition, Martins and Sawaya reported lower INS and HOMA-β values in chronic undernourished children than in the control group. 49
Some authors have reported high HOMA-IR and HOMA-β indexes in children with obesity. 5,38,50 –52 However, only Carmona-Montesinos et al. studied children of the same age as our sample. 5 Taken together, these data suggest that malnutrition (underweight and obesity) can cause IR since an early age (3–6 years).
OS is a widely studied health indicator. 63 Although the relationship between OS and nutritional status has been extensively studied in adults, not many studies have focused on children, and even less observed in preschool-age children. 17 –23
According to our findings, children with obesity showed higher OS markers (MDA and 3-NT) concentrations in comparison with underweight and normal weight children. Consistent with these results, Carmona-Montesinos et al. reported higher MDA values in preschool children with obesity as compared with children with normal weight. 5 Although other reports have described high levels of other OS markers (isoprostanes, 19,35,64 advanced glycation products, 65 uric acid, 66 oxidized LDL 5,67 ) and relations between total oxidant and antioxidant levels, 22 most of them were conducted in school-age children.
OS is one of the main mechanisms that develop complications in people with obesity. 16 As adipocytes can accelerate the production of reactive oxygen species, 68 the chronic high concentration of free fatty acids can worsen IR by reducing insulin-dependent glucose capture. Therefore, hypercholesterolemia per se is associated with an alteration in the redox balance. 69 In adults with obesity, OS has been characterized by increased lipid peroxidation and GSSG, and decreased GSH. 5 In addition, the activity of antioxidant enzymes is suppressed in the situation of chronic or acute OS. 68,69
One of the antioxidant enzymes, SOD, catalyzes the dismutation of superoxide radical into hydrogen peroxide and prevents the formation of new FR. 16,34,37,70 In this study, SOD activity was significantly lower in children with obesity as compared with the other groups. In contrast, Erdeve et al. and Sfar et al. reported higher SOD antioxidant activity in the group with obesity as compared with children with normal weight. 34,71 A possible explanation for this contrast could be that SOD activity and the expression of its isoforms decrease once the obesity condition is established. 72
Catalase and glutathione are also endogenous antioxidants that detoxify RS by catalyzing H2O2 formation to H2O. 16,37 In our study, no differences were observed in either the GSH/GSSG ratio or CAT concentrations in the studied groups. Sfar et al. reported that the mean of glutathione peroxidase and CAT activities was not affected by the increase of BMI as well. 34 In contrast, other authors have reported changes in the thiol/disulfide antioxidant homeostasis displaced toward the oxidizing parameters in children with obesity. As glutathione is one of the main antioxidant mechanisms for the thiol/disulfide relation, GSH/GSSG ratio would present higher values in children with obesity compared with normal weight children. 22,37,73
In our research, the reason no differences were observed in either the GSH/GSSG ratio or CAT concentrations could be because children's antioxidant systems are not as impaired as in adults, and that other endogenous and exogenous antioxidants participate in eliminating FR and RS. Vehapoglu et al. reported that total antioxidant status and thiol levels were negatively correlated with age in children with obesity. 22 In addition, Leo et al. analyzed the total antioxidant plasma capacity in pediatric patients with obesity, and found that children presented lower total antioxidant capacity than the adult population with obesity. 69 Therefore, children may be more susceptible to OS than adults due to an incomplete development of the antioxidant system.
Although no significant differences were observed, a high trend in SOD activity was identified in underweight and overweight children. When superoxide anions increase, SOD activity increases to neutralize FR and prevent oxidative damage. Therefore, our results could be explained as a compensatory stage in which elevated SOD activity could prevent the increase in MDA and 3-NT levels for underweight and overweight children. However, when antioxidant systems run out, these children may be at risk of increasing the levels of OS markers.
Some studies have reported increased OS markers associated with depletion of antioxidant elements in children with undernutrition. 23,74 However, these studies were conducted in children with severe undernutrition (kwashiorkor, marasmic kwashiorkor, and marasmus). 23,33,74 –76 In such pathologies, the antioxidant system deterioration has been associated with the deficiency of various essential nutrients for protein synthesis that are related to the integrity, repair, and protection of DNA. 23 Our study was performed in underweight children but not with severe nutritional impairment as in these studies. Therefore, this could be another reason why no significant differences in OS marker concentrations were found in this group.
When correlating anthropometric indicators with metabolic and OS parameters, we observed that high CDC percentiles or high BMI in children with obesity could reflect a more positive association with quantified metabolic parameters and oxidation by-products, while a negative association was observed with the antioxidant system. For children with obesity, a more positive correlation was found between nutritional indicators, mainly CDC percentiles, and metabolic and OS biomarkers, such as Glu, Chol, TG, and TyG indexes, MDA and 3-NT, SOD, CAT, and the GSH/GSSG ratio. Conversely, in underweight children, the BMI indicator showed positive correlations only with TG, TyG indexes, and HOMA-IR, whereas negative correlations were observed with MDA and GSH/GSSG (Table 2). Consistent with our results, Kilic et al. and Elmas et al. reported a positive correlation between high BMI and total antioxidant status, while a negative correlation with the total thiol groups concentration in children with obesity. 37,73 In contrast, an inverse correlation between SOD activity, CAT values, and BMI was reported in older children with obesity, 17,34 which might also decrease the GSH/GSSG ratio and increase IR. 5 In addition, as lipid peroxidation is the most significant OS phenomenon associated with the BMI increase, higher BMI values result in higher MDA concentrations. 5,17
One of the strengths of our study is that we included four different anthropometric groups. To the best of our knowledge, this is the first study that examines the effect of nutritional status on OS in children aged 3–6 years in both sides of the spectrum of malnutrition (underweight and obesity), and overweight and normal weight categories.
Conversely, we consider that one limitation of the study is the sample size. In addition, important information for the analysis we performed was not available, such as the children's birth weight, the quality of the children's diet, the physical activity of the children, and the screen time to which they were exposed.
Conclusions
In preschool children, malnutrition, especially obesity, is associated with metabolic and OS disturbances. The design of strategies to promote the prevention of obesity is urgent, since these developmental stages are crucial to avoid potential future co-morbidities. Our results suggest high metabolic risk for future NCDs in children with malnutrition. Furthermore, children with obesity are more likely to develop adulthood obesity in comparison with normal weight children. Prevention and treatment of poor nutrition in childhood are imperative to prevent adulthood disorders, such as IR, metabolic syndrome, and cardiovascular diseases.
Footnotes
Authors' Contributions
C.E.F.-V., V.M.E.-H., and E.M.-H. collected samples from patients, conceived literature search, and carried out experiments. G.T.-P., J.J.S.-U., and R.E.M. conceived literature search, analyzed and interpreted data. R.P.-A. and C.G.-A. conceived the study design, analyzed and interpreted data. All authors were involved in writing the article, and had final approval of the submitted and published versions.
Acknowledgments
This work was submitted in partial fulfillment of the requirements for the PhD degree of Claudia Erika Fuentes-Venado at the Doctorado en Ciencias Biológicas y de la Salud Program (Universidad Autónoma Metropolitana). Claudia Erika Fuentes-Venado received financial support from CONACyT (429750) and CIS/IMSS/scholarships.
The authors would like to thank the municipality of Chiconcuac, Estado de Mexico, especially Dr. Georgina Castillo Gálvez; the Hospital General de Zona No. 197 IMSS, especially to Dr. Alfonso Cruz Hernández; the Hospital Regional de Alta Especialidad de Ixtapaluca, especially to Dr. Heberto Arboleya Casanova; and the Universidad del Valle de México Campus Texcoco for the support provided to conduct this study.
Author Disclosure Statement
No conflicting financial interests exist. The data that support the findings of this study are available from the corresponding authors, C.G.-A. and R.P.-A., upon reasonable request.
Funding Information
No funding was received for this work.