




Abstract
Background:
Using nationally representative data, we examined the age-, sex-, and ethnic-specific variation in the ratio of serum aspartate aminotransferase and alanine aminotransferase (AST-to-ALT ratio or AAR) of U.S. adults (20+ years). Understanding these subgroup differences in AAR will provide insight into population patterns of these ratios, which provide a basis for normative comparisons for the application of personalized diagnostic information to patients in the clinical setting.
Methods:
Data for this analysis are based on continuous cycles (1999–2016) of the National Health and Nutrition Examination Survey (NHANES).
Results:
Within the complete sample (n = 13,731), mean AST and ALT values were similar (∼25 U/L), with higher absolute values, but lower AAR, in males compared with females. From 1999–2000 to 2015–2016 there were consistent sex, age, and ethnic differences in the AAR. Specifically, the AAR for individuals 65+ years was markedly higher in all survey years, with subtle ethnic variation [Mexican Americans (0.95–1.04) Other Hispanic (1.0–1.09), Non-Hispanic White (1.05–1.11), Non-Hispanic Black (1.12–1.22), and Other Ethnicity (1.01–1.17)]. Sex-specific analysis reveals that the lower AAR observed among Mexican Americans is almost entirely accounted for by the markedly lower AAR in men.
Conclusion:
Future work is necessary to understand these subgroup variations in longer term studies with incident disease.
Introduction
Current estimates are that one-quarter of the world's population has the metabolic syndrome (MetS)—a cluster of cardiovascular risk factors associated with elevated risk of type II diabetes, cardiovascular disease (CVD), and all-cause mortality. 1 Although the pathogenesis of MetS is not completely understood, emerging evidence suggests that certain kidney and liver enzymes, namely aspartate aminotransferase (AST) and alanine aminotransferase (ALT), may provide helpful diagnostic and prognostic information when their concentrations are expressed as a ratio (De Ritis ratio). 2
The physiological roles of AST and ALT are well established and diverse. Both AST and ALT have the critical biological function of maintaining metabolism in a variety of tissue cells. 2 –5 In conjunction to their functional roles, AST and ALT have long been seen as biomarkers of liver injury 6 ; however, they also convey information about the physiology and pathophysiology of the liver function that improves our understanding of their interrelatedness in cardiometabolic disease and dysfunction. 2,6 Accordingly, a serum AAR above 0.8 suggests an elevated risk for nonalcoholic fatty liver disease (NAFLD), whereas AAR above 1 is suggestive of progressive liver disease. 7,8
Recent research has expanded to include investigations of the epidemiology of AAR with respect to cardiometabolic health. In a prospective cohort study of 29,316 United Kingdom primary care patients, 25 to 84 years of age with no history of CVD at baseline, male (but not female) patients with a high AAR had an increased risk of incident CVD. 9 Moreover, an increased AAR was shown to predict all-cause and cardiovascular mortality in patients with type 2 diabetes. 8
Although the biological mechanisms of the AAR–CVD relationship are not clear, 8,9 endothelial dysfunction and impaired perfusion are some common underlying mechanisms. 10 The association between AAR and CVD implies that the AAR adds insightful systemic information beyond merely reflecting liver necrosis. Indeed, an elevated AAR was also found to be associated with poor clinical outcomes for patients with acute heart failure. 10 While ethnic disparities in MetS and CVD persist, 11,12 little research to date has explored natural variations of biomarker ratios across population subgroups.
The aim of this article is to elucidate the age-, sex-, and ethnic-specific variation of AAR. Understanding these subgroup differences in AAR will yield important insight into population variation and normative values of AAR, as well as its potential to provide personalized diagnostic information to patients in the clinical setting.
Methods
Database
Data for this analysis are based on continuous cycles of the National Health and Nutrition Examination Survey (NHANES), a complex, multistage probability cluster design survey that is nationally representative of the health and nutritional status of the noninstitutionalized civilian population of the United States. 13,14 Data collection is ongoing and released to the public in biennial cycles—survey methods are described in the NHANES analytic guidelines. 13,14
Ethics was approved by the National Center for Health Statistics Research Ethics Review Board (ERB) for NHANES 1999–2004 (Protocol #98–12), NHANES 2005–2010 (Protocol #2005–06), and NHANES 2011–2016 (Protocol #2011–17). Written informed consent was obtained from all participants. Further ethics review from the York University Institutional Review Board was not required for an analysis of NHANES publicly available anonymized data.
Study sample
Nine consecutive cycles collected biennially from 1999 through 2016 of the continuous NHANES were combined to form an original unweighted sample (n = 92,062; Fig. 1). A final analytical sample of 13,731 was derived after listwise exclusion for the following: individuals under 20 years of age (n = 42,550), women with a positive pregnancy status (n = 1486), those requiring the use of mobility aids (n = 4581), overnight fasting less than 8 hr (n = 21,745), cases without fasting sampling weights (n = 3970), those reporting (yes/no) any liver (n = 636) or kidney (n = 431) conditions, and missing data for covariates to arrive at a dataset for complete case analysis.

Flowchart showing the data collection for the analytic sample.
Data collection
Items collected at household interview include information on demographic, lifestyle, physical measurements, and standard biochemistry profiles. 13 Standardized physical examinations (e.g., height, weight, body mass index [body mass index (BMI) (kg/m2), waist circumference, and blood pressure], and biospecimen (blood and urine) collection, storing, and shipping were performed by trained field health technicians in controlled environments at each mobile exam center. 13
Standard biochemistry profile
Coefficients of variation for all laboratory biomarkers were within acceptable range (<10%). 13,15 Serum ALT and AST were determined using a kinetic and enzymatic rate method, respectively. 13 Glucose concentration was determined using a hexokinase-mediated reaction method, whereas a timed-endpoint method was used for serum triglycerides. 13 In 2007, a Roche Modular P chemistry analyzer was used to measure triglycerides following a change in the laboratory site, method, and instrumentation. 13 No adjustment of triglyceride values was necessary as a result of instrumentation (2005–2006: Roche Hitachi 717 and 912 analyzers vs. 2007: Roche Modular P analyzer) or other changes.
High-density lipoprotein (HDL) cholesterol was analyzed primarily by direct HDL immunoassay or heparin manganese precipitation. 13 However, due to a change in laboratory setting and instrumentation in 2007, it was deemed necessary to correct HDL values for earlier survey years (1999–2000, 2001–2002, and 2005–2006). 13
Cardiometabolic conditions
MetS screening was defined as having at least three of the following: high triglycerides (≥150 mg/dL or 1.69 mmol/L), lowered HDL cholesterol [≤40 mg/dL or 1.03 mmol/L (males) and ≤50 mg/dL or 1.29 mmol/L (females)]; high fasting glucose [≥100 mg/dL (5.5 mmol/L) or diabetes medications]; high blood pressure (systolic ≥130 mmHg or diastolic ≥85 mmHg, or antihypertensive medications), and high waist circumference [≥102 cm (males) and ≥88 cm (females)]. 16
The liver biomarkers AST and ALT were used to determine the AAR (U/L) by computing a ratio for AST (numerator) with ALT (denominator). Referent AAR values (0.8 and 1.0), and elevated AAR value (1.5) were determined based on previous AAR research. 8,17 Serum AST and ALT values above threshold were defined based on cutoff values for normal levels 18 as follows: 37 U/L for men and 31 U/L for women for AST, and; 40 U/L for men and 31 U/L for women for ALT. To better understand the clinical value of AAR beyond established clinical thresholds of AST and ALT, we have calculated relevant test properties [sensitivity (%), specificity (%), negative (NPV), and positive predictive values (PPV)].
In this analysis, the proportion of the sample above AST, ALT, and both AST and ALT measures were used as proxies to predict values above or below the 0.8 and 1.0 AAR referent thresholds, where sensitivity {(true positive)/(true positives+false negatives)} is the ability to predict an elevated AAR; specificity (true negative/(true negative+false positives)} is the ability to correctly identify individuals with low AAR; PPV {(true positive/(true positives+false positives)} is an indication of how frequently an elevated serum enzyme level corresponds to an elevated AAR; and NPV {(true negatives/(true negatives+false negatives)} is an indication of how frequently a NPV on AST, ALT, or its combination yields a correct NPV (below threshold AAR) value.
Sociodemographic and behavioral factors
Sociodemographic characteristics of the sample include self-reported 13 age, sex, ethnicity (Mexican American, Other Hispanic, Non-Hispanic White, Non-Hispanic Black, Other/Multiethnicity), educational status (less than high school vs. high school or greater), income-to-poverty ratio (a ratio of household income to the related poverty cutoff level), alcohol consumption (“had at least 12 drinks in a year”), lifetime smoking status (“had at least 100 cigarettes in life”), general health (poor/fair vs. good/very good/excellent), health insurance coverage, frequency of hospital visits (health care utilization), and physical activity (PA).
In keeping with the NHANES protocol, PA was calculated for each participant in minutes per week using self-reports of each subdomain of PA (transport/commute, work, household, and recreation activity) and the metabolic equivalent task (MET). 13 A MET value of 4.0 was used as an average value for moderate-intensity PA, and 8.0 implied vigorous-intensity PA. Moderate- or vigorous-intensity PA was then subsequently categorized as “low” (<150 min per week), or “high” (≥150 min per week) to be consistent with current PA guidelines. 19
Statistical analysis
Our primary objective was to explore age-, sex-, and ethnic-specific variation in liver biomarkers in the United States adult population. We determined the prevalence of MetS and liver biomarkers, AST and ALT, as well as a biomarker ratio for AST and ALT (mean ± standard error of the mean), for males and females. Sociodemographic, health, and behavioral characteristics of the sample were summarized for males and females, and compared using t-tests and chi-squared analysis, as appropriate. Data analysis was performed with SAS software version 9.4 (Cary, NC), weighted with the master survey weights to ensure national representativeness of the data. Statistical significance was set at alpha = 0.05.
Results
Sociodemographic and medical characteristics of the sample are presented in Table 1. Overall, the study sample was college-educated, Non-Hispanic White, with an average age of 46 years and equal proportion of males and females. Over four-in-five participants had health insurance, whereas almost one-in-five had an income-to-poverty ratio below 1.3, where values below 1.0 are considered as the national poverty line. Over three-quarters of the sample were regular consumers of alcohol, and 46% had a history of smoking. Over 82% of the sample had at least one hospital visit in the past year, 31% had the metabolic syndrome (MetS), yet 87% rated their health as good or excellent, and ∼60% met the PA guidelines.
Characteristics of Adults (20+ years), National Health and Nutrition Examination Survey 1999–2016
P-values represent chi-square for frequencies, and independent sample t-test for continuous measures. Values in parentheses are SEM for continuous measures or SE for proportions.
ALT, aspartate aminotransferase; AST. alanine aminotransferase; SEM, standard error of the mean.
Mean AST and ALT values were both ∼25 U/L, with higher values in males compared with females, whereas the AAR was higher in females compared with males. Females also tended to be older, have a higher percentage of Non-Hispanic Black, and lower percentage of Mexican American females than males. They also tended to be better educated, have a lower percentage of regular drinkers and smokers, but lower incomes, more hospital visits, a higher percentage with health insurance, but a lower prevalence of PA guideline adherence and higher prevalence of MetS than males.
From 1999–2000 to 2015–2016, there were consistent sex (Fig. 2A), age (Fig. 2B), and ethnic (Fig. 3) differences in the AAR. Across the nine cycles, analyte ratios ranged between 0.94 (1999–2000) and 1.04 (2011–2012) for males, and 1.15 (2005–2006) and 1.20 (2009–2010) in females, maintaining a ratio difference of ∼0.20 between females and males at all cycles. Ratios also varied by ethnicity across year, but with few discernable patterns [Mexican Americans (0.95–1.04) Other Hispanic (1.0–1.09), Non-Hispanic White (1.05–1.11), Non-Hispanic Black (1.12–1.22), and Other Ethnicity (1.01–1.17)].

Variation in AST-to-ALT ratio from 1999 to 2016. Error bars represent standard error.
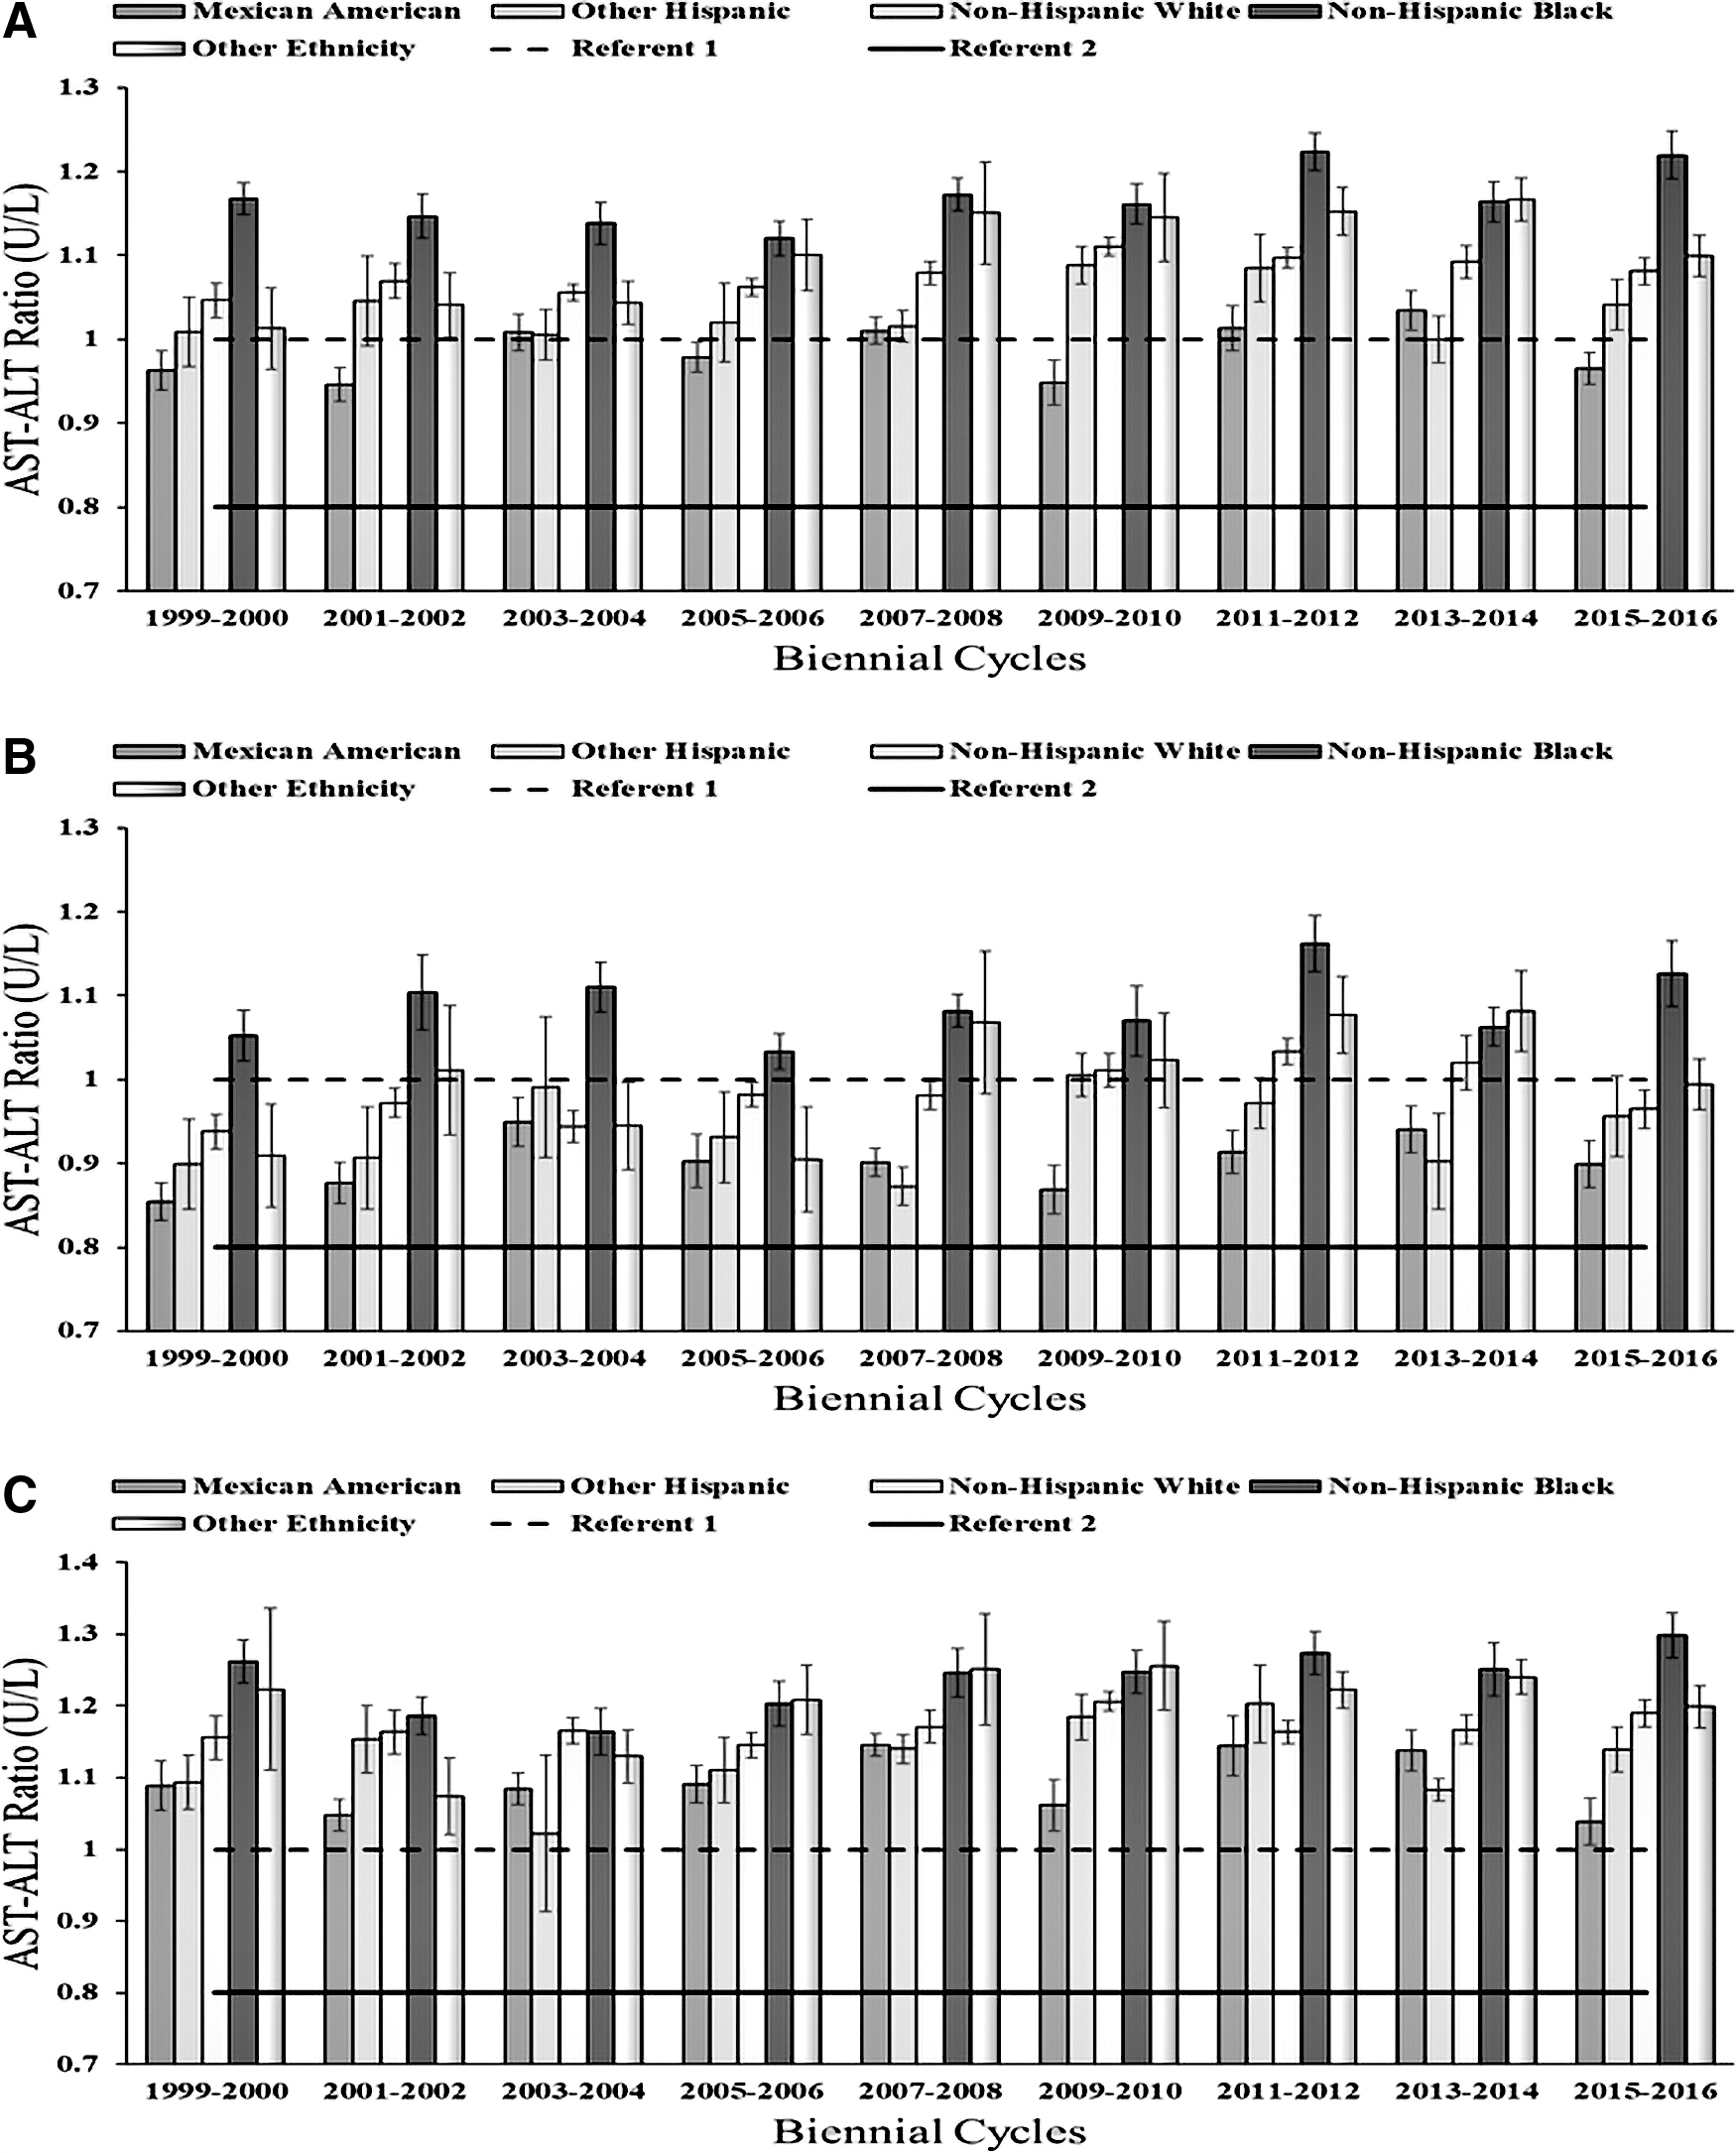
Ethnic variation in AST-to-ALT ratio; from 1999 to 2016. Error bars represent standard error.
Although there were no clear differences between 20–39-year and 40–64-year age groups across time, AAR for individuals 65+ years was markedly higher in all survey years. For all survey cycles, sex- and ethnic-specific subgroups remained above the reference value (0.8), with particularly high levels for females, 65+ age group, and Non-Hispanic Black participants, and low-levels for Mexican Americans. Sex-specific analysis reveals that this effect is almost entirely accounted for by the markedly lower AAR of male Mexican Americans (Fig. 3).
Prevalence of AST, ALT, and AAR, by sex, age, and ethnicity, are presented in Supplementary Table S1. Among the adults surveyed, 86% had both AST and ALT below threshold, and 6% had both AST and ALT above threshold. AST and ALT above threshold in isolation were 2% and 6%, respectively. Proportions of AAR below 0.8, between 0.8 and 1.0, 1.0 and 1.5, and above 1.5, were 19%, 27%, 45%, and 8%, respectively.
Disaggregated results show a higher proportion of females, older adult, and Non-Hispanic Blacks with both AST and ALT below threshold (88%, 91%, and 89%, respectively), AST above threshold (2.6%, 3.8%, and 3.1%, respectively), and AAR above 1.0 (67%, 70.7%, and 64.9%, respectively); however, a higher proportion of males and Mexican Americans had ALT (8.7% and 10.9%, respectively) and both AST and ALT above threshold (6.2% and 10.5%, respectively), and AAR below 0.8 (29%).
Supplementary Table S2 shows specificity, sensitivity, PPV, and NPV of AST and ALT alone or together. In the overall sample, established AST, ALT, and AST/ALT combined thresholds had poor sensitivity (3%–7%) and low NPV (11%–43%), regardless of AAR threshold employed. By contrast, specificity for AAR was higher for both AST and AST/ALT (83%–90%) than ALT in isolation (53%–76%). As expected, applying a lower AAR threshold (i.e., 0.8) resulted in higher PPV and lower NPV for AST, ALT, and their combination. Comparing across sex, age, and ethnicity, measures of sensitivity, specificity, NPV, and PPV were similar, suggesting comparable utility of AAR across population subgroups.
Discussion
Results of the current study demonstrate small, but consistent differences in AAR by age, sex, and ethnicity in a pooled sample of the U.S. NHANES. Overall, AAR above the reference range (0.8–1) were observed for females, Non-Hispanic Black, and older adult participants. Given that elevated AAR has been associated with heightened system-wide metabolic dysfunction, understanding patterns by subgroups may help to inform the tracking of population-level cardiometabolic health.
Clinical utility
Since the initial description of transamination reactions in 1950, 20 clinicians have been using serum measurements of AST and ALT to assess liver injury. 6 Recent research has expanded the utility of such biomarkers to reveal their association to all-cause mortality and other parameters of cardiometabolic health. 8 Examining the subgroup variation of AAR can identify high-risk demographics missed by health risk algorithms such as MetS.
Health disparities among ethnic groups are intimately linked with social disadvantage, 21 and thus understanding any meaningful clinical relationships between AAR, CVD risk, and ethnicity begins with recognizing the complex socioeconomic conditions that frame the health of subpopulations that are socially disadvantaged and medically underserved.
Incorporating ethnic-specific cutoff points for AAR as an extension of the MetS criteria may better capture the epidemiology of MetS and contribute to a reduction in cardiovascular health disparities. 11 As a component of cardiometabolic risk, the diagnostic accuracy of AAR may be improved when used in conjunction with other biomarkers implicated in metabolic dysfunction. Previous research 22 reported a nearly two-fold risk of heart failure among Framingham Study participants when serum GGT was above the 50th percentile. The potential for damage to plasma membranes with elevated GGT has also been observed in various chronic diseases. 23
Our findings suggest notable ethnic differences in AAR in each biennial cycle. Non-Hispanic Blacks in our study consistently demonstrated the highest AAR, whereas Mexican Americans had the most optimal AAR in most biennial cycles—in line with trends in cardiovascular health scores (1999–2000 to 2011–2012). 11 Despite these differences, no temporal trends in AAR were observed for any individual ethnic group. With respect to sex-specific variation, our findings suggest a marked increase from the referent value (0.8) of AAR for both females and males, with females having a higher AAR than males. This is an unusual finding, because liver disease is more prevalent in men, and the risk of NAFLD increases insulin resistance or obesity—conditions more common in men. 9
By examining the intersectionality between ethnicity and sex, our results highlight that Non-Hispanic Black men generally had the highest AAR, and Mexican American men had the lowest AAR. Earlier NHANES analyses 24 (2007–2012) have reported that Non-Hispanic Black men were less likely than Non-Hispanic White men to have MetS, and Non-Hispanic Whites tend to have a greater mean number of ideal health factors relative to Non-Hispanic Blacks and Hispanics overall. 25 Black/African American men have the highest rate of hypertension, and Black/African American women have a highest prevalence of obesity, compared with other ethnic groups in the United States. 26
Subsequently, less variation in AAR can be observed between females of different ethnicities. In four of eight biennial cycles, Mexican American females had the lowest AAR. Moreover, age-specific differences within the United States population are such that all surveyed age groups (20–39, 40–64, and ≥65 years) had a mean AAR above the referent values. In terms of age variation in AAR, no differences were observed between the 20–39-year and 40–64-year cohorts, but a marked increase in AAR above the reference range was observed in individuals ≥65 years. In a recent dose/response meta-analysis, 27 high concentrations of AAR were associated with an increased mortality rate, meanwhile AST and ALT below the 25th percentile were individually associated with a greater risk of all-cause mortality in the older segments of the population. 28
Population-based variations in AAR are important for future longer term cardiometabolic health assessments. 29 Although the incidence of MetS has increased from 1988 to 2012 for every ethnic group, the true prevalence of MetS may be underestimated. 24 Previous research notes that serum AST is higher in Black/African American men. 30 Higher AAR was associated with incident CVD 9 and CVD deaths 31 —suggesting that mild elevations are not necessarily benign. 27 Body composition, PA, and medications may contribute to the observed variations in AAR. Social and health care disparities, 29,32 including differences in chronic psychosocial stress, 33 health literacy, and clinician perceptions about race and pain management, 34 may also contribute to the AAR variations.
Research shows that implicit bias was a factor in clinician decision making that influenced pain management in patients with lower socioeconomic status. 35 Another key factor may be due to restricted health care access or lack of affordable health care. 36 Thus, the embodiment of social and health care disparities 37 warrants study. As a noninvasive diagnostic tool, AAR may provide insight into the surveillance and monitoring of CVD risk (and related comorbidities) in certain subpopulations. Future studies should include comprehensive tracking of population-level cardiometabolic health to better understand disease etiology and progression.
Limitations
A number of limitations warrant discussion. First, despite the use of established cutoffs for analyte ratios, interpretation of subgroup variation may be masked by unmeasured factors, or residual confounding related to differences in dietary intake, alcohol consumption, or pre-existing disease. Second, although we excluded participants with pre-existing disease, potential age, sex, or ethnic-based differences in the identification of liver and kidney dysfunction, access to health care, or differences in the sensitivity of these measures could have contributed to the observed variation. Finally, despite the use of replicate sample weights to ensure the representativeness of data, we cannot exclude the possibility of a healthy responder bias due to differences in response patterns of the survey and mobile exam center visit, as well as our reliance on a complete case analysis.
Conclusion
In a nationally representative sample of the U.S. (1999–2016) adults, we observed age, sex, and ethnic variation in the ratio of serum AST and ALT that are indicative of underlying kidney and liver dysfunction. Understanding population differences in analyte ratios helps in population tracking, and future investigations into opportunities for clinical intervention within established screening protocols. Future work is necessary to understand the clinical importance of these subgroup variations in longer term studies with incident disease.
Ethics Approval and Consent to Participate
Ethics was approved by the National Center for Health Statistics Research Ethics Review Board (ERB) for NHANES 1999–2004 (Protocol #98–12), NHANES 2005–2010 (Protocol #2005–06), and NHANES 2011–2016 (Protocol #2011–17). Written informed consent was obtained from all participants. Further ethics review from the York University Institutional Review Board was not required for an analysis of NHANES publicly available anonymized data. Additional details are available at:
Availability of Data and Materials
The datasets generated and/or analyzed during the current study are available from the U.S. Department of Health and Human Services, Centers for Disease Control and Prevention [
Footnotes
Authors' Contributions
All authors listed in the article made substantial contributions as defined by the International Committee of Medical Journal Editors, and have approved the final version. Study conception (A.O.), data acquisition (A.O.), data analysis (A.O.), writing (A.O., E.B., C.I.A.), interpretation of data (A.O. and C.I.A.), and editing of document (A.O., E.B., C.I.A.). All authors agree to be accountable for all aspects of the work.
Author Disclosure Statement
No conflicting financial interests exist.
Funding Information
This research did not receive any specific grant from funding agencies in the public, commercial, or not-for-profit sectors.
Supplementary Material
Supplementary Table S1
Supplementary Table S2
References
Supplementary Material
Please find the following supplemental material available below.
For Open Access articles published under a Creative Commons License, all supplemental material carries the same license as the article it is associated with.
For non-Open Access articles published, all supplemental material carries a non-exclusive license, and permission requests for re-use of supplemental material or any part of supplemental material shall be sent directly to the copyright owner as specified in the copyright notice associated with the article.
