




Abstract
Background:
The interaction of obstructive sleep apnea syndrome (OSAS) with metabolic syndrome (MetS) is known as syndrome Z. The aim of this study was to investigate the association of serum vitamin D levels with severity of OSAS in patients with Syndrome Z.
Methods:
In this retrospective study, 270 patients with MetS and OSAS were included. Demographic data, lifestyle habits, anthropometric measurements, sleep characteristics, polysomnographic indices, and laboratory results were recorded from the patient files. Multivariable logistic regression analyses were performed to determine the associations of serum 25(OH)D3 levels with OSAS.
Results:
Of the 270 patients, 71.9% were female. The mean age was 46.86 ± 8.46 (33–72) years. Of the participants, 8.2% did not have OSAS (control group), while 30.4% had mild, 28.1% had moderate, and 33.3% had severe OSAS. There were significant differences in gender, waist circumference, hip circumference, waist/hip ratio, neck circumference, body mass index, apnea–hypopnea index, total sleep time, average SpO2 and Epworth sleepiness scale score, oxygen desaturation index, blood glucose, total cholesterol, triglycerides, low-density lipoprotein cholesterol, high-density lipoprotein cholesterol, and 25(OH)D3 levels. There was a significant difference in serum 25(OH)D3 level with increasing severities of OSAS (none+mild to moderate+severe OSAS). After adjusting for potential confounding factors in multivariable logistic regression analyses, we found that serum 25(OH)D3 level was significantly associated with the severity of OSAS.
Conclusions:
Serum 25(OH)D3 level was significantly associated with the severity of OSAS in patients with Syndrome Z. Therefore, patients with MetS and OSAS should be investigated for the presence of vitamin D insufficiency and, if observed, referred for vitamin D treatment.
Introduction
Obstructive sleep apnea syndrome (OSAS) is the most common clinical syndrome caused by repetitive episodes of partial (hypopnea) or complete (apnea) obstruction of the upper airway during sleep. 1,2 OSAS usually causes recurrent oxyhemoglobin desaturation, sleep disturbance, transient but striking increases in systemic blood pressure, and increased sympathetic nervous system activity. 3 The main risk factors associated with OSAS are advanced age, male gender, family history, menopause, obesity, increased neck circumference (NC), craniofacial abnormalities, smoking, and alcohol use. 4,5 The prevalence of OSAS has been reported as 4%–5% in the general population. 6 Several conditions closely associated with obesity, such as oxidative stress, systemic inflammation, visceral fat accumulation, dyslipidemia, and insulin resistance, may appear as symptoms associated with OSAS. 7,8
The metabolic syndrome (MetS) is a risk factor for type 2 diabetes mellitus and cardiovascular disease and is characterized by abdominal obesity, arterial hypertension, high levels of triglycerides, low levels of high-density lipoprotein cholesterol (HDL-C), and increased fasting blood glucose. 9,10 It is believed that an excess of visceral adipose tissue in the body is the primary cause of cardiometabolic complications of MetS. 11 In addition, sleeping habits may contribute to abdominal obesity and consequently MetS. It has also been shown that sleep apnea increases the risk of cardiometabolic disease and that patients with MetS are prone to developing sleep apnea. 12 Abdominal obesity is a common risk factor for MetS and OSAS, and 50%–60% of patients with MetS also have OSAS. 13 However, studies have shown an obesity-independent association between OSAS and cardiometabolic risk factors such as hypertension, 14 insulin resistance, 15 and type 2 diabetes mellitus. 16 The interaction of OSAS with MetS is known as syndrome Z. 17
Vitamin D is a fat-soluble vitamin, most of which is obtained from the skin's exposure to sunlight, and is naturally present in a few foods. Vitamin D is necessary for calcium homeostasis and bone metabolism. 18 Serum 25-hydroxyvitamin D [25(OH)D] level is considered to be the best indicator for the assessment of vitamin D status in the body. 19 Vitamin D deficiency leads to an increase in the prevalence and severity of metabolic disorders, obesity, and cardiovascular diseases. 20 In a meta-analysis, it was stated that OSAS patients had lower vitamin D levels than healthy individuals. 21 In a study, vitamin D deficiency was shown to be more common in patients with severe OSAS. 22
In this study, we aimed to investigate the association between serum vitamin D levels and severity of OSAS in patients with MetS and OSAS, which would identify whether screening serum vitamin D concentration is necessary for assessing vitamin D insufficiency or even deficiency in patients with MetS and OSAS (Z syndrome).
Materials and Methods
In this retrospective study, 399 consecutive patients aged ≥18 years were seen for 2 Sleep Disorder Centers for suspected sleep-disordered breathing during a 2-year period (2017–2019). A retrospective review was performed by means of medical record analysis. Exclusion criteria included history of osteoporosis, vitamin D and calcium supplementation, conditions or intake of medications known to affect vitamin D metabolism and absorption, inflammatory diseases, cancer, and chronic liver or renal diseases. Forty patients who did not meet inclusion criteria were excluded. Out of 359 patients, 270 patients who met the criteria for MetS were included. The exclusion criteria and the number of patients excluded are given in Fig. 1. Ethical approval was provided by the local Ethics Committee (Approval Date and No. 22.01.2021/54022451-050.05.042185).
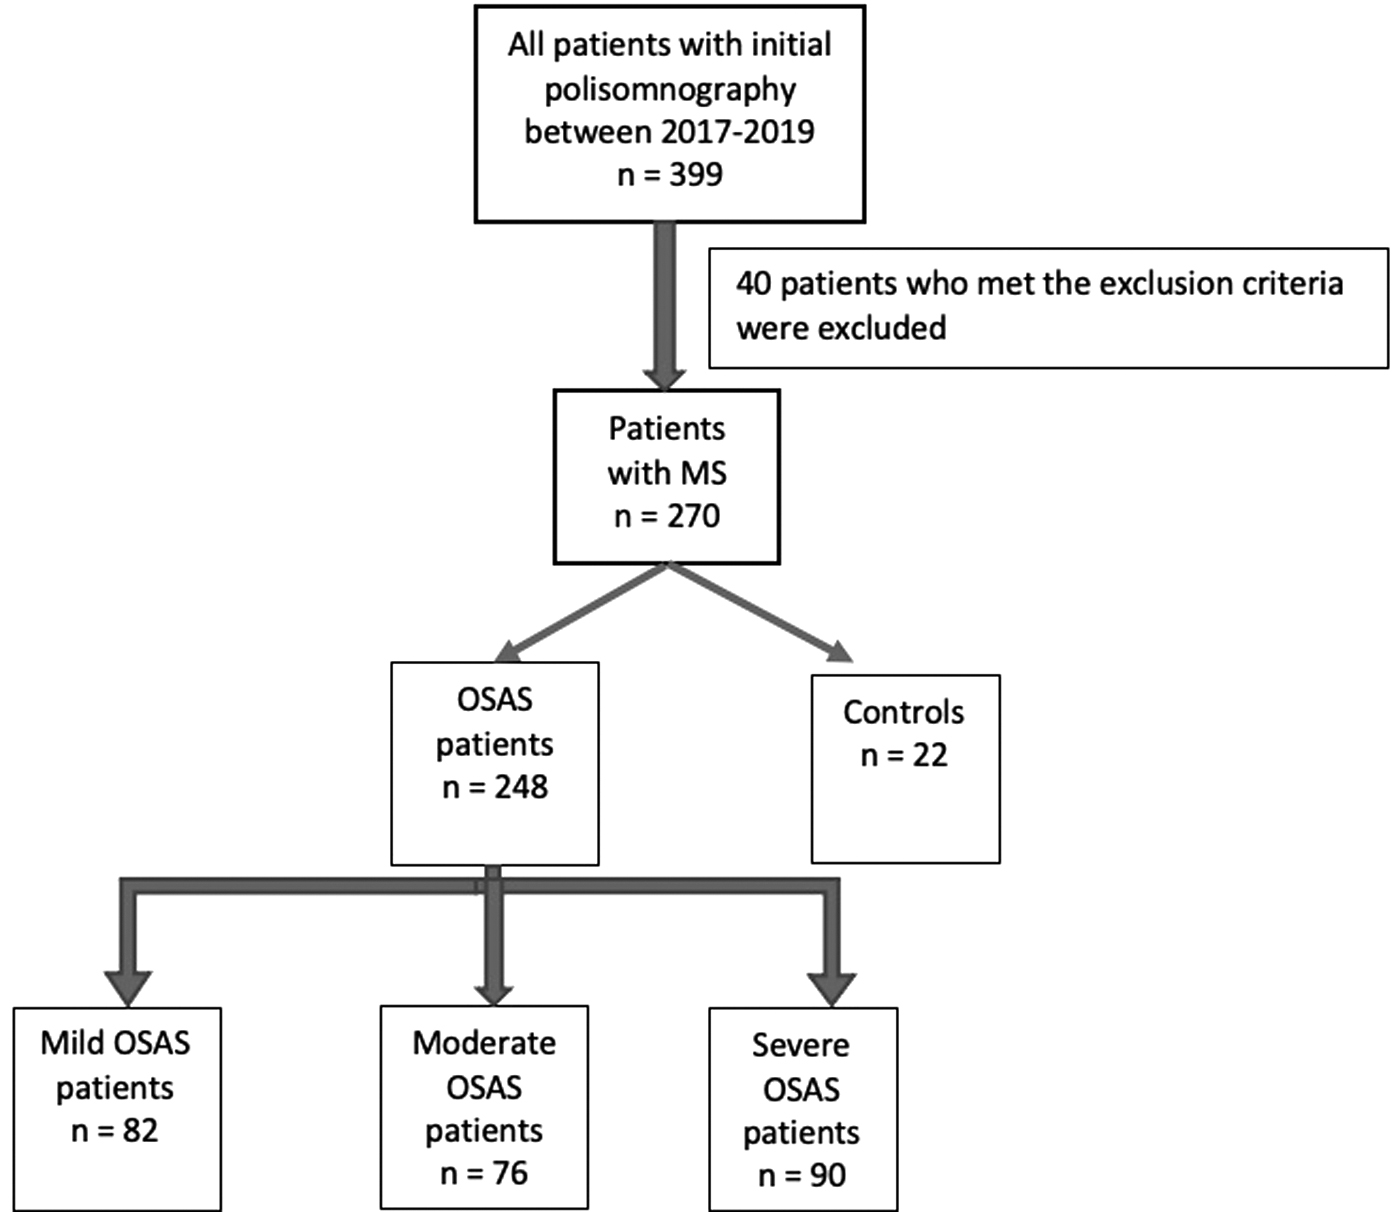
Flow chart of patients enrolled in the study. MS, metabolic syndrome; OSAS, obstructive sleep apnea syndrome.
MetS was diagnosed by the concomitant presence of at least three of the following five diagnostic criteria according to the NCEP-ATP III (National Cholesterol Education Program-Adult Treatment Panel III)-2001 criteria. 23 (1) Abdominal obesity [defined as waist circumference (WC) ≥100 cm for men and ≥90 cm for women in Turkish population], 24 (2) fasting blood glucose ≥100 mg/dL or drug treatment for increased blood glucose levels, (3) triglycerides ≥150 mg/dL or drug treatment for increased triglyceride levels, (4) HDL-C <40 mg in men and <50 mg/dL in women, (5) arterial systolic/diastolic blood pressure ≥130/≥85 mmHg or drug treatment for increased blood pressure.
Demographic data (age, gender), lifestyle habits (alcohol consumption, smoking history), anthropometric measurements [height, weight, NC, WC, hip circumference (HC)], sleep characteristics and polysomnographic indices [apnea-hypopnea index (AHI), total sleep time (TST), scores of Epworth sleepiness scale (ESS) score, average oxyhemoglobin saturation, minimum oxyhemoglobin saturation, sleep efficiency, arousal index, oxygen desaturation index (ODI)], and laboratory results were recorded from the patient files.
Body mass index (BMI) was calculated using the following formula: BMI = weight (kg)/height 2 (m). The waist to hip ratio (WHR) is obtained by dividing the WC by the HC using the same units of measurements for both.
Overnight polysomnography (Grass Technologies Comet As40 Amplifier Diagnostic Sleep System) was performed using a digital polygraph for all patients by an experienced sleep technician from 22:00 to 06:00 hr. And the electroencephalogram, electrooculogram, electromyogram, electrocardiogram, chest and abdominal wall movement, snoring, airflow, oximetry, and body position were monitored. Polysomnographic recordings were evaluated in accordance with the American Academy of Sleep Medicine Manual for the Scoring of Sleep and Associated Events. 2 Apnea was defined as a 90% reduction in airflow for at least 10 sec. Hypopnea was defined as a decrease in airflow of at least 30% for at least 10 sec with oxygen desaturation of more than 3% from baseline. 2 The apnea-hypopnea index was calculated as the total number of obstructive apnea and hypopnea per hour of sleep, and the severity of OSA was determined by AHI. 2 OSAS was classified into four subgroups according to OSA severity, as follows: normal if AHI < 5 events/hr, mild if 5 ≤ AHI < 15 events/hr, as moderate if 15 ≤ AHI <30 events/hr, and as severe if AHI was ≥30 events/hr. Patients with normal AHI served as controls. 25
Vitamin D level <20 ng/mL is defined as vitamin D deficiency, 21–30 ng/mL as vitamin D insufficiency, and >30 ng/mL as normal vitamin D level. 26
Statistical analysis
Data were presented as the mean ± standard deviation or as median (minimum–maximum) for continuous variable or number and percentage for the categorical variable. Skewness and kurtosis tests were performed for serum 25(OH)D3 level and AHI normality and found that serum 25(OH)D3 level and AHI followed the non-normal distribution. Differences between subjects (categorized by severity of OSA: none, mild, moderate, and severe) were analyzed on continuous variables using one-way ANOVA for those with normal distribution and Kruskal–Wallis test for those with skewed distribution and on categorical variables using the chi-squared test. Multivariable logistic regression analysis was used to calculate the adjusted odds ratios (ORs) and 95% confidence interval (CI) of serum vitamin D level for OSAS in different models with adjustment for potential confounders. For the multivariable logistic regression analyses, no variables were adjusted for in model 1; age, sex, regular drinking, and current smoking were adjusted for in model 2, and BMI, total cholesterol (Total-C), low-density lipoprotein cholesterol (LDL-C), and NC were further adjusted for in model 3. A two-tailed P < 0.05 was considered significant. All analyses were performed using SPSS 19 (IBM SPSS Statistics 19; SPSS, Inc., an IBM Co, Somers, NY).
Results
Of the 270 patients (OSAS and control group) included in the study, 71.9% were female, the mean age was 46.86 ± 8.46 (33–72) years. Of the participants 8.2% did not have OSAS (control group), 30.4% had mild, 28.1% had moderate, and 33.3% had severe OSAS.
Demographics, lifestyle habits, and anthropometric characteristics of the participants classified according to severities of OSAS are shown in Table 1. There were no significant differences among these four groups in age, alcohol consumption, and current smoking (P > 0.05). However, there were significant differences in gender (P < 0.001), WC (P < 0.001), HC (P < 0.001), WHR (P < 0.001), NC (P < 0.001), and BMI (P < 0.001).
Demographic, Lifestyle, and Anthropometric Characteristics of Study Subjects by Severities of Obstructive Sleep Apnea Syndrome
Values are mean ± standard deviation, median (minimum–maximum).
Kruskal–Wallis test.
Pearson chi-square.
BMI, body mass index; HC, hip circumference; NC, neck circumference; OSAS, obstructive sleep apnea syndrome; WC, waist circumference; WHR, waist to hip ratio.
Sleep characteristics of participants by severities of OSAS are shown in Table 2. There were significant differences in AHI (P < 0.001), TST (P < 0.001), average SpO2 (P < 0.001), ESS (P < 0.001), and ODI (P < 0.001).
Sleep Characteristics of Study Subjects by Severities of Obstructive Sleep Apnea Syndrome
Kruskal–Wallis test.
AHI, apnea-hypopnea index; Aver SpO2, average oxyhemoglobin saturation; ESS, Epworth sleepiness scale; ODI, oxygen desaturation index; TST, total sleep time.
Laboratory results of participants by severities of OSAS are shown in Table 3. There were significant differences in blood glucose (P < 0.001), Total-C (P = 0.001), triglycerides (P < 0.001), LDL-C (P < 0.001), HDL-C (P < 0.001), and 25(OH)D3 (P < 0.001) levels.
Laboratory Results of Study Subjects by Severities of Obstructive Sleep Apnea Syndrome
Kruskal–Wallis test.
25(OH)D3, 25-hydroxyvitamin D3; HDL-C, high-density lipoprotein cholesterol; LDL-C, low-density lipoprotein cholesterol; Total-C, total cholesterol.
Mean 25(OH)D levels of the patients were found below 30 ng/mL. Therefore, 20 ng/mL was taken as the cutoff value. Of the patients 49.6% had vitamin D deficiency, and 48.5% of them were found to have vitamin D insufficiency.
There was a little significant negative correlation between vitamin D levels and TST by Spearman correlation coefficient (r = −0.179, P = 0.003) and a little significant negative correlation between vitamin D levels and sleep efficiency (r = −0.198, P = 0.001). In addition, a fairly significant negative correlation was found between vitamin D levels and ODI (r = −0.290, P < 0.001). No significant correlation was found between Vitamin D levels and average SpO2 (r = 0.098, P = 0.11).
Association of serum 25(OH)D3 level with OSA
Since the number of patients in the control group was small, the control group and mild OSAS group were combined and compared with the moderate+severe groups. A statistically significant difference was found between the control+mild OSAS groups and the moderate+severe OSAS groups in terms of vitamin D levels (P = 0.001). Vitamin D levels were higher in the control+mild OSAS groups than those in the moderate+severe OSAS groups. Multivariable logistic regression analyses were performed to show the association of serum 25(OH)D3 level with OSAS (Table 4). In model 1 (without adjustment for any confounding factor) higher serum 25(OH)D3 level was significantly associated with higher risk of OSAS, with the adjusted OR (95% CI) of 2.382 (1.439–3.944, P = 0.001). In model 2 (with adjustment for age, gender, regular drinking, current smoking) and model 3 (with further adjustment for BMI, Total-C, LDL-C, NC), serum 25(OH)D3 level was significantly associated with risk of OSAS, with the adjusted OR (95% CI) of 2.873 (1.674–4.930, P < 0.001) and 2.966 (1.559–5.641, P = 0.001), respectively.
Association of Serum 25(OH)D3 Level with Obstructive Sleep Apnea Syndrome
Model 1 was not adjusted. Model 2 was adjusted for age, gender, regular drinking, current smoking. Model 3 was further adjusted for BMI, TC, LDL-C, NC.
CI, confidence interval; OR, odds ratio.
Discussion
In this study, after adjusting for potential confounding factors in multivariable logistic regression analyses, we found that the probability of vitamin D levels <20 ng/mL in the moderate+severe OSAS group was 2.38 times higher than it was in the control+mild OSAS groups.
In our study, we found the prevalence of Z syndrome in patients with OSAS as 76%. This result was consistent with the results of four studies (62.5%, 82%, 82.2%, 75.8%, respectively). 27 –30
Vitamin D deficiency, OSAS, and MetS share similar risk factors and comorbidities. However, studies on the relationship between OSAS severity and serum vitamin D levels have conflicting results. Several studies have found significant independent inverse relationships between serum 25(OH)D3 levels and AHI, consistent with our study. 22,31 In addition, consistent with our study, there are studies linking 25(OH)D3 concentrations with both OSAS 32 and MetS. 33
Some studies have reported lower vitamin D levels in OSAS patients than those without OSAS. In a study, it was found that serum 25(OH)D3 levels were significantly decreased in OSAS patients with MetS, 34 which was again consistent with our study.
Our results displayed that low vitamin D levels and high BMI were linked to MetS in OSAS patients. Obesity emerged as the most common risk factor and one of the main independent characteristics for OSAS, severity of OSAS, and MetS. 35 Likewise in a study, BMI was identified to be in correlation with total fat mass, abdominal fat, and visceral fat percentage, respectively. AHI was also significantly correlated with visceral fat in moderate–severe OSAS groups. Therefore, it can be concluded that severity of OSAS was more closely associated with visceral fat than BMI by reference to obesity. 36
Studies have indicated that low levels of vitamin D cause the suppression of vitamin D receptor-dependent immune response. 37,38 Vitamin D might increase insulin sensitivity and boost cytokine-induced beta cell apoptosis and impacts of inflammatory cytokines. 39 These cytokines are involved in both insulin resistance and OSAS pathogenesis.
Episodic hypoxia and reoxygenation in OSAS may lead to the formation of reactive oxygen species. 40 Obesity may also create a negative impact on vitamin D levels through several mechanisms, including lower dietary intake or low sunlight exposure, in addition to vitamin D sequestration in large fat mass, enhanced metabolic clearance of vitamin D, and decreased bioavailability. 41,42
In our study, severity of OSAS had a positive correlation with BMI, while being negatively correlated with vitamin D levels. Vitamin D deficiency may intensify the rate of systemic inflammation, as well as MetS in moderate–severe OSAS patients, who are subject to risk of vitamin D deficiency. This might occur due to their expanded adiposity. 36
In another study, it was found that there was no significant difference in vitamin D levels between OSAS patients and controls, but vitamin D levels were lower in patients with severe OSAS than in mild and moderate groups. 43 However, in our study, we found that there was significant difference in vitamin D levels between OSAS patients and controls, and when the control group and mild OSAS group were combined, vitamin D levels were found to be lower in the moderate and severe OSAS groups.
A study showed that serum 25(OH)D3 levels were lower in OSAS patients compared with controls (17.8–7.8 ng/mL vs. 23.9–12.4 ng/mL, P = 0.019). 32 In the study of Kerley et al., 22 it was shown that 25(OH)D3 levels decreased inversely with the severity of OSAS (60–33 nM for controls, 40–22 nM for mild OSAS, 3–30 nM for moderate OSAS, and 37–26 nM for severe OSAS, P = 0.003). In our study, vitamin D levels were found to be lower in the control group than mild OSAS group (21.28 ± 4.65 vs. 21.96 ± 4.68), but higher than moderate and severe OSAS groups (21.28 ± 4.65 vs. 20.57 ± 4.13 and 18.73 ± 3.83, respectively, P < 0.001).
Yassa et al. 44 found no significant difference in vitamin D levels among the OSAS groups and found no significant relationship between vitamin D and AHI. Similarly, in another study, the authors could not find a significant association of vitamin D levels with AHI. 45 In our study, unlike this study, it was found that as the severity of OSAS increased, vitamin D levels decreased.
In a study, a strong positive association was observed between OSAS severity and the indices of central obesity (i.e., BMI, WC, HC, and WHR) and polysomnographic indices (AHI and ODI). In addition, a positive association was seen with the male sex: more precisely, 87.7% of patients with severe OSAS were males. 46 These results were consistent with our study. However, in the same study, unlike our study, there was no significant difference between OSAS severity and lipid parameters (Total-C, HDL-C, LDL-C, and triglycerides) and blood glucose. Our results are consistent with the results of a study, which observed a strong positive association between OSAS severity and the indices of central obesity (i.e., BMI, WC, HC, and WHR) and polysomnographic indices (AHI and ODI). In addition, a positive association was seen with the male sex. 46 This result was consistent with our study.
In a study, when comparing WC, HC, and NC values, a significant difference was observed when grouped according to the severity of OSAS. 30 These results were consistent with our study. These findings support the view that there is a significant relationship between MetS and OSAS and obesity accompanied by an increased risk of cardiovascular disease and type 2 diabetes mellitus.
In the study of Perez et al., 30 for the sleep variables, TST and sleep efficiency, no significant difference was observed. Our results were not consistent with the results of this study. In our study, it was observed that as the severity of OSAS increased, TST and sleep efficiency decreased. Excessive daytime sleepiness is one of the consequences of OSAS. In the study of Bouloukaki et al., 47 a statistically significant relationship was found between OSAS classes and excessive daytime sleepiness, another sleep variable evaluated by ESS. Our result was consistent with the result of this study. In our study, it was observed that as the severity of OSAS increased, excessive daytime sleepiness increased.
The limitation of this study was that control group (n = 22) was rather small compared to the OSAS groups (n = 248). This is a limitation common to the published literature on this topic. Therefore, larger scale studies are necessary to better assess the true relation of vitamin D with OSAS in MetS patients.
Conclusions
According to this study, we can conclude that vitamin D insufficiency presents a high prevalence in a population with MetS and OSAS (syndrome Z). There was significant difference in serum 25(OH)D3 level with increasing severities of OSAS in patients with OSAS and MetS. Therefore, patients with MetS and OSAS should be investigated for the presence of vitamin D insufficiency and, if observed, referred for vitamin D treatment. We believe that longitudinal population studies are needed to prove the causal relationship of vitamin D with OSAS and MetS, as well as controlled randomized multicenter studies to confirm the beneficial effect of vitamin D in individuals with OSAS and MetS.
Footnotes
Authors' Contributions
G.D.I.: Processing and preparation of the collected information, critically and intellectually evaluating the content of the article, analysis of the content of the article. Literature search and analysis, design, concept, writing and reviewing of the article.
H.C.: Statistical evaluation of the article data and the arrangement and interpretation of these data, literature search and analysis, design, concept, writing and reviewing of the article, case collection.
A.K.: Evaluating the accuracy of the data, regulation of the presentation of the information and data in the article, data gathering and workflow planning, forming the general lines and framework of the study, literature search and analysis, design, concept, writing and reviewing of the article.
Acknowledgment
The authors are grateful to Assoc. Prof. Dr. Timur Kose for statistical analyses.
Author Disclosure Statement
No conflicting financial interests exist.
Funding Information
No funding was received for this article.