




Abstract
Background:
Pentraxin 3 (PTX3) is an acute-phase protein, which resembles C-reactive protein in both structure and function, and belongs to the same family. PTX3 is associated with cardiovascular diseases, obesity, and metabolic syndrome (MetS). This study evaluated the relationship between serum PTX3 levels, prediabetes, newly diagnosed type 2 diabetes mellitus (T2DM), and other biochemical and clinical parameters in obese patients with nonalcoholic fatty liver disease (NAFLD).
Methods:
A total of 77 obese patients with NAFLD were included. Forty-seven of them were with normal glucose levels and 30 were with glycemic disorders, including prediabetes and newly diagnosed T2DM. Serum PTX3 was measured using ELISA method.
Results:
Higher PTX3 serum levels were found in patients with prediabetes and T2DM compared with those with normal blood glucose (2321.29 ± 926.63 vs. 1877.03 ± 895.45 pg/mL, P = 0.028). There were significant correlations between PTX3 and alanine aminotransferase (P = 0.018), gamma-glutamyl transferase (P = 0.005), and neuropathy disability score (P < 0.05). The presence of hypertension, dyslipidemia, insulin resistance, and MetS, as well as the number of components of the MetS did not affect PTX3 levels.
Conclusions:
PTX3 serum levels were higher in an obese subject with NAFLD with prediabetes and T2DM.
Introduction
Nonalcoholic fatty liver disease (NAFLD) is one of the most common liver diseases worldwide. It spans across a histological spectrum ranging from simple steatosis to nonalcoholic steatohepatitis (NASH), advanced fibrosis, and cirrhosis. 1 The relationship between NAFLD and metabolic syndrome (MetS) is bidirectional and has led to the creation of a new concept in hepatology and metabolic diseases, defined as metabolic-associated fatty liver disease (MAFLD). 2,3 Nevertheless, NAFLD and MAFLD are not entirely equivalent and MAFLD remains a controversial disease entity. 4 Type 2 diabetes mellitus (T2DM) is recognized as one of the most significant health problems in the world and there is incontestable evidence that T2DM may worsen liver disease. 5 Vice versa, many prospective studies indicate that NAFLD can be a key risk factor for the development and progression of T2DM involving many inflammatory factors, such as interleukin-6, tumor necrosis factor-α, Retinol-binding protein 4 (RBP4), C-reactive protein (CRP), and others. 6,7
Pentraxin 3 (PTX3) has recently been identified as an acute-phase reactant that resembles CRP in both structure and function and belongs to the same family. 8 PTX3 is produced and released by multiple different cell types, such as adipose cells, endothelial cells, macrophages, skeletal muscle, and vascular smooth muscle cells, in response to tissue injury or inflammation. 9 Elevated serum PTX3 levels have been reported in a number of acute and chronic diseases, including acute myocardial infarction, vasculitis, heart failure, and others. 10 Similarly, elevated PTX3 levels have been reported in diabetic polyneuropathy patients with nociceptive pain and contribution in diabetic nephropathy but its mechanism of action still remains unclear. 9,11 Serum PTX3 concentrations were found to be significantly higher in patients in advanced stages of NASH, with higher levels correlating with the severity of liver fibrosis. 12 However, the literature data on the association between PTX3 and glycemic disorders in the setting of NAFLD are still scarce and cannot rule out any possible molecular relation of PTX3 with the pathophysiology of MetS and prediabetes with their related dysregularities. 13
The aim of the present study was to evaluate the relationship between serum PTX3 and prediabetes, newly diagnosed drug-naive T2DM, and other biochemical and clinical parameters in obese patients with NAFLD. We also aimed to evaluate the relationship between PTX3 and established score systems for fibrosis in NAFLD, including FIB-4, APRI, and enhanced liver fibrosis (ELF) as well as with some parameters of micro- and macroangiopathy.
Methods
Study population
A total 77 patients with obesity and NAFLD were included in the study (7 male, 70 female; mean age 50.8 ± 11.05 years). The diagnosis of NAFLD was based on the following criteria: ultrasonographic evidence of steatosis 1 ;—body mass index, BMI ≥30 kg/m2); prediabetes [impaired fasting glucose (IFG), and/or impaired glucose tolerance (IGT)] and/or T2DM (WHO/IDF 2006 criteria), for which they have not taken medication; in the absence of secondary cause of hepatic steatosis, notably including absolute alcohol consumption >20 grams daily for females and >30 grams daily for males. Criteria for exclusion were as follows:—advanced hepatic fibrosis (fibrosis stage 4 score (FIB-4) <1.30 and APRI score (AST to Platelet Ratio Index) <0.5) estimated with an online calculator and ELF score <9.814; chronic kidney disease (defines as eGFR calculated by CKD-EPI formula <60 mL/min/1.73 m2); heart failure or ischemic heart disease; vasculitis; hypothyroidism; or any proven neoplastic disease.
The subjects were divided into two groups. Group 1 included 47 obese NAFLD patients with normal glucose tolerance (NGT). Group 2 included obese NAFLD patients with prediabetes/T2DM. The study protocol was in accordance with the Helsinki Declaration of human rights and was approved by the local Ethics Committee and all study participants signed an informed consent form.
Methods
Anthropometric parameters as weight (kg), height (m), BMI (kg/m2), waist and hip circumference (cm), and arterial blood pressure (mmHg) were measured by standard criteria. Waist-to-hip ratio (WHR) and waist-to-stature ratio (WSR) were calculated. Visceral adiposity index (VAI) was calculated using the established formula: VAI = [WC/(36.85+(1.89 × BMI)] × [triglycerides (TG)/0.81] × [1.52/high-density lipoproteins (HDL)] for females and VAI = [(WC/(39.68+(1.88 × BMI)] × (TG/1.03) × (1.31/HDL) for males. VAI was validated as a tool for assessment of cardiometabolic risk by means of magnetic resonance imaging and euglycemic hyperinsulinemic clamp. 14 Body fat percentage (%) was estimated by means of body impedance by a TANITA™ TBF-215 GS Body Composition. An OGTT with 75 grams of glucose after an overnight fast with measurement of glucose and insulin on 0, 60, and 120 min after glucose ingestion was performed. Subjects were considered to have IFG if fasting plasma glucose was ≥6.1 and <7.0 mmol/L, and to have IGT if plasma glucose on 120th minute of OGTT was ≥7.8 and <11.1 mmol/L. T2DM during OGTT was diagnosed with fasting blood glucose >7.0 mmol/L and/or plasma glucose on 120th minute of OGTT was ≥11.1. Glucose disorders and MetS was diagnosed following the WHO and IDF criteria. 15,16 Homeostatic model assessment for insulin resistance (HOMA-IR) was calculated, using the following formula: HOMA-IR = fasting plasma glucose (mmol/L) Xfasting serum insulin (mIU/mL)/22.5. Insulin resistance (IR) was defined as a value of HOMA-IR >2.5. 17
To assess subclinical atherosclerosis and peripheral artery disease, we used the following noninvasive methods: (1) Intima–media thickness (IMT) measurement of the common carotid artery by Cardio Health Station (Panasonic Corporation, Osaka, Japan); (2) ankle–brachial index (ABI, represents the ratio between the systolic blood pressure at the ankle and the upper
For statistical analysis, the data were processed using the statistical package IBM SPSS Statistics version 25.0. The following statistical methods were applied: variation, descriptive and graphic analyses; Kolmogorov–Smirnov's and Shapiro–Wilk tests; analysis of variance for two independent samples; Mann–Whitney's nonparametric test for two independent samples; and correlation analysis and receiver operating characteristic (ROC) curve analysis. The level of significance for rejecting the null hypothesis was P < 0.05.
Results
The clinical and biochemical characteristics of the NAFLD/NGT patients and NAFLD/prediabetes and T2DM patients are shown in Tables 1 and 2. There was no significant difference in age, BMI, hip and WHR between the two groups. No significant difference also existed in levels of fat mass, SBP, DBP, TC, and LDL-C between the groups. Significantly higher levels of waist, WSR, VAI, very-low-density lipoproteins, TG, plasma glucose, and insulin in OGTT, HOMA-IR, as well as lower levels of HDL was found in obese NAFLD patients with prediabetes and T2DM (group 2) than in NAFLD/NGT (group 1). Using correlation analysis, PTX3 was positively correlated with alanine aminotransferase (P = 0.018) and gamma-glutamyl transferase (p = 0.005.). In obese subjects with NAFLD, PTX3 serum levels were higher among those with either prediabetes or T2DM compared with those with NGT (2321.29 ± 926.63 vs. 1877.03 ± 895.45 pg/mL, P = 0.028) (Fig. 1). ROC analysis revealed that serum PTX3 could be used to distinguish subjects with prediabetes/T2DM in the study group (area under the curve = 0.650; P = 0.028 as a cutoff value of ≥1553.5 pg/mL had sensitivity of 80% and specificity of 60%) (Fig. 2). From the studied parameters of subclinical atherosclerosis and peripheral artery disease we found a weak positive correlation only between PTX3 and NDS (Table 3). There was no correlation between PTX3 and fibrous scores FIB-4, APRI, as well as with ELF score.

PTX3 between patients with and without glucose disturbances (2321.29 ± 926.63 vs. 1877.03 ± 895.45 pg/mL, *P = 0.028). PTX3, Pentraxin 3.
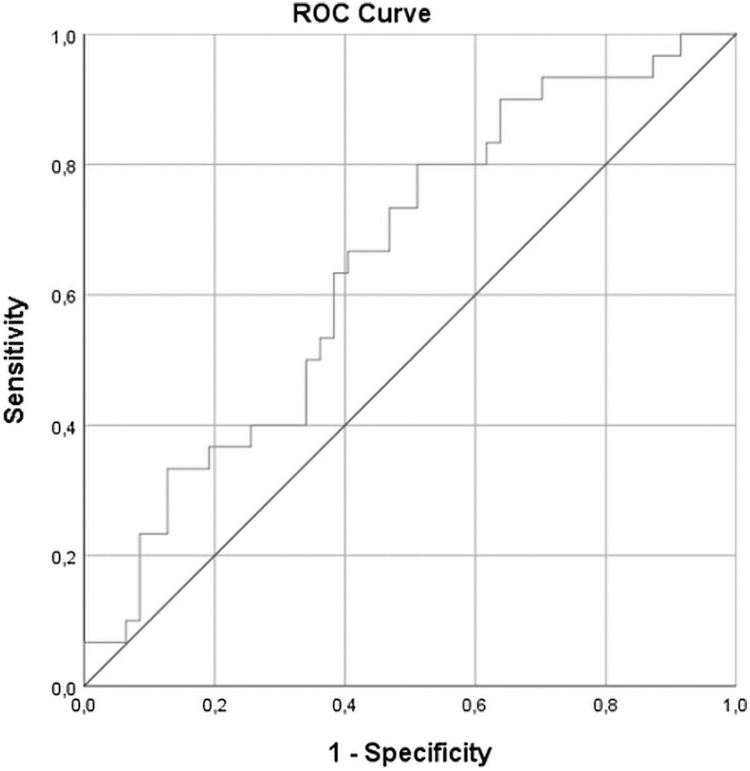
ROC analyses determined circulating PTX3 to be a value for differentiating subject with carbohydrate disturbances (AUC = 0,650; P = 0,028 as a cutoff value of ≥1553.5 had sensitivity of 80% and specificity of 60%). AUC, area under the curve; ROC, receiver operating characteristic.
Comparative Analysis Between the Groups According to Age and Anthropometric Parameters
Significant values are in bold; P < 0.05.
BMI, body mass index; NGT, normal glucose tolerance; SD, standard deviation; T2DM, type 2 diabetes mellitus; VAI, visceral adiposity tissue; WHR, waist-to-hip ratio; WSR, waist-to-stature ratio.
Comparative Analysis Between the Groups According to Arterial Pressure and Metabolic Parameters
Significant values are in bold; P < 0.05.
ALT, alanine aminotransferase; AST, aspartate aminotransferase; DBP, diastolic blood pressure; GGT, gamma-glutamyl transferase; Glu0, glucose at the zero minute; Glu 60, glucose at the sixties minutes; Glu120, glucose at the one hundred and twenty minutes; Insulin0, insulin at the zero minute; Insulin 60, insulin at the sixties minutes; Insulin120, insulin at the one hundred and twenty minutes; HDL, high-density lipoproteins; HOMA-IR, homeostatic model assessment of insulin resistance; LDL, low-density lipoproteins; SBP, systolic blood pressure; TG, triglycerides; VLDL, very-low-density lipoproteins.
Correlation Analysis Between Parameters of Subclinical Atherosclerosis and Peripheral Artery Disease and PTX
Significant values are in bold; * P < 0.05.
ABI, Ankle–brachial index; ANR, autonomic neuropathy risk; IMT, intima–media thickness; PTX3, Pentraxin 3; NDS, neuropathy disability score; VPT, vibration perception threshold.
Discussion
The results of this study demonstrated higher plasma PTX3 levels in the NAFLD patients with prediabetes/T2DM in a comparison with the NAFLD patients without glycemic disorders independent of MetS and MetS components. We have also demonstrated that PTX3 levels were correlated with NDS in patients with NAFLD. To the best our knowledge, this is the first study that evaluated the association between serum PTX3 concentrations and the early stages of glucose disorders and micro and macrovascular parameters in patients with NAFLD. Moreover, we excluded patients with advanced fibrosis using established, noninvasive methods, including ELF, FIB-4, and APRI. Several studies reported that serum PTX3 concentrations are significantly higher in patients with advanced NASH, and higher levels correlated with the severity of liver fibrosis. 12,20 Ozturk et al. demonstrated that elevated plasma PTX3 levels are associated with the presence of fibrosis in patients with NAFLD, independently of MetS components and fibrosis predictors. 12 The authors suggest that PTX3 may be a useful marker in understanding the relationship between fibrotic changes in NAFLD and subclinical atherosclerosis, and that the presence of fibrosis in patients with NAFLD may be a risk factor for atherosclerosis.
Except acute phase reactant that resembles CRP and belongs to the same family, PTX3 is also identifiable as a marker for local vascular inflammation. 21 Therefore, it came as no surprise that PTX3 levels have been associated with unstable angina, myocardial infarction, heart failure, and cardiovascular mortality. 22 It has been well established that NAFLD is an independent risk factor for cardiovascular diseases and when combined with glucose disorders, the cardiovascular risk increases proportionately. In our research, we did not find correlation between PTX3 and CV parameters, such as IMT, ABI, ANR, and VPT, except NDS as a marker to screen for diabetic peripheral neuropathy and indirectly for microangiopathy. This shows that in the earliest stages of NAFLD there is still no significant involvement of the CV system and this is a favorable time to correct both liver and glucose disorders. Salcini et al. demonstrated that PTX3 may contribute to the onset of nociceptive pain in diabetic patients, and this may throw light on underlying mechanisms of the pathways leading to discrimination between neuropathic pain and nociceptive pain. 11 They found that PTX3 levels were significantly higher in diabetic patients compared with controls (P = 0.03) and, which is essential, and patients with nociceptive pain had significantly higher PTX3 levels compared with patients with neuropathic pain (P < 0.05). 11 PTX3 has also been studied in other microvascular complications of T2DM, including diabetic nephropathy and the relationship between PTX3 and various renal diseases is a hot topic. Initially, PTX3 was thought to have a potential pathogenic effect as a proinflammatory peptide. 23 However, the recent studies had shown that PTX3 does not lead to kidney damage, and elevated plasma PTX3 concentration is likely a marker of immune inflammatory response and this is physiologic protective mechanism with anti-inflammatory and protective effect on the kidneys. 24 Chen et al. demonstrated in rat models that the expression of PTX3 in the kidney was significantly decreased in the diabetic nephropathy group, but the mechanism of this phenomenon is still unclear. 9 Due to the expression of PTX3 in the renal tubules, they hypothesize that renal tubular epithelial cell apoptosis and progressive loss result in the gradual decline of PTX3 secretion. Future studies are needed to fully clarify the potential involvement of PTX3 in the pathogenesis of kidney disease. Zanetti et al. reported that hs-CRP and PTX3 levels were higher in patients with MetS, and they suggest that this increase was associated with inflammation and subclinical atherosclerosis. 25 Another study also found that PTX3 levels was significantly higher in patients with MetS, and that serum PTX3 levels increased with increasing components of MetS. 8 Our results showed that the presence of hypertension, dyslipidemia, MetS, and IR did not affect PTX3 levels. This can be explained by some limitation of the study, including cross-sectional design of the project, failure to use logistic regression analysis, and to quantify steatosis with semiquantitative ultrasonographic indices. Some strengths of this study are that all patients were without significant fibrosis from the studied fibrous scores, where higher levels of PTX3 are typically observed, and with early carbohydrate disorders without any interfering medications.
Conclusion
PTX3 serum levels were higher in obese subjects with NAFLD with prediabetes and T2DM compared with NAFLD without glucose disorders. There was no significant difference in PTX3 levels between patients with and without MetS, arterial hypertension, dyslipidemia, and IR. There was no correlation between PTX3 and CV parameters, such as IMT, ABI, ANR, and VPT, except NDS as a marker to screen for diabetic peripheral neuropathy and indirectly for microangiopathy. Elevated levels of PTX3 might be considered as a noninvasive molecular biomarker defining metabolism in obese patients with NAFLD. Further experimental and clinical studies are necessary to confirm these hypotheses.
Footnotes
Author Disclosure Statement
No conflicting financial interests exist.
Funding Information
The study was funded by the Medical University of Sofia and performed at University Hospital Alexandrovska, Sofia, Bulgaria, Project No. 4728/19.07.2017. Contract No. D-233/2017.