




Abstract
Background:
Obesity and nonalcoholic fatty liver disease are strongly associated with type 2 diabetes mellitus (T2DM), affecting insulin sensitivity and β-cell function. They interact, exacerbating the development of hyperinsulinemia to T2DM.
Methods:
Through oral glucose tolerance and insulin secretion tests, the relationships between insulin sensitivity and secretion, glucose clearance, body mass index (BMI), and fatty liver were studied in newly diagnosed T2DM patients. The homeostasis model assessment of insulin resistance (HOMA-IR), homeostasis model assessment of β-cell function (HOMA-β), insulin sensitivity index (ISI), and metabolic clearance rate (MCR) of glucose were calculated to analyze insulin sensitivity and β-cell function.
Results:
There were no differences in HOMA-IR, HOMA-β, first-phase insulin secretion (1st PH), second-phase insulin secretion (2nd PH), ISI, or MCR between lean fatty liver and lean nonfatty liver patients. Both overweight/obesity (ow/ob) and patients with fatty liver increased HOMA-IR, and decreased ISI and MCR. In the ow/ob subgroup, patients with fatty liver had severe insulin resistance but greater HOMA-β, 1st PH, and 2nd PH than individuals with nonfatty liver. The difference in MCR between fatty liver and nonfatty liver groups was not significant.
Conclusion:
BMI and hepatic steatosis are independent determinants of increased insulin resistance and decreased MCR. However, it is steatosis, not BMI, related to the increase in insulin secretion.
Introduction
Type 2
Both overweight/obese-NAFLD (ow/ob-NAFLD) and nonobese NAFLD are strongly associated with metabolic dysfunction. Lean-NAFLD patients are more likely to have central obesity, and are more strongly associated with diabetes, hypertension (HTN), and metabolic syndrome (MetS) than ow/ob-NAFLD patients. 5 Currently, fatty liver disease is referred to as metabolic-associated fatty liver disease when associated with obesity, T2DM, or metabolic dysfunction. 6
T2DM may develop due to the interaction between BMI and NAFLD in these patients. Differences in BMI and NAFLD progress may result in variations in their metabolic profiles in the onset of T2DM. The metabolic components of newly diagnosed T2DM patients were investigated through an oral glucose tolerance test (OGTT) and insulin secretion test to determine the interactive influences of BMI and fatty liver on insulin secretion and sugar metabolism.
Materials and Methods
This case–control study was undertaken at the Sir Run Run Hospital, Nanjing Medical University. A total of 144 newly diagnosed T2DM patients were included in the study. The diagnostic criteria for DM were based on the China 2020 Diabetes Prevention and Control Guidelines. All participants were between 18 and 70 years old and had developed T2DM within the preceding 12 months.
The exclusion criteria included acute complications of diabetes, including diabetic ketosis, hyperglycemic hyperosmolar coma, and infections; additional medical conditions, including malignancy, cardiac failure, cirrhosis, end-stage renal disease, and chronic obstructive pulmonary disease; any trauma requiring hospitalization, surgical intervention, or malignant tumors; use of antidiabetic medication or medication that alters insulin sensitivity, such as prazosin, diuretics, steroids, or oral contraceptives within 3 months before study enrollment; alcohol abuse (defined as ethanol intake >70 g/week for women and >140 g/week for men); liver disease other than NAFLD such as autoimmune diseases, drug-induced liver disease, or viral hepatitis; gestational diabetes or other endocrine disorders, including thyrotoxicosis, acromegaly, prolactinoma, hypopituitarism, adrenal insufficiency, Cushing's disease, or any other syndrome characterized by the presence of T2DM; and any diagnosed mental or psychological disorders.
The Chinese classification of obesity was used in this study, with BMI divided into three categories: lean (18.5–23.9 kg/m2), overweight (24–27.9 kg/m2), and obese (28 kg/m2). Ultrasound images were used to determine fatty liver. Insulin sensitivity was determined using the homeostasis model assessment of insulin resistance (HOMA-IR), 7 Matsuda composite insulin sensitivity index (Composite ISI), 8 and Stumvoll insulin sensitivity index (Stumvoll ISI). 9
Insulin secretion was determined using the homeostasis model assessment of β-cell function (HOMA-β), 7 Stumvoll first-phase (1st PH), 10 and Stumvoll second-phase (2nd PH) 10 assays. The disposition index (DI) 8 and metabolic clearance rate (MCR) of glucose 9,10 were calculated to estimate glucose regulation ability. The NAFLD liver fat score (NAFLD-LFS) was used to quantify liver steatosis. 11
Age, sex, BMI, systolic blood pressure (SBP), diastolic blood pressure (DBP), menstrual status (female), and the medical history of patients were collected. The participation of menopausal women was controlled, and none received hormone replacement therapy during this study. Subjects received 75 grams OGTT, and blood samples were collected at 0, 30, 60, 120, and 180 min to measure plasma glucose and insulin concentrations.
Participants were told not to drink tea, coffee, or smoke and remained seated for the entire duration of the OGTT. Plasma concentrations of alanine aminotransferase (ALT), aspartate aminotransferase (AST), uric acid (UA), glycosylated hemoglobin (HbA1c), total cholesterol (TC), triglyceride (TG), high-density lipoprotein cholesterol (HDL-C), and low-density lipoprotein cholesterol (LDL-C), C-reactive protein (CRP), albumin/creatinine ratio (Alb/cr) were measured.
The formulas used to quantify results were as follows:
HOMA-IR: Gluc0 × Ins0/22.5/6.965
HOMA-β: 20 × Ins0/6.965/(Gluc0 − 3.5)%
Stumvoll first phase (1st PH):
2032 + 4.681 × Ins0 − 135 × Gluc120 + 0.995 × Ins120 + 27.99 × BMI −269.1 × Gluc0
Stumvoll second phase (2nd PH):
277 + 0.8 × Ins0 − 42.79 × Gluc120 + 0.321 × Ins120 + 5.338 × BMI
MCR: 19.240 − 0.281 × BMI −0.00498 × Ins120 − 0.333 × Gluc120
Stumvoll insulin sensitivity index (Stumvoll ISI): 0.222 − 0.00333 × BMI −0.0000779 × Ins120 − 0.000422 × age

Disposition index (DI) = IGI60 × Composite ISI
NAFLD-LFS = −2.89 + 1.18 × MetS (yes = 1/no = 0) + 0.45 × T2DM
(yes = 2/no = 0) + 0.15 × insulin (mU/L) + 0.04 × AST(U/L) + 0.94 × AST/ALT
Statistical analysis
The data were analyzed using SPSS 23 software. Statistically significant differences between two groups of continuous variables were determined using Student's t-test or the Mann–Whitney U test. The Kruskal–Wallis test was used for nonparametric analysis of between-group differences. The chi-squared test was used to determine whether there were significant differences between the two groups for dichotomous variables. A P value of 0.05 was considered statistically significant, and significant differences were notated as *P < 0.05, **P < 0.01, ***P < 0.001.
Results
First, the characteristics of the nonfatty liver and fatty liver groups were compared. The onset age of T2DM patients in the fatty liver group was lesser than that in the nonfatty liver group. Patients with fatty liver had a higher BMI than those without fatty liver. The levels of SBP, DBP, UA, ALT, AST, TG, Alb/Cr, and fasting serum insulin (FINS) in the fatty liver group were also higher than those in the nonfatty liver group. HDL-C was lower in the fatty liver group than in the nonfatty liver group.
Sex, TC, HbA1c, LDL-C, CRP, and fasting plasma glucose (FPG) were not significantly different between fatty liver and nonfatty liver patients (Table 1). However, the prevalence rate of ow/ob, HTN, hypertriglyceridemia (HTG), and Hypo-HDL in the fatty liver group was higher than that in the nonfatty liver group. The HOMA-IR value was higher in fatty liver than in nonfatty liver patients. The Composite ISI and Stumvoll ISI of the fatty liver group were lower than those of the nonfatty liver group. The HOMA-β, 1st PH value, and 2nd PH value were higher in the fatty liver group than in the nonfatty liver group. The MCR was lower in the fatty liver group than in the nonfatty liver group (Fig. 1).
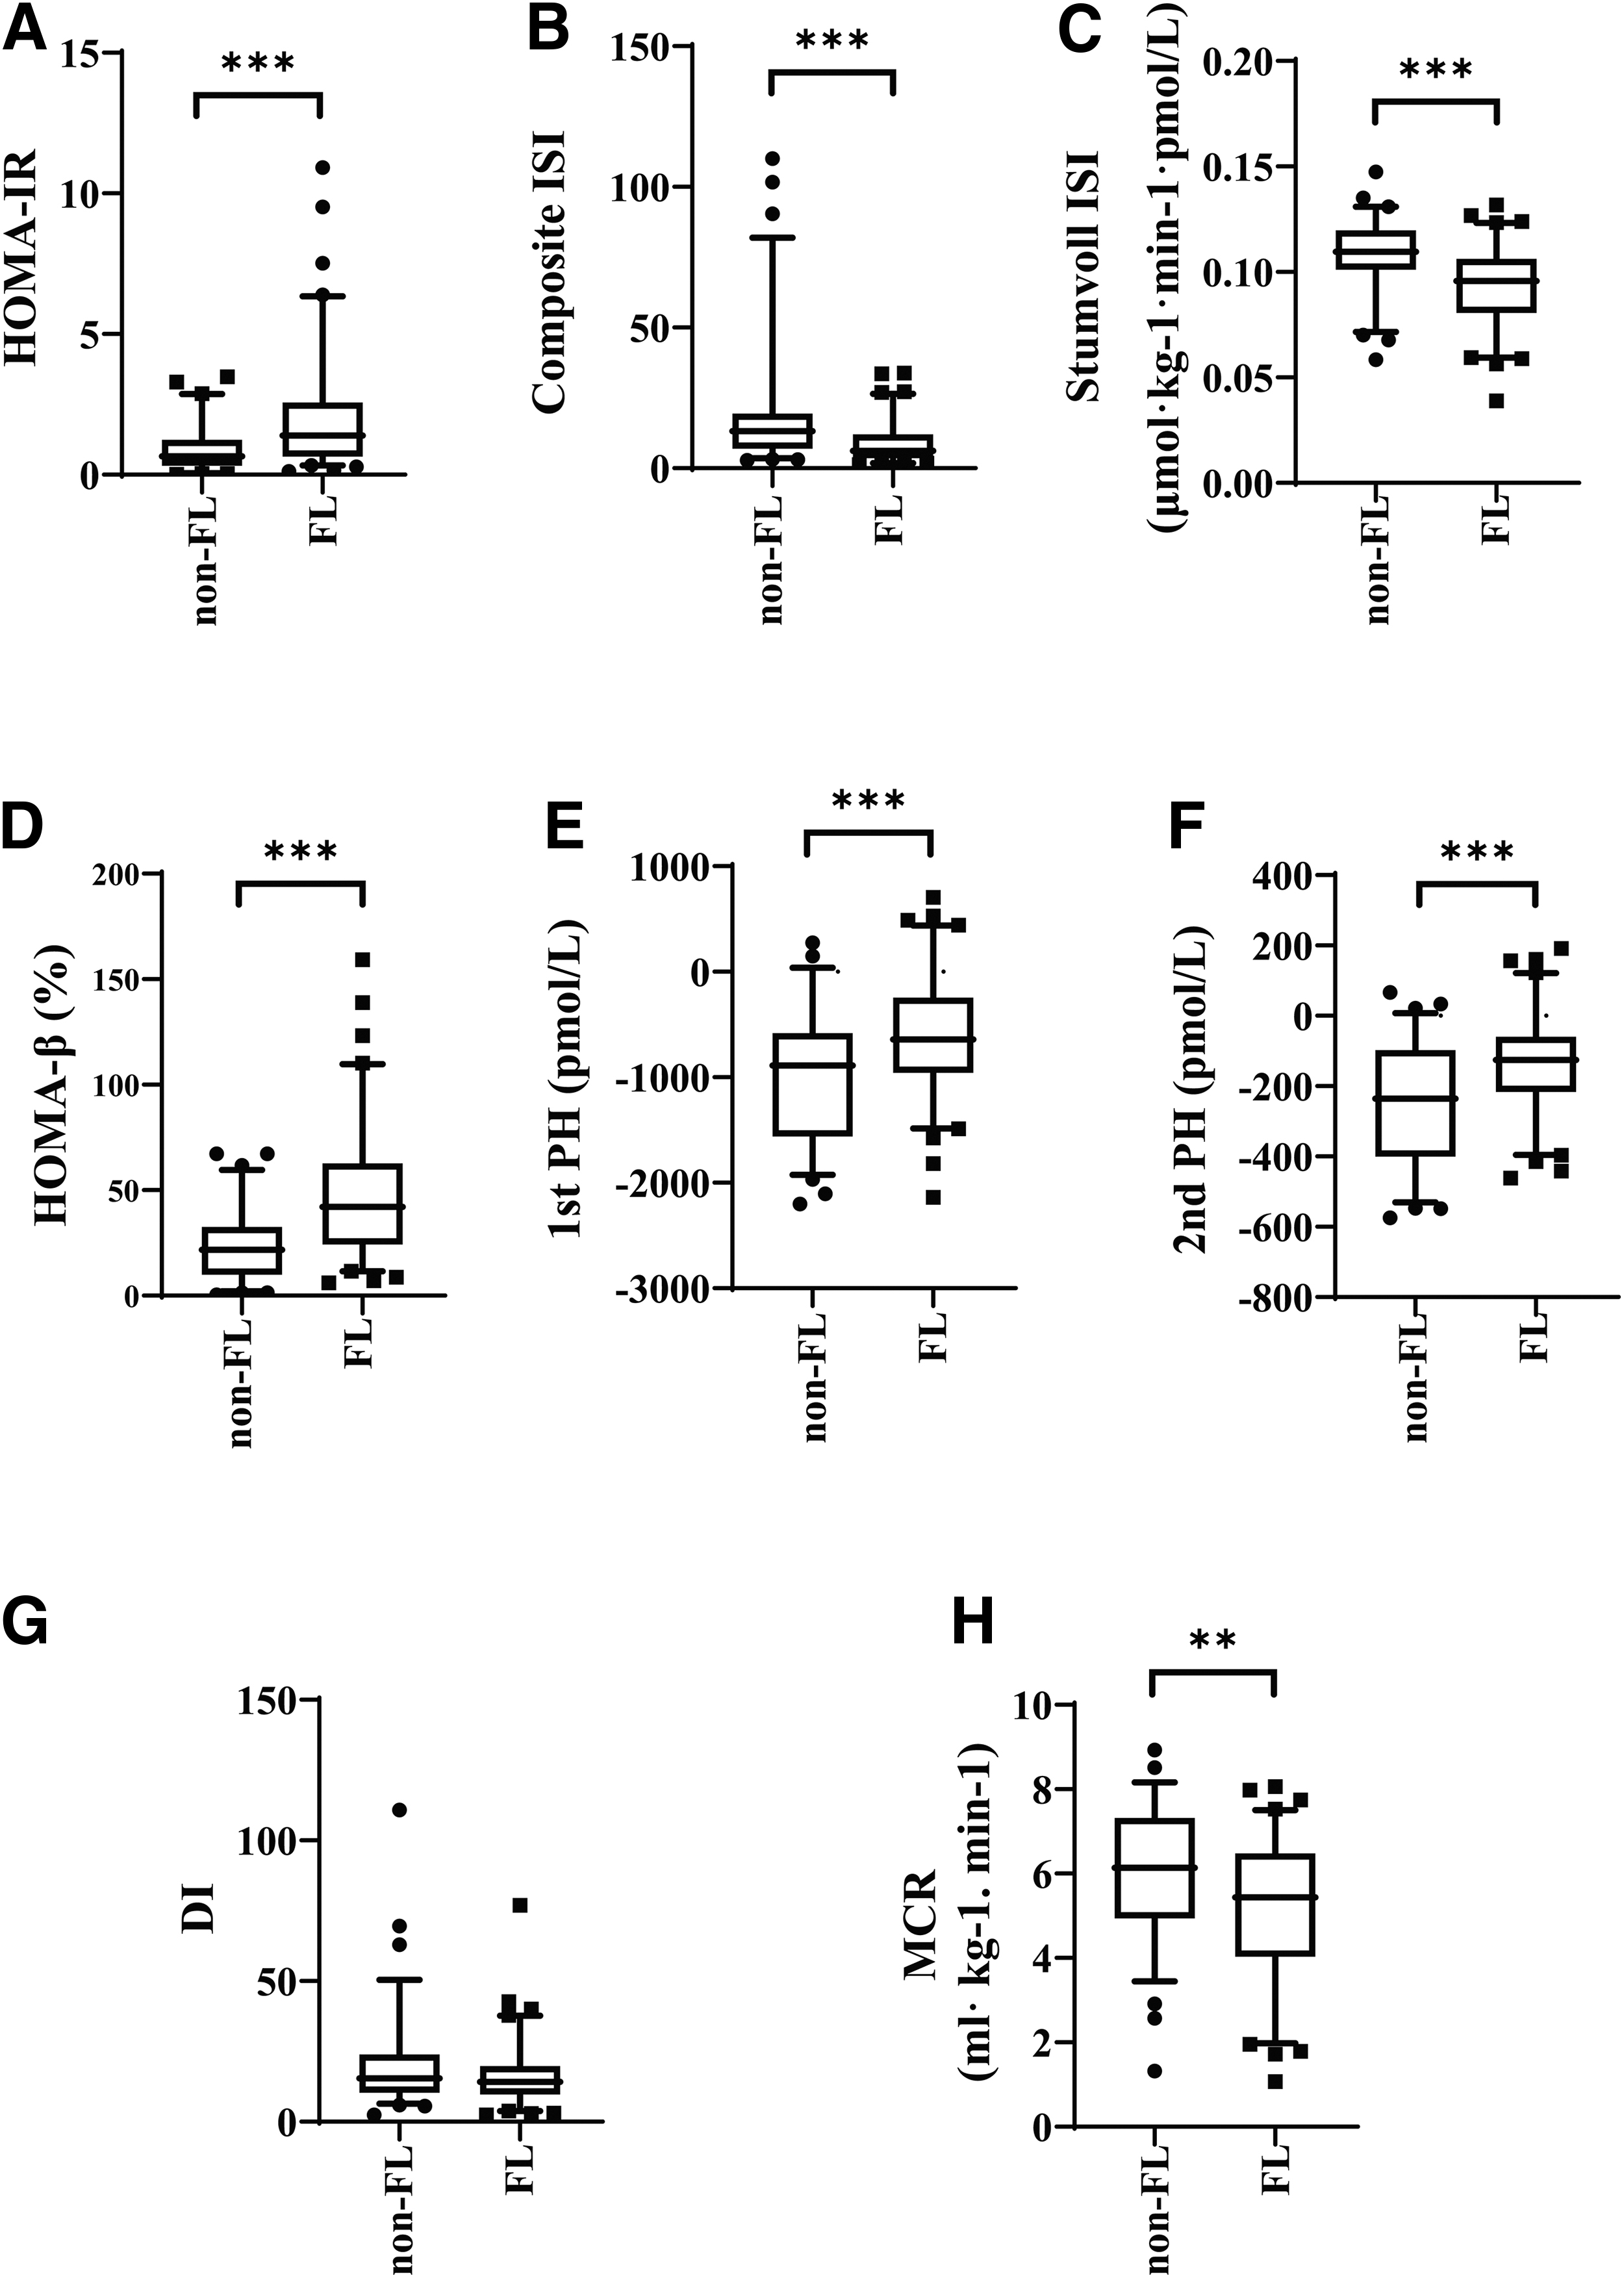
Comparison between newly diagnosed T2DM subjects, with and without fatty liver.
Clinical Features in the Groups
Results are expressed as median (Q25, Q75) in continuous variables.
Significance was determined using the chi-squared test or the Mann–Whitney U test.
P < 0.05, ** P < 0.01, *** P < 0.001.
Alb/cr, albumin/creatinine ratio; ALT, alanine aminotransferase; AST, aspartate aminotransferase; BMI, body mass index; CRP, C-reactive protein; DBP, diastolic blood pressure; F, female; FINS, fasting serum insulin; FPG, fasting plasma glucose; HbA1c, glycosylated hemoglobin; HDL-C, high-density lipoprotein cholesterol; HTC, hypercholesterolemia; HTG, hypertriglyceridemia; HTN, hypertension; Hyper-LDL, hyper-LDL cholesterolemia; Hypo-HDL, hypo-HDL-cholesterolemia; LDL-C, low-density lipoprotein cholesterol; M, Male; ow/ob, overweight/obesity; SBP, systolic blood pressure; TC, total cholesterol; TG, triglyceride; UA, uric acid.
Differences between ow/ob and lean T2DM patients were then analyzed. Fatty liver was more prevalent in the ow/ob group than in the lean group. The ow/ob group had higher TC, TG, UA, and FINS levels than the lean group, while the lean group had lower HDL-C levels. However, there were no significant differences in hypercholesterolemia (HTC), HTG, or Hypo-HDL, although the prevalence of Hyper-LDL in the ow/ob group was significantly higher than that in the lean group.
There were no significant differences between the two groups in age, SBP, DBP, HbA1c, ALT, AST, LDL-C, CRP, Alb/Cr, and FPG (Table 1). The HOMA-IR was higher in the ow/ob group than in the lean group, and the Composite ISI and Stumvoll ISI were lower in the ow/ob group than in the lean group. The HOMA-β, 1st PH, and 2nd PH were higher in the ow/ob group than in the lean group. There was no significant difference in the DI between the ow/ob and lean groups, but MCR in the ow/ob group was significantly lower than that in the lean group (Fig. 2).

Comparison between lean and ow/ob newly diagnosed T2DM subjects.
Since ow/ob and fatty liver are independent risk factors of T2DM, an additional subgroup was included in the analysis. In lean T2DM patients, there were no significant differences in HOMA-IR, HOMA-β, Composite ISI, Stumvoll ISI, 1st PH, 2nd PH, DI, and MCR between fatty liver and nonfatty liver groups. In the ow/ob group, HOMA-IR was higher, and Composite ISI and Stumvoll ISI were lower in fatty liver patients. Notably, HOMA-β, 1st PH, and 2nd PH were much higher in patients with fatty liver than in nonfatty liver patients. However, DI and MCR revealed no significant differences between patients with fatty liver and those without fatty liver disease (Fig. 3).
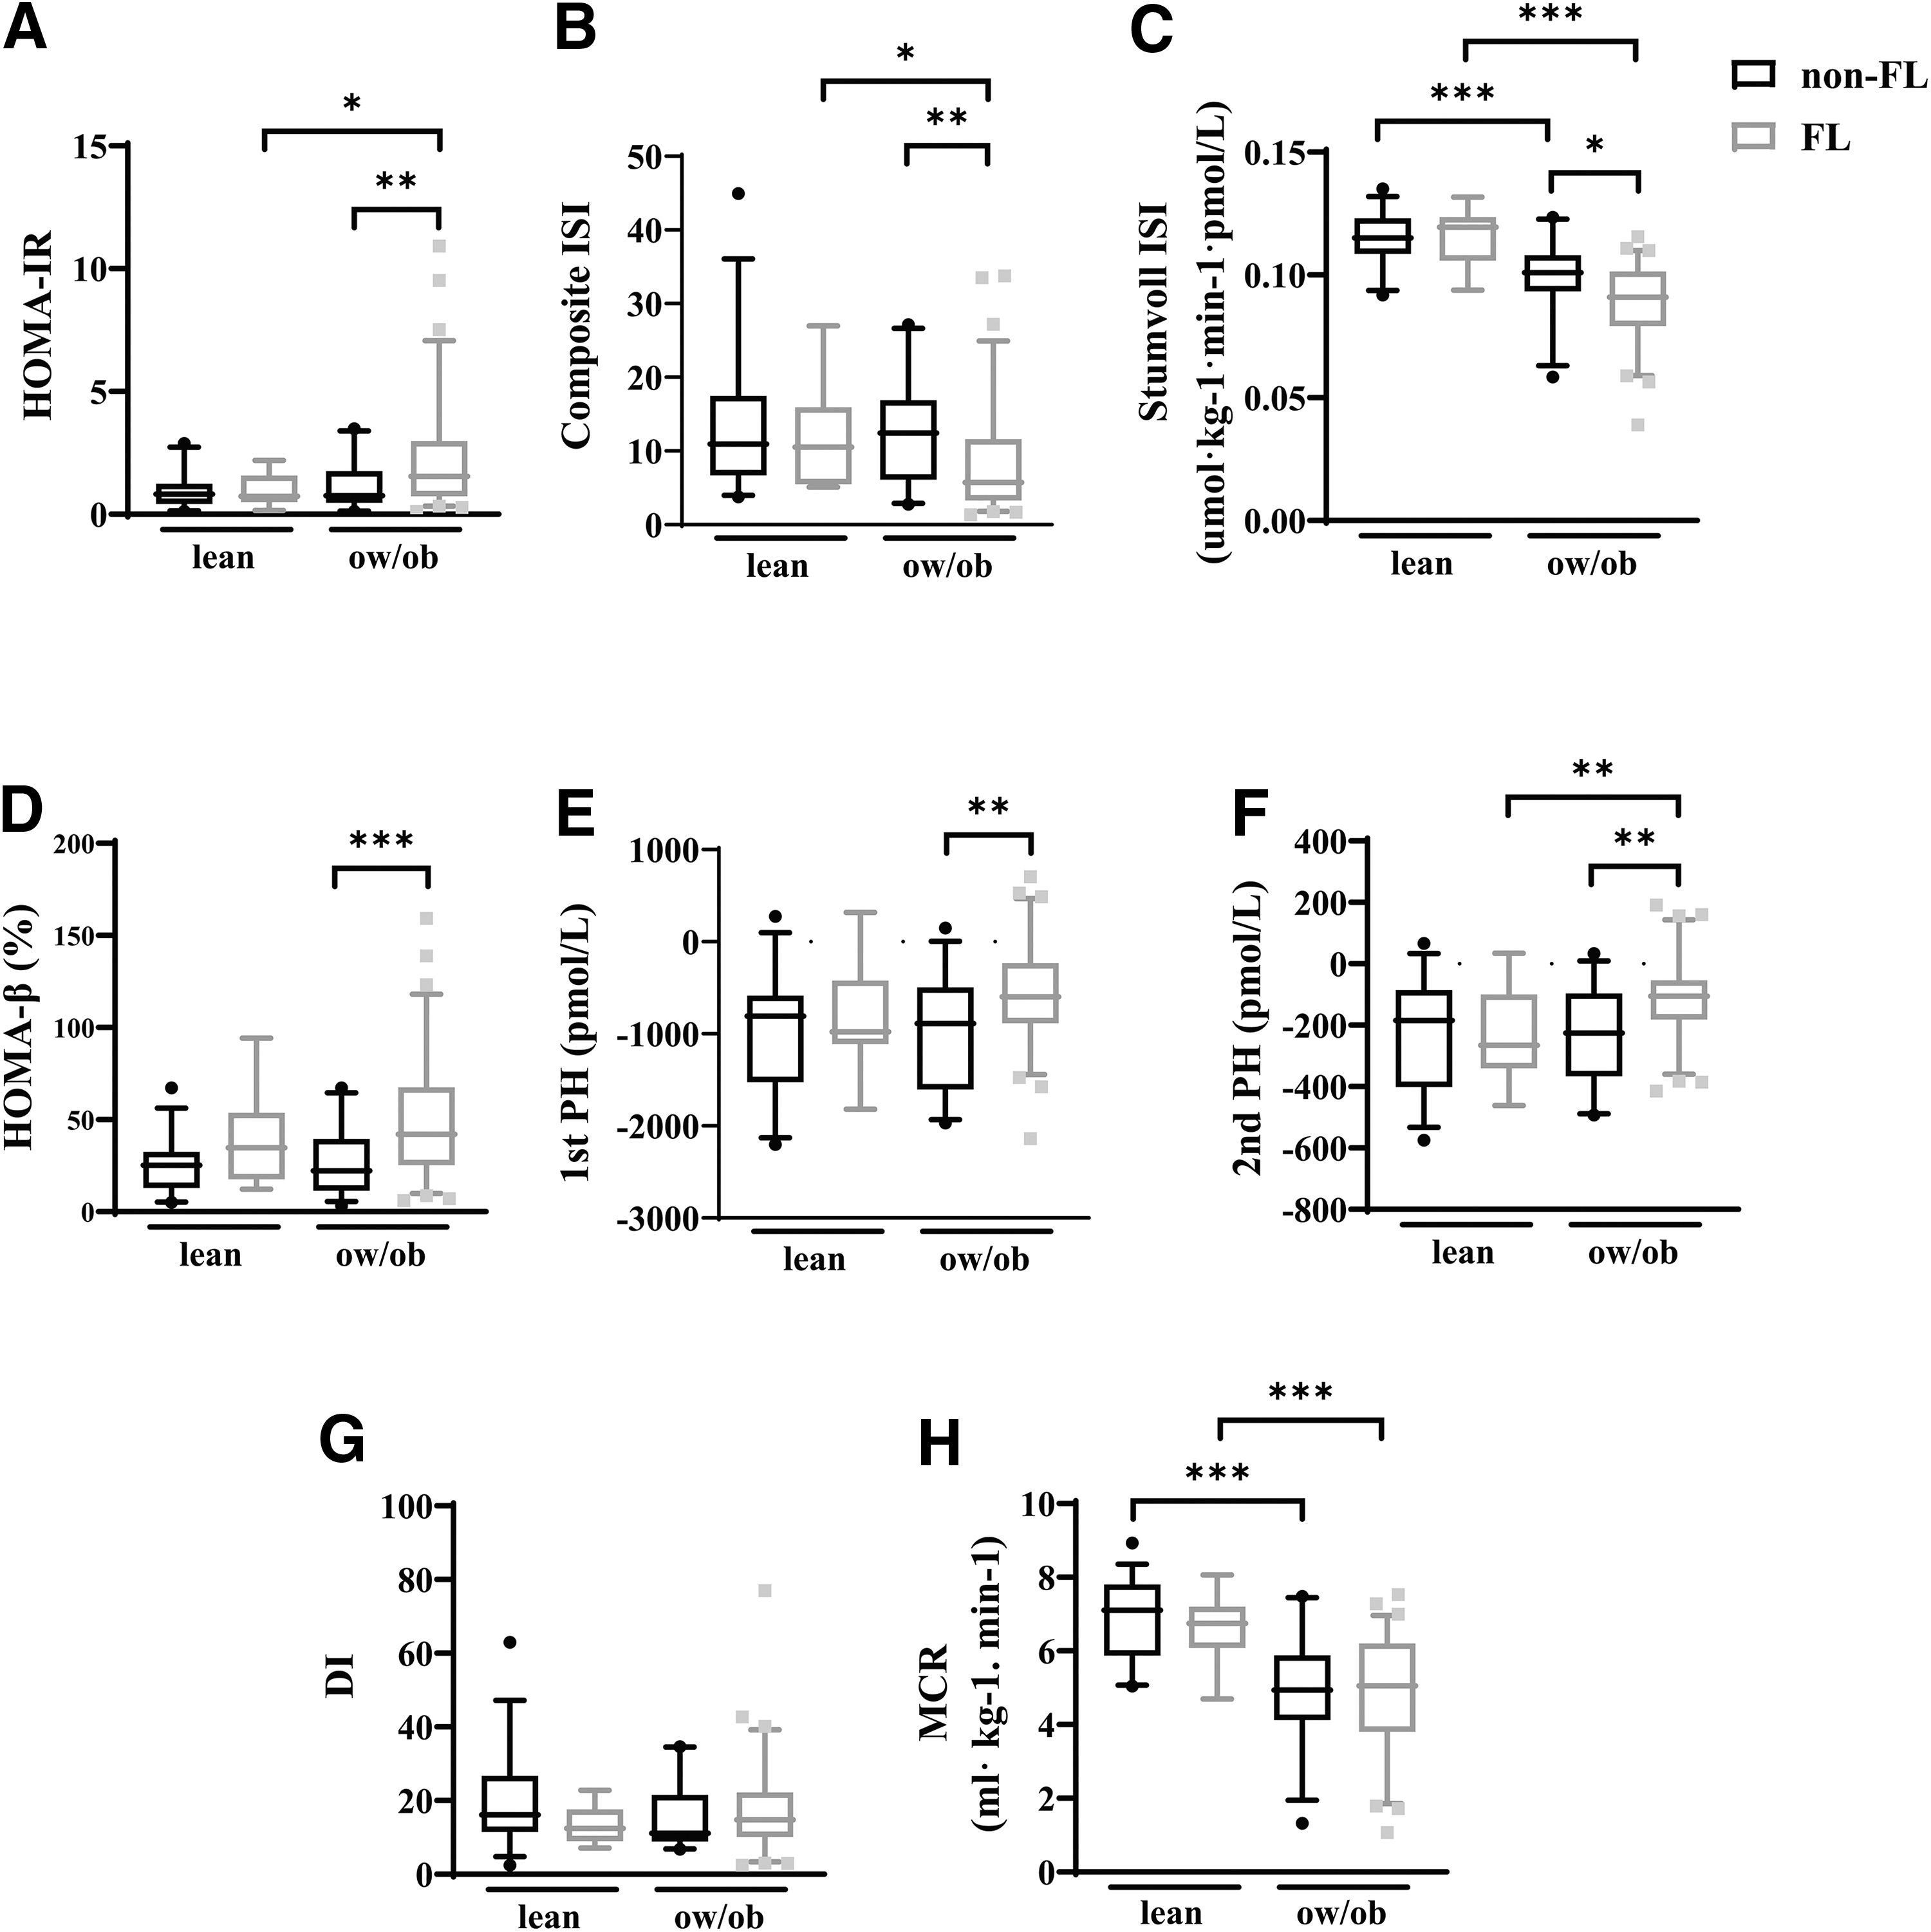
Comparison of the four groups.
These findings imply that hepatic steatosis affects insulin secretion independent of BMI. The NAFLD-LFS was then calculated for quantitative evaluation of the hepatic steatosis. A correlation analysis showed that BMI and NAFLD-LFS were positively correlated with HOMA-IR, HOMA-β, 1st PH, and 2nd PH, and negatively correlated with Composite ISI, Stumvoll ISI, and MCR (Table 2). Linear regression analysis revealed that BMI and NAFLD-LFS were independent risk factors for decreased Stumvoll ISI and MCR, especially NAFLD-LFS. On the contrary, increased NAFLD-LFS was markedly correlated with increased HOMA-β (Table 3).
Correlation Analysis Between the Index
1st PH, Stumvoll first phase; 2nd PH, Stumvoll second phase; Composite ISI, composite insulin sensitivity index; HOMA-β, homeostasis model assessment of β-cell function; HOMA-IR, homeostasis model assessment of insulin resistance; MCR, metabolic clearance rate of glucose; NAFLD-LFS, nonalcoholic fatty liver disease liver fat score; Stumvoll ISI, Stumvoll insulin sensitivity index.
P < 0.001 (false discovery rate).
Independent Analysis of the Indices
B, coefficients; SE, standard error.
P < 0.05, ** P < 0.01, *** P < 0.001.
Discussion
Obesity and NAFLD are diseases closely related to T2DM. It is estimated that in 75% of patients, T2DM occurs in combination with NAFLD. In the Chinese population, the prevalence of NAFLD in obese patients is 70%–80%. 12 In this study, patients with fatty liver accounted for 69.8% of the ow/ob group. The actual percentage in the population may be higher but is limited by the sensitivity of ultrasound images for fatty liver diagnosis. As reported, obesity and NAFLD contribute to making the onset age of T2DM much younger. 13 In this study, the median age of patients with fatty liver is 43 years, the median age for patients with ow/ob is 45 years, and the median age for nonfatty liver and lean subjects is 52 and 50 years, respectively.
Female patients, whether menopausal, were considered in this study. The presence of females who were menopausal was controlled in the groups without a difference, and none were on hormone replacement therapy. Dyslipidemia is common in patients with obesity and fatty liver. According to the data, patients with ow/ob or fatty liver had a greater prevalence of HTG, hyper-LDL, and hypo-HDL. Dyslipidemia may be partially responsible for the increased risk of cardiovascular disease (CVD) in NAFLD patients, as these lipid abnormalities have been independently associated with CVD morbidity and/or mortality. 14
The accumulation of free fatty acids (FFAs) in the liver is thought to be a critical process in developing NAFLD. 15 Obesity-induced insulin resistance decreases glucose consumption in nonhepatic tissues (such as adipose tissue and muscle) and alters TG metabolism in adipose tissue, resulting in aberrant lipolysis, which accounts for ∼60% of FFAs in plasma and even more in insulin resistance. 16,17 Apart from adipose tissue lipolysis, high carbohydrate intake and dietary lipids are sources of hepatic fatty acids. 18
Studies have reported that in healthy individuals, lipogenesis rates increase from ∼5% in the fasted state to ∼23% 4 hrs after meals. 19 In contrast, de novo lipogenesis was increased to 26% in obesity and NAFLD patients with hypertriglyceridemia and hyperinsulinemia when they were fasting. However, there was no increase in fat reproduction after meals, suggesting that hepatic lipogenesis had reached a limit in these individuals. 20 Synthesis of lipotoxic substances due to lipid overload results in activating inflammasome pathways, aggravating insulin resistance. 21
Earlier research in patients with NAFLD (including lean individuals) established that NAFLD is associated with insulin resistance, as measured by the HOMA index. 22 Additional investigations in adults, preschoolers, and adolescents confirmed the link between hepatic steatosis and insulin resistance. 23 –25 Numerous studies indicate that lean individuals with NAFLD face an increased risk of developing incidental T2DM, dyslipidemia, HTN, CVD, and all-cause increased mortality compared with obese individuals with NAFLD. 18,26,27 After adjusting for various lifestyle and metabolic confounders, NAFLD defined by ultrasonography is associated with a two- to fivefold increased risk of developing T2DM. 28
In a study of individuals with both NAFLD and mildly elevated fasting glucose, the development of prediabetes was better predicted by hepatic fat than by MetS, with a 93% prevalence of prediabetes. 29 Steatosis is an independent predictor of the development of prediabetes and T2DM, and a low level of liver fat is a good predictor of metabolically healthy obesity, lower insulin resistance, and lower cardiometabolic risk. 30 While NAFLD and obesity share several pathophysiological mechanisms, NAFLD has distinct characteristics.
In this study, insulin sensitivity and secretion differ significantly among patients with T2DM, whether they have concomitant fatty liver. Obese patients with fatty liver had higher insulin secretion than nonfatty liver, whether in the fasting state (HOMA-β) or after meals (1st PH and 2nd PH). As shown by linear regression analysis, higher insulin secretion was associated with increasing hepatic steatosis but not with increased BMI. Although patients with fatty liver have more severe insulin resistance, the MCR in these patients does not appear significantly different from nonfatty liver patients. However, these differences were only seen in ow/ob patients, not lean patients.
To summarize, although increased BMI and hepatic steatosis are linked with lower insulin sensitivity and MCR in newly diagnosed T2DM patients, our study reveals that hepatic steatosis exacerbates insulin resistance in T2DM. However, insulin production was much better in these patients. The detection of hepatic steatosis and the provision of appropriate medication based on their BMI and fatty liver may benefit these patients.
Limitations
Unfortunately, some patients with mild fatty liver might have been assigned to the nonfatty liver group because of the ultrasound's low sensitivity in detecting fatty liver. As a result, the differences between patients with and without fatty liver may have been diminished. Statistically significant differences between fatty and nonfatty liver for lean T2DM patients were not obtained. Future studies that focus on non-ow/ob T2DM using more reliable quantitative assessment methods for fatty liver will have increased differentiation and more definitive findings.
Authors' Contributions
Y.X., S.L., R.C., and Y.L. provided conception and design of the study. Y.X., R.C., R.H., L.Q., J.Z., and Y.Z. performed acquisition and formal analysis of data. Y.X. and R.C. contributed to making tables and graphing figures. Y.X., S.L., and R.C. contributed to Writing-original draft and revision. Y.X., Y.L., M.J., and Y.L. contributed to writing-review and editing. All authors contributed to the article and approved the submitted version.
Ethics Approval Statement
The clinical study was conformed to the ethical guidelines of the 1975 Declaration of Helsinki, as reflected by prior approval from the institutional review board of Sir Run Run Hospital, Nanjing Medical University.
Footnotes
Author Disclosure Statement
No conflicting financial interests exist.
Funding Information
This work was supported by the National Natural Science Foundation of China: 82070849; Innovative and Entrepreneurial Team of Jiangsu Province: (2018) 2015; Key University Science Research Project of Jiangsu Province: 19KJB320013.