




Abstract
Objectives:
This study investigated how the association between metabolic syndrome (MetS) and nonalcoholic fatty liver disease (NAFLD) diagnosis varies between non-Hispanic African American and white patients.
Methods:
A retrospective cohort study was performed using electronic medical records from an integrated health care system (2010–2018). Adults with records for all MetS measurements (body mass index, lipids, blood pressure, and blood glucose) in 2011, who did not have a NAFLD diagnosis before their last MetS measurement, were included.
Results:
The study cohort consisted of 139,336 patients (age 56.1 ± 15.2 years, 57.9% female, 79.4% non-Hispanic white). The rate of NAFLD diagnosis was higher in MetS patients compared with non-MetS patients [adjusted hazards ratio (AHR) = 1.99, 95% CI = 1.91–2.09] with a significant interaction by race (AHR = 2.05, 95% CI = 1.95–2.15 in non-Hispanic whites vs. AHR = 1.76, 95% CI = 1.58–1.96 non-Hispanic African Americans, P = 0.017). Secondary analyses revealed that the relative NAFLD diagnosis rate was higher in non-Hispanic whites with MetS compared with non-Hispanic African Americans with MetS among females and patients 18–39 years of age and 40–59 years, but not among males and those ≥60 years of age.
Conclusions:
Non-Hispanic white patients with MetS, particularly females and those <60 years of age, may be at increased risk of NAFLD compared with non-Hispanic African American MetS patients and may benefit from extra attention regarding NAFLD screening.
Introduction
Metabolic syndrome (MetS) is a group of related and co-occurring metabolic disorders that include abdominal obesity, dyslipidemia [elevated triglycerides/cholesterol], hypertension, and hyperglycemia, which individually and collectively increase the risk of developing diabetes, cardiovascular disease, and stroke. 1 An individual presenting with any three out of these five metabolic disorders is considered to have MetS. The most common risk factors for developing MetS include older age, family history of diabetes, and history of gestational diabetes. 2 The prevalence of MetS in the United States is estimated between 20% and 30%. 3,4 The disease not only affects overall patient health and life expectancy, but represents a significant financial health care burden in patients with MetS exhibiting increased annual medical costs of up to 60%. 5
Nonalcoholic fatty liver disease (NAFLD) is defined as lipid accumulation within hepatocytes, such that >5% of the total liver weight comprises fat where there is also no diagnosis of viral hepatitis B and/or C infection (HBV/HCV) and/or sustained, heavy alcohol intake (>20 grams alcohol/day). 6 If left unchecked, NAFLD can progress to nonalcoholic steatohepatitis (NASH), which is characterized by hepatic inflammation, fibrosis, and further fat deposition in the liver. 7 While the early stages of hepatic steatosis are relatively benign, progression to NASH enhances the risk for developing cirrhosis and is an independent risk factor for developing hepatocellular carcinoma. 8 Approximately 30% of the United States population is estimated to have NAFLD. 9 The estimated annual economic burden of NAFLD is more than $100 billion 10 and the costs increase substantially as the disease progresses. 11
The association between MetS and NAFLD is well documented with both diseases coexisting in many patients. 12 Previous studies report that insulin resistance and hyperinsulinemia play central roles in the pathogenesis of both MetS and NAFLD. 13 However, our understanding of the relationship between MetS and NAFLD is less clear, with some studies identifying MetS acts as a precursor of NAFLD, 14,15 while others reporting NAFLD as a precursor of MetS. 16 In an attempt to address these interactions, Zhang et al. studied reciprocal causality between MetS and NAFLD in a Chinese population using a Bayesian network and reported that the effect of MetS on NAFLD development was higher than the effect of NAFLD on MetS development. 17
Several studies have identified racial disparities in the occurrence of NAFLD and MetS 3,18 ; however, how the association between MetS and NAFLD varies by race remains poorly understood. The primary objective of this study was to examine the variation in association between MetS and diagnosis of NAFLD among non-Hispanic white and non-Hispanic African American patients using data from a cohort of patients receiving care at an integrated health care system in the Southeastern United States. The secondary objectives of this study were to determine whether any identified racial variation in the association between MetS and NAFLD varied by gender and if there was variation between age categories.
Materials and Methods
Assurance
This study protocol was approved by our Institutional Review Board.
Data source
The electronic medical records (EMRs) system was used as the data source for the study and contains data for more than 10 million patient visits annually. The EMR data fields collected for this study were patient demographics (age, race/ethnicity, gender, and insurance status); information on visits to Atrium Health facilities (including visit dates and times), the International Classification of Diseases 9th and 10th Revisions Clinical Modification (ICD-9-CM and ICD-10-CM) diagnosis and procedure codes, results of laboratory tests performed; and medication order data (including active ingredient, route of administration, days of supply, and dosage). EMRs from 2010 to 2018 were queried.
Study population
The study cohort included all adult patients (18 years and older) who had valid records for all five MetS measurements [body mass index (BMI), triglyceride level, cholesterol level, blood pressure, and blood glucose level] during 2011. Exclusion criteria included extreme outliers (individuals with laboratory values for MetS measurements below the 0.25th percentile or above the 99.75th percentile), individuals with NAFLD diagnosis before MetS measurements (ICD-9-CM code of 571.8 or 571.9 or ICD-10-CM code of K76.0 on or before the date of their last MetS measurement in 2011), patients with a viral hepatitis B (ICD-9-CM codes of V0261, 0703.2, or 0702.2 or ICD-10-CM codes of B18.0, B18.1, or B19.10) or hepatitis C (ICD-9-CM codes of 0705.1, 0705.4, 0704.1, or 0704.4 or ICD-10-CM codes of B18.2 or B19.20) diagnosis, and those with a diagnosis indicating alcohol use (ICD-9-CM codes of 291, 303, 305.0, 357.5, 425.5, 535.5, 980.0, 980.1, E860.0, E860.1, E860.2, E860.9, 790.3, or 571.0-3 or ICD-10-CM codes of F10.1-10.9, G62.1, G31.2, G72.1, I42.6, K29.2, K70-70.4, K70.9, K86.0, X45, Y15, T51.0, T51.1, T51.9, X65, or R78.0) before the first NAFLD diagnosis.
Only patients receiving active care within our health care system (those with at least one annual health care visit) for at least 1 year before their first MetS measurement and 1 year after their last MetS measurement were included.
Measures
The presence of MetS was defined using the criteria described by Hivert et al., which included the NCEP ATP III criteria and additional requirements specific to EMRs in cases where data defined by the NCEP ATP III criteria are not available in the EMRs (Appendix Table A1). 19 Because waist circumference is not a routinely collected measure in the EMR and was not available for a majority of the patients, the surrogate criterion of BMI was used in this study. Fasting blood glucose was available and used in 1468 patients (882 non-Hispanic white and 586 non-Hispanic African American patients), whereas other available nonfasting blood glucose readings were used for the remaining of the study cohort. Surrogate criteria were used for blood pressure, cholesterol, and triglycerides due to lack of available data mentioned in the NCEP ATP III criteria in a majority of patients. The MetS criteria defined by Hivert et al. are reported to have sensitivity of 73%, specificity of 91%, and a c-statistic of 0.818. 19 Individuals were considered to have MetS if they satisfied at least three of five criteria during 2011. If multiple measures were available for any of the five criteria, the most recent measurements were used.
ICD-9-CM codes of 571.8 or 571.9 or ICD-10-CM code of K76.0 were used to identify a NAFLD diagnosis. The presence of these codes was examined during 2011 in the period after the patient's last MetS measurement in 2011 and from 2012 to 2018 to identify NAFLD. Of note, even though the results for liver laboratory tests [including alanine and aspartate transaminase (ALT/AST)] are routinely available, these tests are reported to be unreliable indicators of NAFLD, with ALT/AST levels often reported to be in the normal range in NAFLD patients. 20
Covariates selected for the study were age, gender, insurance status, and comorbidities. Insurance status consisted of five categories: commercial, Medicare, Medicaid, self-pay, and other (including charity and unknown insurance status). Insurance status was based on the patient's primary payer for the most recent health care visit before reporting of the laboratory values used to define MetS. Comorbidities were quantified using the Elixhauser Comorbidity Index (ECI). Data during 1 year before the first laboratory value to define MetS was used to determine ECI.
Statistical analysis
Chi-square test, Fisher's exact test, and Student's t-test were performed to compare demographic and clinical characteristics between non-Hispanic white and non-Hispanic African American patients. Cox proportional hazard regression was used as the principal statistical technique to examine the MetS/NAFLD association. This technique has several advantages, including adjustment of variable follow-up times, censoring of patients, proportionality of the event, and consideration of varying time to event. 21 The regression models controlled for differences in age, gender, insurance, and comorbidities. Statistical significance of the interaction between MetS and race was examined in a Cox proportional hazards model fitted for the entire study cohort consisting of non-Hispanic whites and African Americans to determine whether the association between MetS and NAFLD diagnosis varied by race. Furthermore, separate Cox proportional hazards models were fitted for non-Hispanic white and African American patients.
Adjusted hazards ratios (AHRs) [measured as the ratios of the incidence rates of NAFLD diagnosis in patients with MetS compared with those without MetS] denoting the strength of the MetS/NAFLD diagnosis association were compared between the two race groups. This approach was used because patients without MetS are an important reference group in the quantification of the MetS/NAFLD diagnosis association. Stratified regression models for comparison across races/ethnicities to determine the racial-ethnic variation have also been used in other studies. 14,22,23 In the secondary analyses by age and gender, separate Cox proportional hazard models were fitted for the different gender and age categories (18–39, 40–59, and ≥60 years) to determine how variation in association between MetS and NAFLD varies between races for each of these categories. AHRs and 95% confidence intervals (95% CI) were reported for all Cox proportional hazards regression models. A level of significance of <0.05 was used and all analyses were conducted using SAS version 9.4 (SAS Institute, Inc., Cary, NC).
Results
Patient demographics and clinical presentation
The total study cohort consisted of 139,336 patients, with a mean age of 56.1 ± 15.2 years and 30,364 (21.8%) patients had a diagnosis of MetS in 2011 (Table 1). Within the study group, the majority of patients were non-Hispanic white (79.4%) and female (57.9%) and the most prevalent insurance was commercial (46.6%). The mean ECI was 1.6 ± 1.7. Of the total cohort, 6.1% of patients had a new diagnosis of NAFLD after their last MetS measurement in 2011. Statistically significant differences were observed between non-Hispanic white and non-Hispanic African American patients for all measures. The mean age was higher, whereas the mean ECI was lower in non-Hispanic whites compared with non-Hispanic African Americans. Lower proportions of females and higher proportions of patients with a commercial insurance were identified in the non-Hispanic white cohort compared with the non-Hispanic African American cohort.
Study Sample Characteristics
Includes charity and unknown insurance.
Fasting glucose readings were available in 1468 patients, including 882 non-Hispanic white patients and 586 non-Hispanic African American patients. Other available nonfasting glucose readings were used for the remaining patients.
BMI, body mass index; ECI, Elixhauser Comorbidity Index; NAFLD, nonalcoholic fatty liver disease; SD, standard deviation.
The proportion of patients with MetS was higher in the non-Hispanic African American cohort compared with the non-Hispanic white cohort. The mean values of all the MetS components were significantly different between the two cohorts. Mean BMI, systolic and diastolic blood pressure, and nonfasting glucose were higher in non-Hispanic African Americans compared with non-Hispanic whites, whereas mean cholesterol, triglycerides, and fasting glucose were higher in the non-Hispanic white cohort compared with non-Hispanic African Americans. The proportion of patients with a NAFLD diagnosis was higher in the non-Hispanic white cohort compared with non-Hispanic African Americans.
Association between MetS and NAFLD diagnosis
Using a Kaplan–Meier analysis, the probability of not receiving a NAFLD diagnosis (i.e., “survival”) was lower among patients with MetS compared with patients without MetS in the overall study cohort (Fig. 1). In the overall Cox proportional hazards regression model, after adjusting for the group differences, the rate of getting diagnosed with NAFLD was higher in MetS patients compared with patients without MetS (AHR = 1.99, 95% CI = 1.91–2.09) (Fig. 2).

Kaplan–Meier curves for patients with and without metabolic syndrome. NAFLD, nonalcoholic fatty liver disease.
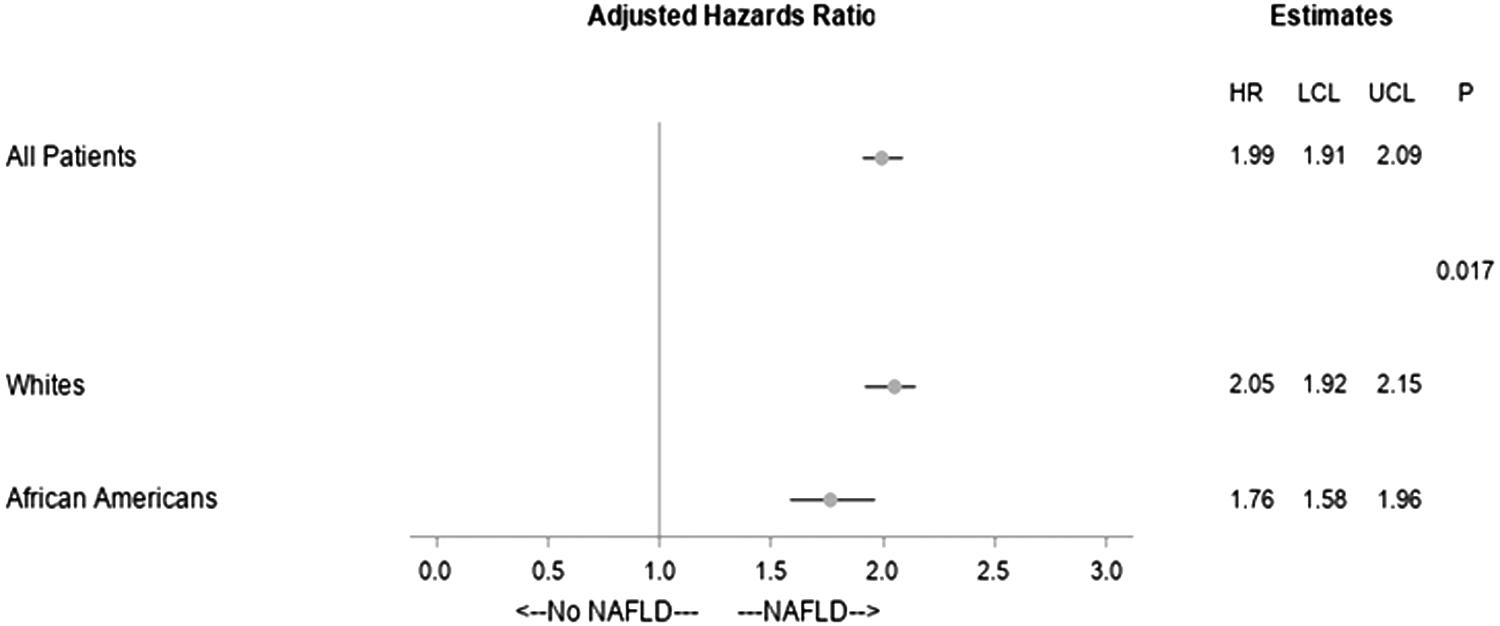
Cox proportional hazards regression models for time to diagnosis of NAFLD. Whites and African Americans refers to non-Hispanic whites and non-Hispanic African Americans respectively. HR, hazards ratio; LCL, lower confidence limit; UCL, upper confidence limit.
MetS/NAFLD diagnosis association is race dependent
Using a similar Kaplan–Meier analysis approach, the probability of not getting diagnosed with NAFLD was lower among patients with MetS compared with patients without MetS in both non-Hispanic white and non-Hispanic African American patients (Figs. 3 and 4). In the Cox proportional hazards regression analysis, the relative NAFLD diagnosis rate was higher in non-Hispanic white patients with MetS (vs. those without MetS) compared with non-Hispanic African American patients with MetS (vs. those without MetS) (AHR = 2.05, 95% CI = 1.95–2.15 vs. AHR = 1.76, 95% CI = 1.58–1.96) with a significant interaction by race (Fig. 2).

Kaplan–Meier curves for non-Hispanic white patients with and without metabolic syndrome.
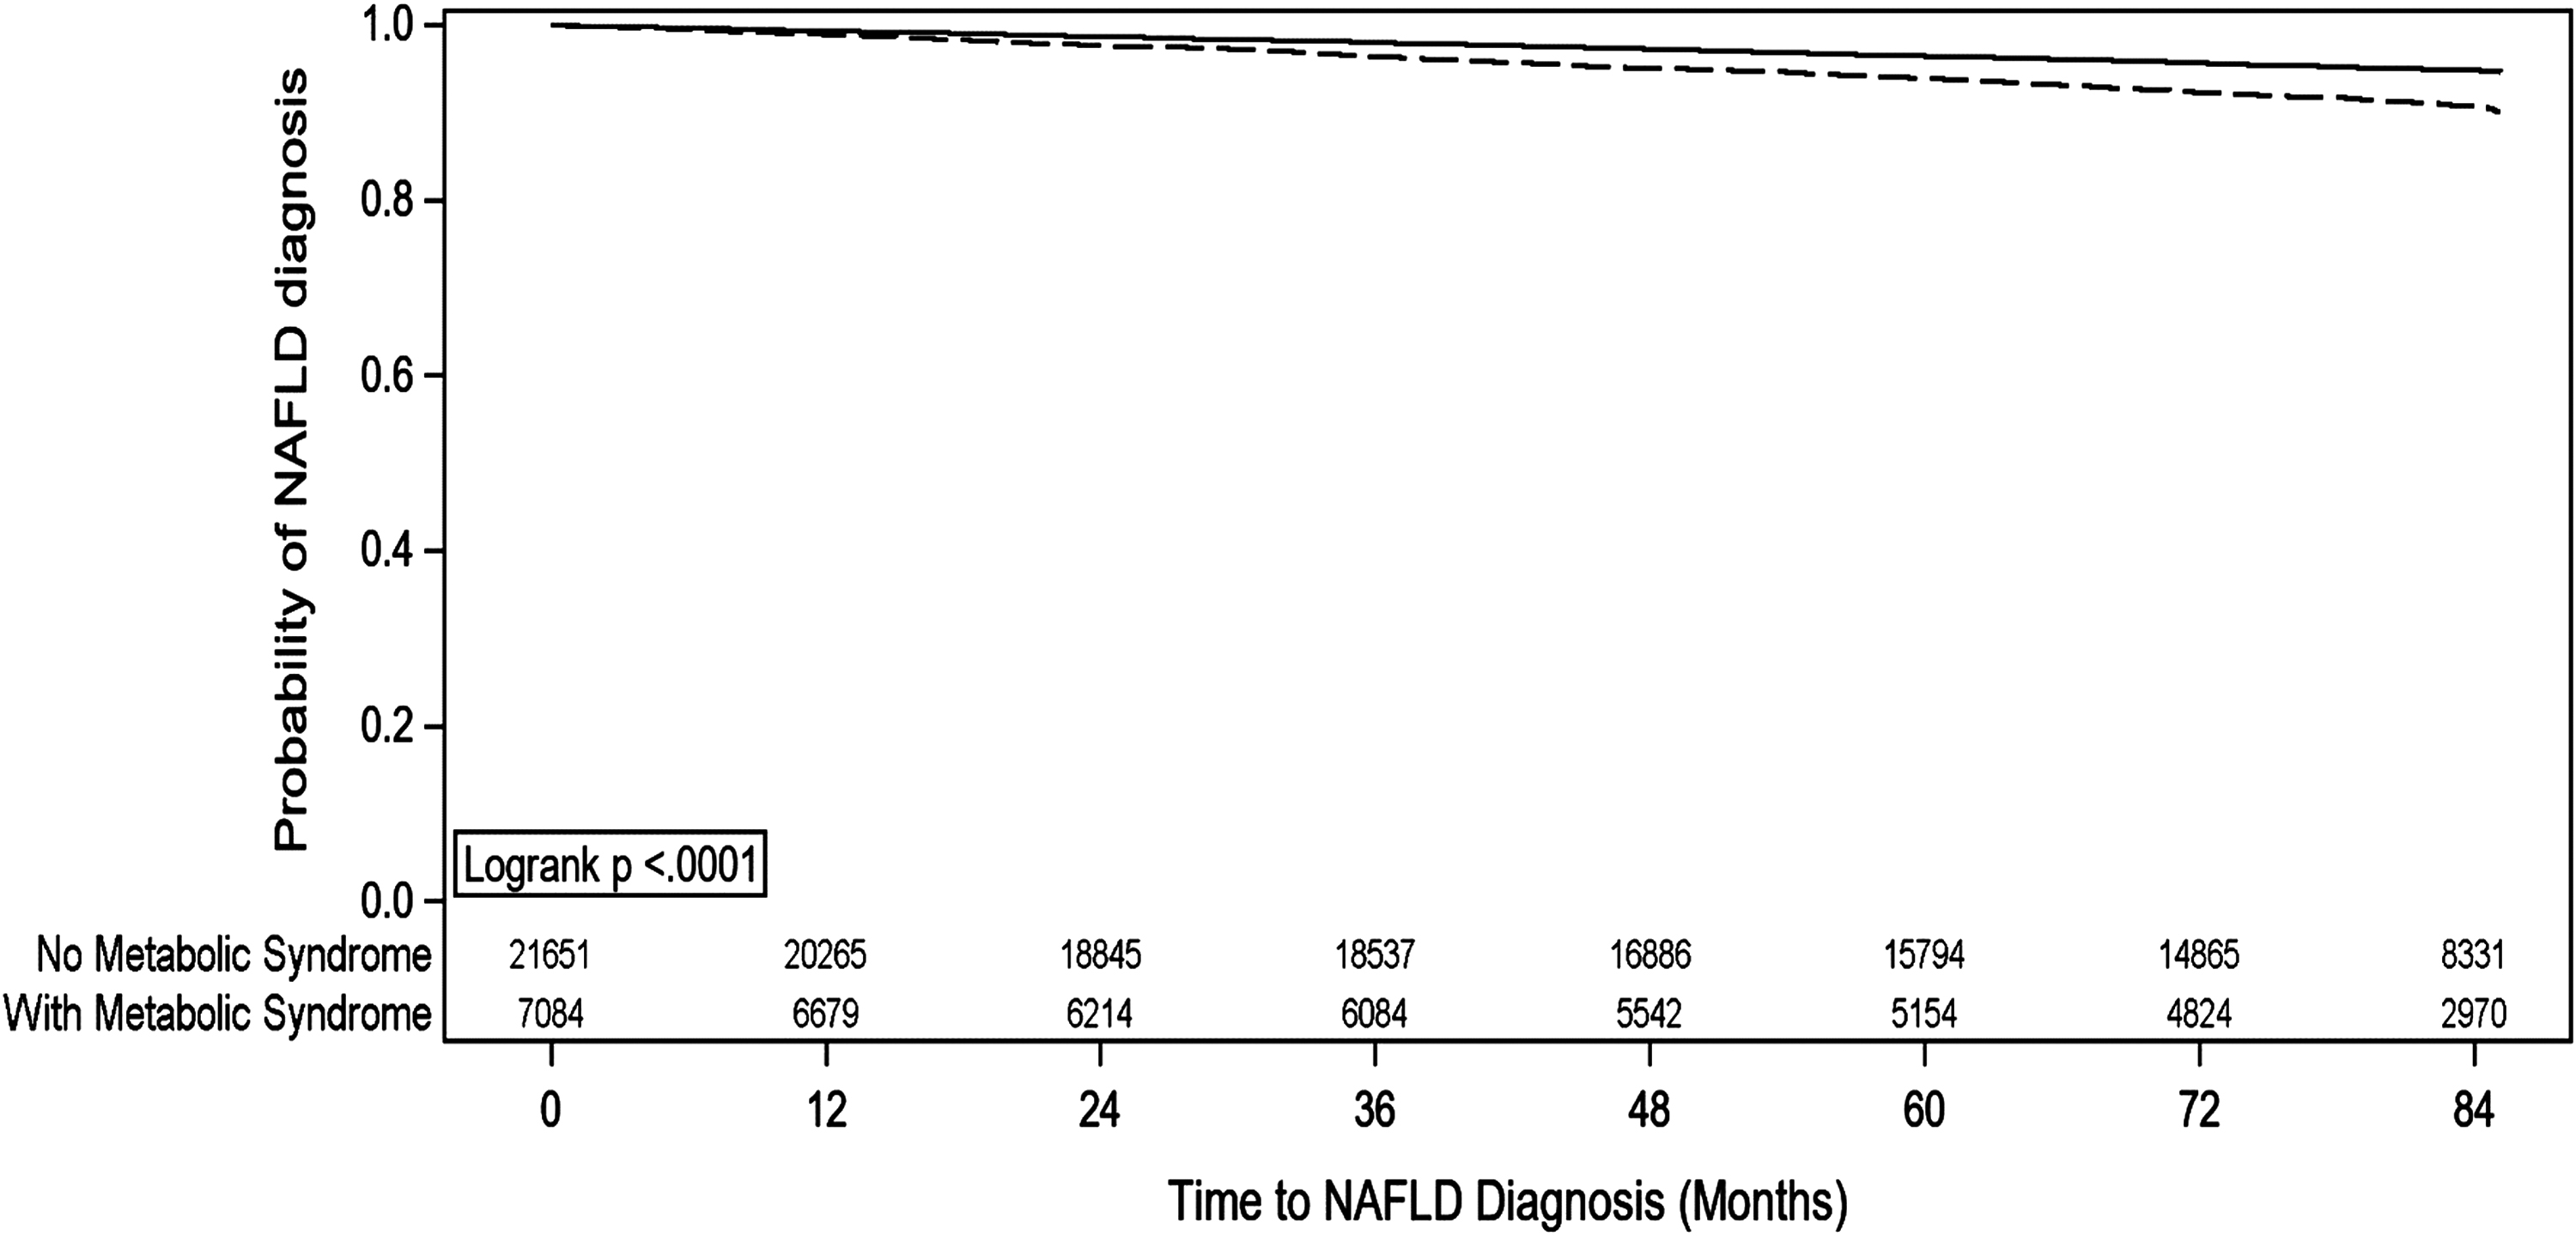
Kaplan–Meier curves for non-Hispanic African American patients with and without metabolic syndrome.
Association between MetS and NAFLD diagnosis by race varies between male and female patients and across different age categories
In the Cox proportional hazards regression models for the secondary analyses, the relative NAFLD diagnosis rate was higher in non-Hispanic white patients with MetS (vs. those without MetS) compared with non-Hispanic African American patients with MetS (vs. those without MetS) in females [AHR = 2.13, 95% CI = 1.99–2.27 in non-Hispanic whites vs. AHR = 1.71, 95% CI = 1.51–1.94 in non-Hispanic African Americans, P (interaction) = 0.003], those 18–39 years of age [AHR = 2.68, 95% CI = 2.25–3.19 in non-Hispanic white patients vs. AHR = 2.15, 95% CI = 1.54–2.98 in non-Hispanic African American patients, P (interaction) = 0.022] and those 40–59 years of age [AHR = 2.03, 95% CI = 1.88–2.19 in non-Hispanic white patients vs. AHR = 1.80, 95% CI = 1.56–2.07 in non-Hispanic African American patients, P (interaction) = 0.034] (Figs. 5 and 6). The findings were not significant for male patients and those 60 years of age or more.
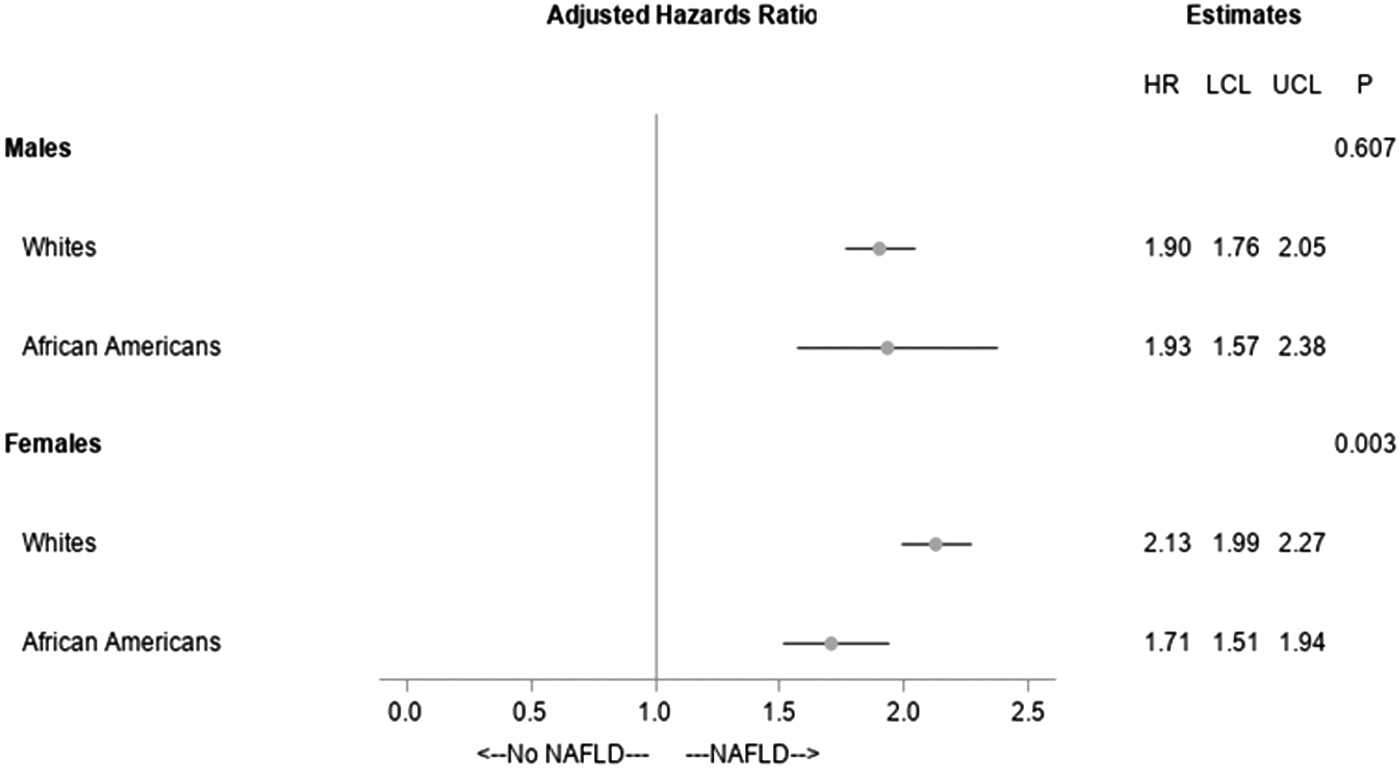
Cox proportional hazards regression models for time to diagnosis of NAFLD by race and gender. Whites and African Americans refers to non-Hispanic whites and non-Hispanic African Americans respectively.

Cox proportional hazards regression models for time to diagnosis of NAFLD by race and age. Whites and African Americans refers to non-Hispanic whites and non-Hispanic African Americans respectively.
Discussion
Previous studies report patients with MetS are at increased risk of developing NAFLD. This study determined that the rate of NAFLD diagnosis varies between non-Hispanic white patients and non-Hispanic African American patients who have MetS. In addition, we identified that the variation in rate of NAFLD diagnosis in patients with MetS by race differs by age and gender. To the best of our knowledge, this is the first study examining the variation in association between MetS and NAFLD diagnoses by race. The findings of this study could inform health care decisions regarding NAFLD screening and treatment protocols.
Our study corroborated previous findings that MetS is associated with developing NAFLD, rate of NAFLD diagnosis nearly doubling in patients with MetS compared with those without MetS. Similar to our study, Wang et al. report patients with MetS were nearly three times more likely to develop NAFLD compared with those without MetS. 24 Hamaguchi et al. found a positive association between MetS and development of NAFLD, identifying 36.8% of the patients who developed NAFLD had been diagnosed with MetS, compared with 9.8% of the patients who did not develop NAFLD. 14 It has been speculated that insulin resistance, which is commonly associated with the components of MetS, leads to increased hepatic triglyceride synthesis and deposition of triglycerides in hepatocytes and ultimately blockage of low-density lipoprotein synthesis, thereby increasing the risk of NAFLD. 17,25
Based on our analysis, the relative rate of NAFLD diagnosis was higher in non-Hispanic white patients with MetS (vs. non-Hispanic white patients without MetS) compared with non-Hispanic African American patients with MetS (vs. non-Hispanic African American patients without MetS). Prior studies have reported similar findings. 26 –32 One explanation for these findings may relate to genetic polymorphisms, factors identified as playing a significant role in risk for NAFLD development. For example, the patatin-like phospholipase domain-containing protein 3 (PNPLA3), transmembrane 6 superfamily member 2 (TM6SF2), and glucokinase regulator (GCKR) gene variants are associated with NAFLD, 33 –35 and are present at a lower frequency in African Americans compared with whites. 35 –38 Genetic patterns, specifically in the choline metabolism pathway, have associations with NAFLD, and these signatures also differ by race with high-risk patterns more prevalent in white patients. 35 Another possible explanation could be the higher resistance of African Americans to hepatic triglyceride accumulation and hypertriglyceridemia associated with insulin resistance. 39 The latter pattern was also reflected in our study with significantly lower triglyceride levels in non-Hispanic African American patients compared with non-Hispanic white patients (101.9 ± 64.6 mg/dL vs. 128.4 ± 79.1 mg/dL). It is also possible that non-Hispanic black patients have lower access to health care settings, which diagnose NAFLD. A recent study by Caraballo et al. reports that non-Hispanic blacks face continued disparities in timely health care access, contributed by challenges such as geographical distance from high-quality health care, suboptimal patient–provider communication, income disparities, and lower health literacy. 40
Our secondary analysis examined whether the association between MetS and NAFLD in non-Hispanic whites and non-Hispanic African Americans also varies by gender and revealed that the relative NAFLD diagnosis rate in non-Hispanic whites with MetS (vs. those without MetS) was higher compared with non-Hispanic African Americans with MetS (vs. those without MetS) in females but not males. One possible explanation for the variable finding by gender may be a differential impact and/or interaction of genes and hormones that play a role in NAFLD and related disorders by gender. 41 For example, the PNPLA3 I148M variant, which is associated with NAFLD occurrence, is reported to have significantly greater impact on liver fat content in women compared with men. 41 Similarly, estrogen is reported to enhance hepatic lipid metabolism and is produced at significantly higher levels in women. 41,42
We also identified that age can be an important factor in racial variation in the association between MetS and NAFLD diagnosis. Specifically, while the relative rate of NAFLD diagnosis in non-Hispanic white patients with MetS (vs. those without MetS) was higher compared with non-Hispanic African American patients with MetS (vs. those without MetS) in patient cohorts 18–39 years of age and 40–59 years, this was not the case in patients >60 years. One reason for the nonsignificant finding in patients 60 years of age or more could be that changes, such as decreased blood flow to the liver 43 or other unknown age-related mechanisms could impact occurrence of NAFLD more than the presence of MetS in these patients resulting in lower relative rates of NAFLD in patients with MetS (vs. those without MetS) in both the racial groups.
The findings of our study have potential implications for both patients and health care providers. Clinically, NAFLD is often asymptomatic and can progress to NASH if not detected early and managed appropriately. 44 –47 Conversely, diet and lifestyle modifications are reported to slow NAFLD progression with the potential to reverse the disease course. 48,49 Currently, routine screening for NAFLD is not recommended due to a lack of evidence regarding utility and cost-effectiveness, with guidelines recommending additional vigilance for NAFLD patients at high risk of developing the condition. 50 This study adds to the body of evidence that defines categories of patients at risk for NAFLD. Both non-Hispanic white patients and non-Hispanic African American patients with MetS were found to be at higher risk of NAFLD.
The rate of NAFLD diagnosis was higher in non-Hispanic white patients with MetS compared with non-Hispanic African American patients with MetS. However, considering the possibility of underdiagnosis in non-Hispanic African American patients due to possible reduced access to NAFLD diagnosis, the true rate of NAFLD could be higher in these patients than that found in this study. Future studies should examine if there is a difference in rate of NAFLD between non-Hispanic white and African American patients after differences related to health care access are controlled (e.g., comparing patients living in neighborhoods with similar health care and socioeconomic facilities).
In the analyses examining variation in the MetS-NAFLD association by age and gender, the rate of NAFLD diagnosis was higher in non-Hispanic white patients with MetS compared with non-Hispanic African American patients with MetS in females, those 18–39 years of age, and those 40–59 years of age. The patients at high risk of NAFLD identified in our study could benefit from closer monitoring and/or screening for NAFLD development. Interventions aimed at NAFLD prevention could be targeted in these patient groups. Identification of NAFLD at an earlier stage would also facilitate timely disease management and prevent the increased clinical/economic burden associated with later disease stages. However, challenges, including limited accuracy of noninvasive techniques to detect NAFLD 51 and lack of therapeutic options for NAFLD in addition to lifestyle modifications on account of uncertainty associated with its causes, 52 make diagnosis and management of NAFLD and related policy making in clinical practice difficult at present.
Our study has several limitations that should be highlighted. Due to the retrospective nature of the study, causality between MetS and NAFLD diagnosis could not be addressed. Potential limitations are also implicit in studies based on EMR data. NAFLD diagnosis was determined using provider-confirmed ICD-9-CM/ICD-10-CM codes. Various techniques, including but not limited to computerized tomography, magnetic resonance imaging, magnetic resonance spectroscopy, abdominal ultrasound, serum biomarkers, and liver biopsy, could have been used by providers to diagnose NAFLD. The differential diagnostic accuracies of these techniques may have impacted our definition of NAFLD diagnosis. A post hoc observation of the study data found that more than 85% of included patients had their NAFLD diagnosis at nonprimary care sites (hospitals, emergency rooms, imaging centers, and specialty practices) within the health care system under study. These sites have generally used imaging techniques (predominantly abdominal ultrasound) for NAFLD diagnosis. However, visit-level data on the specific diagnostic techniques used for patients in this study were not available from the EMR.
Similar lack of detailed data also prevented standard criteria such as the NCEP ATP III criteria from being used to define MetS. Coding errors in EMRs could also have affected accuracy of our results, although we have no reason to believe that error rates would differ between the study cohorts. Insufficient sample size for races and ethnicities other than non-Hispanic white and non-Hispanic African American patients prevented their inclusion in the study. Data on insulin resistance was not available in EMR data. Discussion of the clinical or epidemiological significance of the difference we identified between NAFLD incidence rates in these study groups was not possible due to lack of information from the literature. The study setting in a large, integrated health care system may also affect the generalizability of results across diverse U.S. health care settings and for varying patient demographics.
Conclusions
A combined MetS/NAFLD syndrome exacerbates health and financial burdens, increasing the urgency to identify and implement accurate and cost-effective methods of detecting early-stage NAFLD for high-risk patients. While both non-Hispanic white and African American patients with MetS are at an increased risk of NAFLD, our study suggests that the risk could be higher in non-Hispanic whites with MetS, particularly in female non-Hispanic white patients and those <60 years of age. Particular attention from health care providers regarding NAFLD screening and interventions to prevent NAFLD in high-risk groups could be helpful in alleviating the burden associated with the disease.
Footnotes
Acknowledgment
The authors thank Dr. Andrew deLemos for his clinical insights on this work.
Author Disclosure Statement
No conflicting financial interests exist.
Funding Information
No funding was received for this article.
Appendix
Criteria to Define Metabolic Syndrome
| Metabolic syndrome criteria a | Formal NCEP ATP III characteristic | Surrogate characteristic |
|---|---|---|
| Central obesity | Waist circumference >102 cm (40") in men, >88 cm (35") in women | Body mass index ≥29.1 kg/m2 in men, ≥27.2 kg/m2 in women; if height missing, weight ≥94.4 kg (201 lbs) in men, ≥73.6 kg (162 lbs) in women |
| Elevated blood pressure | Average of last two readings ≥130 and/or ≥85 mmHg or diagnosis of hypertension on problem list and antihypertensive agent on medication list | Any of: one blood pressure ≥130 and/or ≥85 mmHg; on antihypertensive medication but no diagnosis on problem list; hypertension from billing codes |
| Elevated glucose | Fasting plasma glucose >5.6 mM (100 mg/dL) | Any plasma glucose ≥7.8 mM (140 mg/dL) |
| Elevated triglycerides | Fasting plasma level ≥1.7 mM (150 mg/dL) | Any plasma level ≥2.3 mM (200 mg/dL) |
| Low high-density lipoprotein cholesterol | Plasma level <1.0 mM (40 mg/dL) in men, <1.3 mM (50 mg/dL) in women | Plasma total cholesterol >5.2 mM (200 mg/dL) |
Source: Hivert et al. 19
Individuals who satisfy three or more of the listed criteria were considered to have metabolic syndrome.
NCEP ATP III, National Cholesterol Education Program Adult Treatment Panel III.