




Abstract
Introduction:
Nonalcoholic fatty liver disease (NAFLD) is the most common liver disease in the world. We evaluated vibration-controlled transient elastography (VCTE) data to determine the prevalence of two principle manifestations of NAFLD, hepatic steatosis and hepatic fibrosis.
Methods:
Data were sourced from the 2017 to 2018 National Health and Nutrition Examination Survey, which provides a representative cross-section of the noninstitutionalized U.S. population. Participants 18 years of age and older were examined using sera and VCTE. Sociodemographic and medical history information were gathered through self-report. Logistic regression models assessed relationships between steatosis, fibrosis, and variables of interest. Prevalence estimates are reported as weighted percentages with 95% Wald confidence intervals (CIs).
Results:
A total of 4083 participants representing 187 million U.S. adults were included in our analysis. We estimate the prevalence of steatosis (controlled attenuation parameter ≥302 dB/m, ≥S1) at 27.3% (95% CI: 25.3–29.4) and significant fibrosis (liver stiffness ≥8.2 kPa, ≥F2) at 7.7% (95% CI: 6.1–9.6). Both were independently associated with age, gender, body mass index (BMI), and diabetes (all P < 0.05). The greatest predictor of both steatosis and fibrosis was BMI. Steatosis was present in 3.6%, 18.7%, and 49.4% of those in the normal or underweight, overweight, or obese categories, respectively. Significant fibrosis was present in 2.1%, 3.2%, and 14.7% of those in the normal or underweight, overweight, or obese categories, respectively.
Conclusions:
Clinically significant steatosis and/or fibrosis are highly prevalent among the U.S. adult population. The greatest predictor of both steatosis and fibrosis is obesity.
Introduction
Nonalcoholic fatty liver disease (NAFLD) is defined as the presence of hepatic steatosis when no other secondary causes (e.g., heavy alcohol use) are present. 1 Individuals with hepatitis steatosis may progress to nonalcoholic steatohepatitis (NASH), which places them at higher risk for progression to cirrhosis. Thus, NASH is now the second leading cause for liver transplant in the United States. 2 NAFLD is closely associated with increased body mass index (BMI) and metabolic syndrome, and it may be independently linked to cardiovascular disease. 3 Patients with NAFLD have higher overall morbidity and mortality, likely related to its close association with metabolic syndrome. 4
The worldwide prevalence of NAFLD is estimated to be 25%, 4 and the U.S. prevalence has been steadily increasing. A nationally representative sample using the National Health and Nutrition Examination Survey (NHANES) defined NAFLD as increased serum aminotransferases in the absence of chronic liver disease. This study concluded that the prevalence of NAFLD increased from 5.5% between 1988 and 1994 to 11% between 2005 and 2008. 5 Another NHANES study specifically defined fatty liver as moderate to severe steatosis by ultrasound and found a prevalence of 20%. 6 A more recent study of middle-aged adults in Texas demonstrated an NAFLD prevalence of 38%. 7
The long-standing method for diagnosing NAFLD has been liver histology; 1 however, liver biopsy can result in substantial misclassification and is not suitable to establish prevalence estimates. 8 Of the various noninvasive measures used to assess NAFLD, magnetic resonance may be most sensitive for detecting steatosis and/or fibrosis, but it is not practical. The development of vibration-controlled transient elastography (VCTE) has provided a safe, accurate, and cost-effective way to diagnosis NAFLD. Its use for detecting fibrosis has been validated with acceptable reproducibility. 9 In addition, it is has also been shown to be a reasonable noninvasive imaging test for steatosis. 10 We therefore report the prevalence of steatosis and fibrosis diagnosed by VCTE in a representative sample of the U.S. population.
Methods
We performed a retrospective analysis of data collected from the 2017 to 2018 NHANES cycle. NHANES is a series of ongoing cross-sectional surveys designed to assess the health and nutrition status of the noninstitutionalized U.S. population. A complex multistage probability cluster design is used by the survey to oversample specific populations, permitting both adequate samples for meaningful subgroup analyses as well as more reliable parameter estimates. 11 The 2017–2018 NHANES protocol was approved by the National Center for Health Statistics institutional review board, and written informed consent was obtained from all participants.
Only participants ≥18 years of age with valid VCTE test data were included in the analysis. Individuals reporting high alcohol consumption (≥30 grams/day for men or ≥20 grams/day for women) were not included in the analysis (n = 235). In addition, 349 individuals were excluded due to the presence of hepatitis C ribonucleic acid or hepatitis B core antibody, and another 79 were excluded due to self-reported autoimmune hepatitis or other chronic liver condition, not including NAFLD. Subject selection and reasons for exclusion are shown in Figure 1.
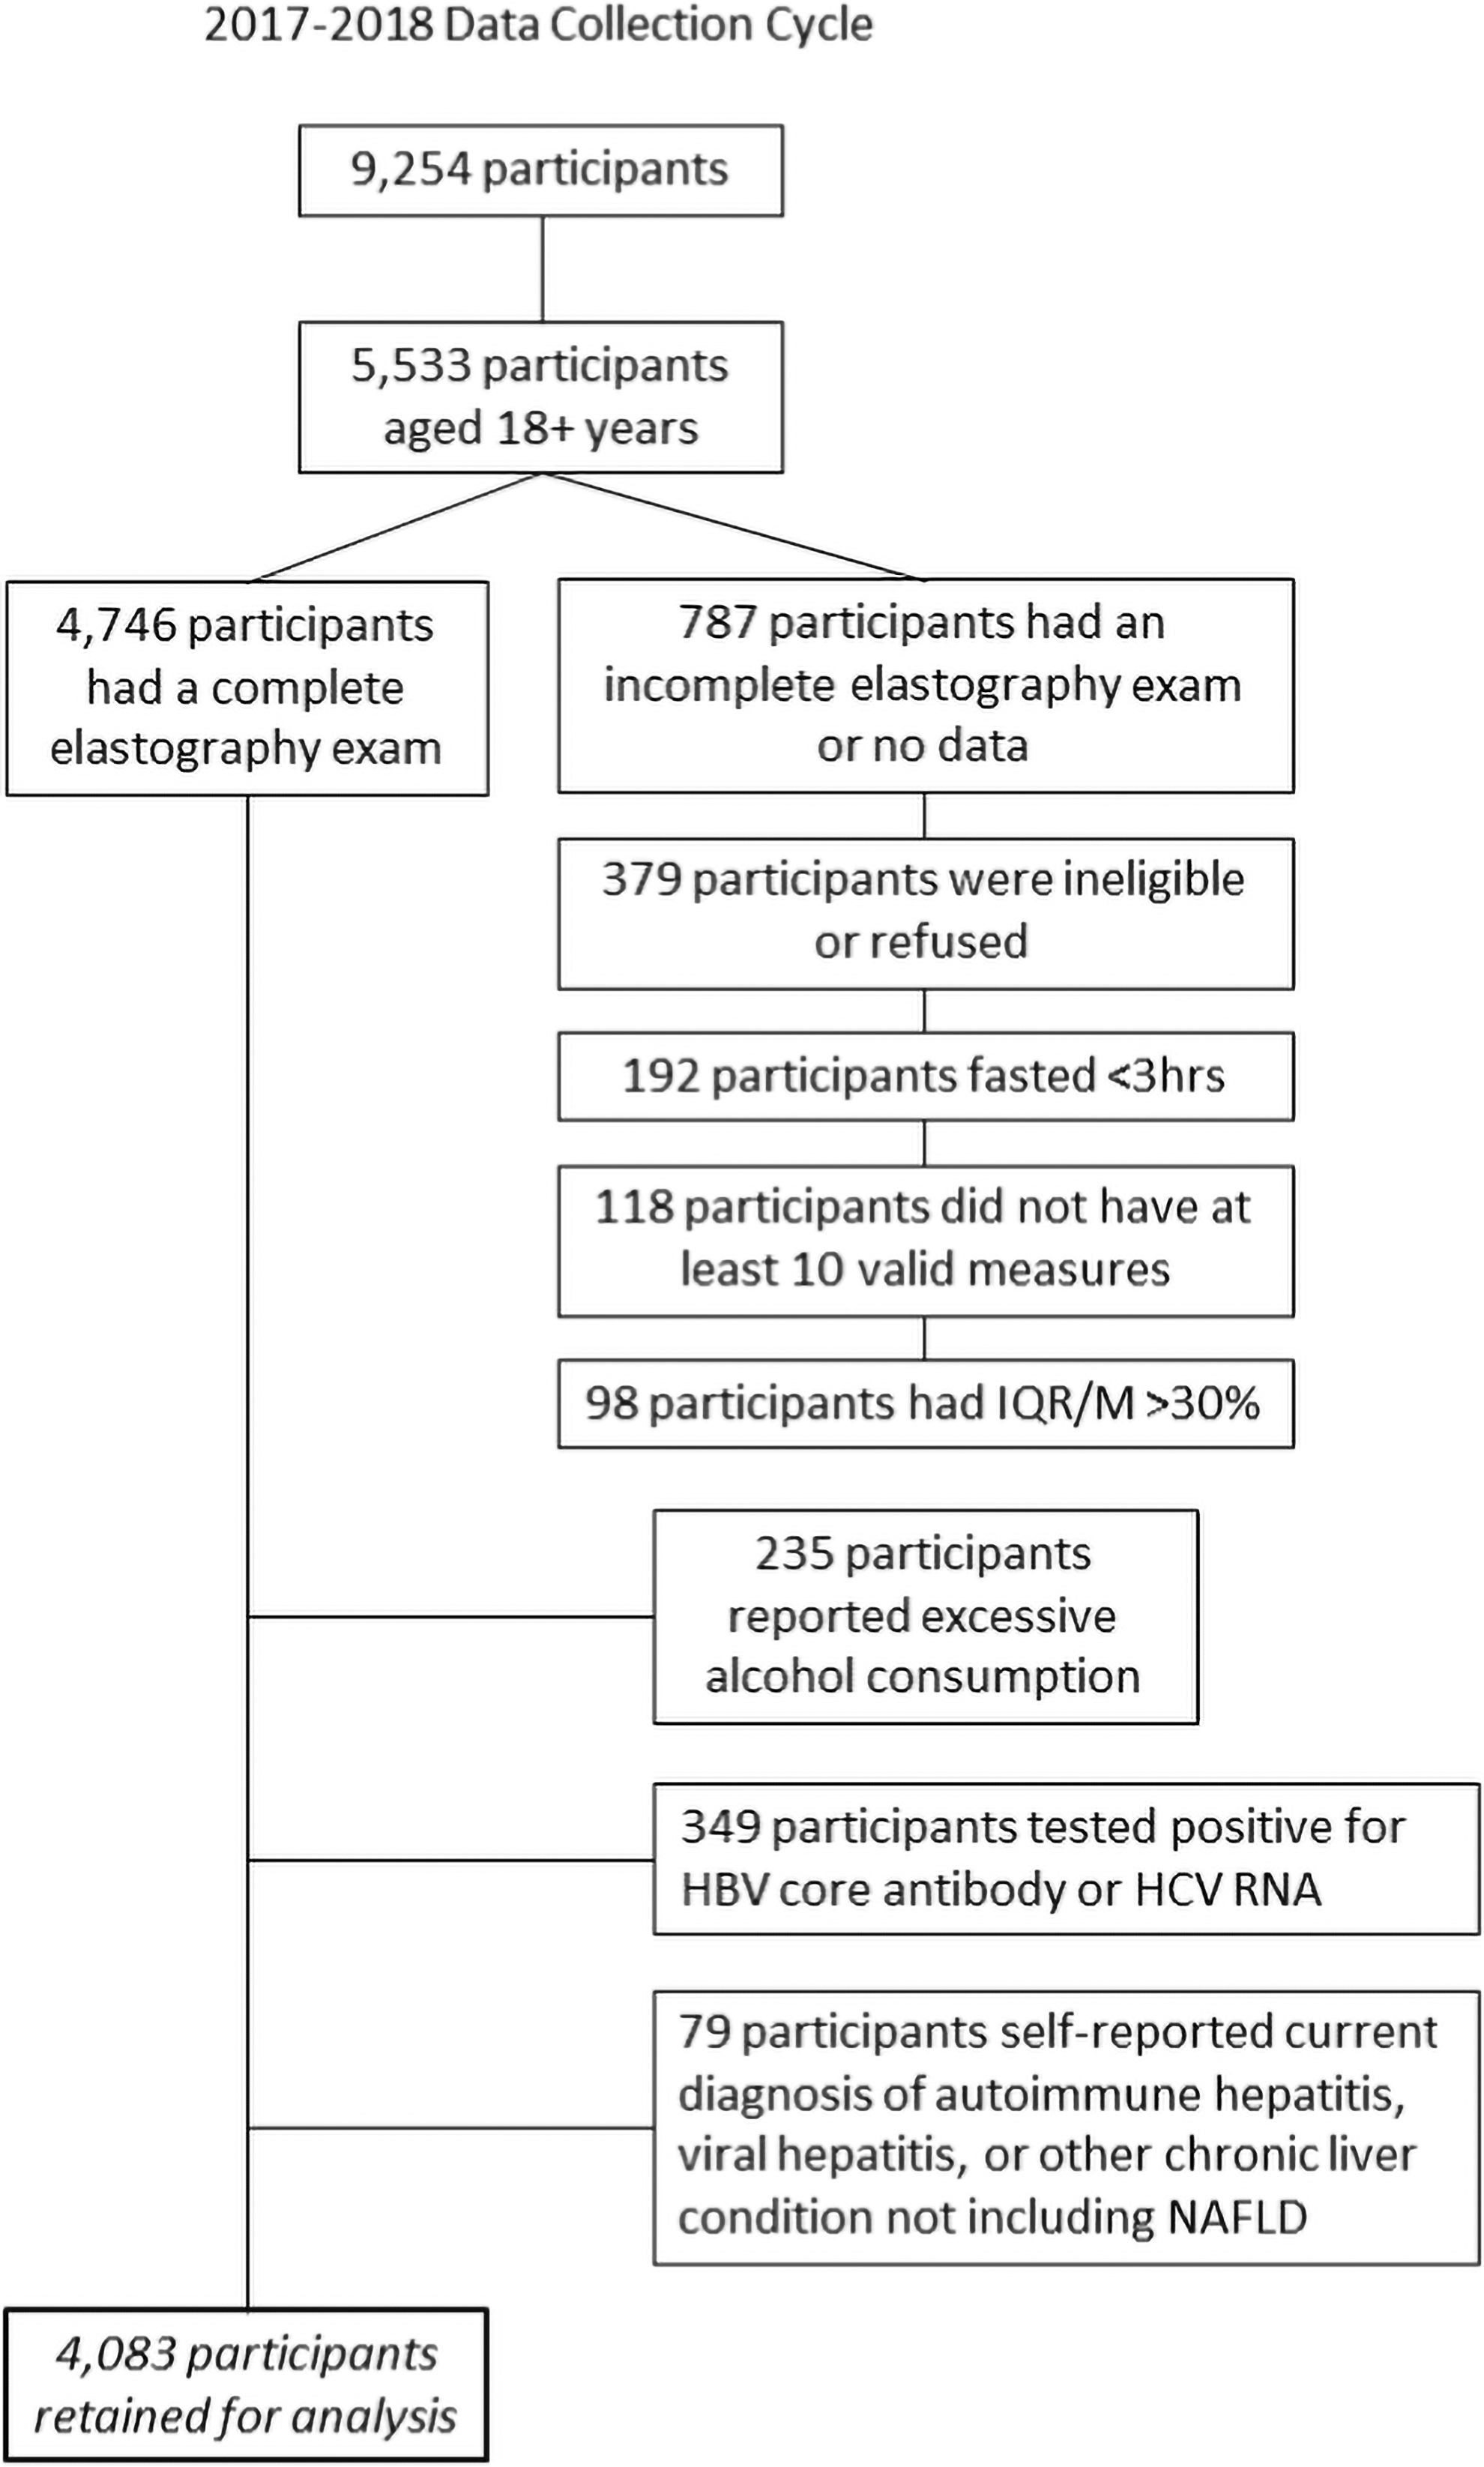
Participant selection.
Participants completed a home-based interview followed by a physical examination, medical history interview, and sample collection conducted in a mobile examination center (MEC). Dietary logs were used to assess alcohol consumption. Self-reported sociodemographic characteristics included age at the time of the survey, gender, race and ethnicity (non-Hispanic White, non-Hispanic Black, Hispanic, and other, including multiracial), and family poverty-to-income ratio (PIR).
PIR is calculated by dividing family (or individual) income by the poverty threshold index adjusted for family size; this index was provided by the Department of Health and Human Services. The cutoff point for participation in the Supplemental Nutrition Assistance Program is 130% of the federal poverty level. 12 Thus, we selected ≤130%, 130% to 350%, or >350% as relevant cut points for income classification. Pooling of sociodemographic variables was conducted.
Medical technicians collected biospecimens and conducted physical examinations, including VCTE, during the MEC visit. Sera and urine were used to assess each participant's biochemistry profile. Variables of interest included, but were not limited to, aspartate aminotransferase (AST), alanine aminotransferase (ALT), blood urea nitrogen, creatinine, gamma glutamyl transferase, cholesterol, and triglycerides. Elevated ALT levels were defined as values >33 IU/L for men and >25 IU/L for women. 13 During the morning MEC session, fasting glucose was measured in participants who had fasted for at least 8 hr (n = 2149).
BMI and blood pressure (BP) were assessed during the physical examination. BMI was calculated based on measured height (m) and weight (kg). This was categorized into ranges based on U.S. Centers for Disease Control and Prevention guidelines into underweight (<18.5), normal (18.5 to <25), overweight (25 to <30), and obese (≥30). Obese individuals were further categorized into class 1, 2, or 3 based on BMI cut points of 30 to <35, 35 to <40, and ≥40, respectively.
The physical examination also included dual-energy x-ray absorptiometry (DXA) scan and VCTE. DXA is used to assess body composition and is commonly employed due to its speed, accuracy, and noninvasive nature. Pregnant females were ineligible for DXA as were participants older than 59 years. Participants with a self-reported history of radiographic contrast material use in the past 7 days, and those exceeding a weight of 450 pounds or a standing height of 77 inches were also ineligible.
VCTE was accomplished using FibroScan (Echosens, Paris, France). Women who reported being pregnant or who were uncertain of their pregnancy status were not eligible for VCTE. In addition, those with implanted electronic medical devices and those wearing a bandage or who had lesions where the measurements would be taken were not eligible. Examinations were deemed complete if the participant had fasted at least 3 hr before the test and if the technician was able to obtain at least 10 valid stiffness measurements with a liver stiffness interquartile range/median stiffness of less than 30%. All examinations were completed using either the M or XL probe based on an automatic probe selection tool embedded in the device software. Further detail regarding the FibroScan examination procedure has been previously reported. 14,15
Fibrosis stages F0/F1 to F4 were determined by median stiffness measurements. Stage F0/F1 (no or mild liver scarring) were identified by scores of <8.2 kPa, F2 (moderate liver scarring) by 8.2 to 9.6 kPa, F3 (severe liver scarring) by 9.7 to <13.5 kPa, and F4 (advanced liver scarring) by ≥13.6 kPa. 16 Hepatic steatosis was graded S0, S1, or S2/S3 based on an individual's median controlled attenuation parameter (CAP) score. S0 was identified by median CAP scores <302 dB/m, S1 by 302–330 dB/m, and S2/3 by >330 dB/m. 16
Serum cotinine levels were used to determine an individual's smoking status as it more accurately reflects nicotine exposure than self-report. 17 Cotinine is a proximate biomarker for recent tobacco use and environmental tobacco smoke exposure with a half-life of ∼15–20 hr. Serum cotinine concentrations were measured using an isotope-dilution high-performance liquid chromatography-atmospheric pressure chemical ionization tandem mass spectrometric method. 18 Based on these data, participants were stratified into two groups (nicotine users or non-nicotine users) using previously determined racial and ethnic-based cut points. 19 Cotinine data were log-transformed before analyses.
All analyses were conducted using provided sample weights to account for the complex survey design and provide accurate estimates. Statistical significance was declared at the P < 0.05 level. Estimates with standard errors of 30% or greater were considered unreliable and flagged. Summary statistics are provided for categorical variables and include the number of participants as well as the weighted prevalence within each category. Prevalence estimates are reported as percentages with 95% confidence intervals (95% CI). Pairwise comparisons were made using Rao-Scott χ 2 tests of independence. Odds ratios (ORs) and adjusted odds ratios (aORs) with 95% CIs were estimated using multivariable logistic regression models.
Participants' age, race/ethnicity, BMI, BP, homeostatic model assessment (HOMA) index score, and laboratory values were included as covariates in regression models as predictors of hepatic health. To reach the final reduced models, we used a backward elimination method with a threshold of P < 0.05 for retention. Excluded variables were then added back into the final model individually so that changes in the β coefficients of the statistically significant main effect could be assessed. If addition of one of these excluded variables caused a change in a β coefficient by ≥10%, the variable was re-added to the model.
Standard errors were calculated using the Taylor series linearization method. Missing data were treated as missing and no attempt to impute missing data was made. All analyses were accomplished using SPSS Complex Samples (SPSS version 25, IBM, Chicago, IL).
Results
Characteristics of the 4083 participants assessed for manifestations of liver disease are shown in Table 1. The sample consisted of 48.4% (n = 1976; 95% CI: 46.4–50.4) men and 51.6% (n = 2107; 95% CI: 49.6–53.6) women, representing ∼187 million noninstitutionalized adults residing in the United States. The average age for men and women was 45 years (95% CI: 44–47) and 47 years (95% CI: 46–49), respectively.
Participant Characteristics, N = 4083
Smoking status n = 3868.
PIR ratio n = 3551.
CI, confidence interval; PIR, poverty-to-income ratio.
Weighted prevalence estimates for hepatic health are reported in Table 2. Overall, 7.7% (95% CI: 6.1–9.6) of participants had fibrosis (F2+) and 27.3% (95% CI: 25.3–29.4) had hepatic steatosis (S1+). Neither smoking nor family income was significantly associated with steatosis (both P > 0.05). In contrast, hepatic steatosis was independently associated with age, gender, race/ethnicity, BMI, and diabetes (all P < 0.01). Age and BMI were positively correlated with CAP scores (all P < 0.001). Table 3 details prevalence estimates of steatosis by gender and age.
Prevalence Estimates for Hepatic Health (%, 95% Confidence Interval)
Prevalence Estimates of Steatosis by Gender and Age (%, 95% Confidence Interval)
Standard error >30%.
The mean CAP score of men was 272 dB/m (95% CI: 267–278), and the mean among women was 252 dB/m (95% CI: 248–256). Age adjusted, men were 1.7 times more likely (95% CI: 1.4–2.2) to have hepatic steatosis (S1+) compared to women (P < 0.001). Similarly, men were 1.8 times more likely (95% CI: 1.4–2.4) to have steatosis grade S2 or S3 compared to women (P < 0.001).
Non-Hispanic Blacks were found to have the lowest mean CAP scores (246 dB/m; 95% CI: 241–252; P < 0.01). Hispanic participants had the highest scores with a mean of 267 dB/m (95% CI: 262–272); however, there was no statistical difference between the CAP scores of Hispanics, non-Hispanic Whites (263 dB/m; 95% CI: 277–269), and non-Hispanic Asians (260 dB/m; 95% CI: 255–266). Compared to non-Hispanic Blacks and independent of group differences with respect to age, gender, and BMI, the aOR for steatosis (S1+) was 2.2 (95% CI: 1.7–3.0) among non-Hispanic Whites, 3.3 (95% CI: 2.3–4.7) for Hispanics, 4.5 (95% CI: 3.0–6.7) for non-Hispanic Asians, and 2.1 (95% CI: 1.2–3.8) for other races, including multiracial participants. No interaction effect was observed between gender and race.
Based on BMI, the majority of participants was classified as either overweight (30.9%; 95% CI: 28.3–33.6) or obese (41.6%; 95% CI: 36.8–46.5). Only 27.6% (95% CI: 24.2–31.2) of the sample were categorized as either normal weight or underweight. BMI was related to both steatosis and fibrosis at the P < 0.001 level with r 2 values of 0.32 and 0.11, respectively.
Steatosis (≥S1) was present in 3.6% (95% CI: 2.0–6.1), 18.7% (95% CI: 15.3–22.7), and 49.4% (95% CI: 45.6–53.2) of those classified as underweight/normal weight, overweight, or obese, respectively. Specifically for obesity, steatosis (≥S1) was present in 37.2% (95% CI: 32.4–42.3), 58.2% (95% CI: 50.4–65.6), and 68.9% (95% CI: 62.6–74.6) of those classified with Class 1, 2, or 3 obesity, respectively.
Assessing participants for hepatic fibrosis revealed that 7.7% (95% CI: 6.1–9.6) of noninstitutionalized U.S adults had hepatic fibrosis stage ≥F2. Hepatic steatosis (≥S1) was present in 23.9% (95% CI: 21.8–26.0) of those without fibrosis, 62.3% (95% CI: 46.7–75.7) of those with moderate fibrosis (F2), and 72.3% (95% CI: 61.1–81.3) of those with severe fibrosis or advanced liver scarring (F3/F4). As with hepatic steatosis, nicotine use was not significantly associated with fibrosis (P = 0.49). In multivariable analysis age, gender, BMI, and diabetes were all independently related to and positively correlated with liver stiffness scores (all P < 0.05). No race/ethnicity differences were noted with respect to the prevalence of liver fibrosis (P = 0.22). Table 4 lists prevalence estimates of fibrosis by age and severity.
Prevalence Estimates of Liver Stiffness by Age
Overall, 9.2% (95% CI: 6.8–9.6) of men were found to have some liver scarring (≥F2) compared to 6.2% of women (95% CI: 4.8–8.0; P < 0.001). Adjusting for difference in age and BMI, men were 1.6 times more likely (95% CI: 1.1–2.5) to have moderate liver scarring (F2) and 2.8 times more likely (95% CI: 1.5–5.4) to have severe or advanced liver scarring (F3/F4) compared to women.
Among normal weight and underweight participants, 97.9% (95% CI: 95.8–99.0) had liver stiffness measurements <8.2 kPa (F0/F1). This rate was nearly identical for overweight individuals, with 96.8% (95% CI: 95.7–97.7) having stiffness measurements <8.2 kPa. In contrast to these groups, 85.3% (95% CI: 80.8–88.9) of obese participants were free of liver fibrosis. Participants who reported a prior diagnosis of diabetes were 5.0 times (95% CI: 3.6–6.9) more likely to have steatosis (≥S1) and 5.4 times more likely (95% CI: 4.1–7.2) to have fibrosis (≥F2). The relationships between diabetes and both steatosis and fibrosis were independent of age and gender (both P < 0.001).
Table 5 lists the prevalence of both steatosis and fibrosis by gender and BMI category. Of the available data, BMI was the greatest predictor of hepatic health. Results of general linear models indicated significant associations between BMI and both hepatic steatosis and fibrosis (both P < 0.001; r 2 = 0.21 and 0.10, respectively). Tables 6 and 7 list selected characteristics of the participants by hepatic steatosis and fibrosis score, respectively. Despite a number of factors being independently associated with steatosis and fibrosis, most factors did a poor job of explaining variation in data, with most yielding r 2 values under 0.05.
Prevalence of Hepatic Steatosis and Fibrosis by Gender and Body Mass Index Category, N = 4049
Standard Error >30%.
BMI, body mass index.
Mean Characteristics of Participants by Steatosis Category
Significance values based on univariate analysis.
ALT, alanine transaminase; AST, aspartate transaminase; BP, blood pressure; FPG, plasma fasting glucose; HDL, high-density lipoproteins; HOMA, homeostatic model assessment.
Mean Characteristics of Participants by Fibrosis Category
Significance values based on univariate analysis.
Multivariable regression models were carried out to assess to what degree variables could predict steatosis and fibrosis. Results of the reduced model for steatosis indicated that it explained 37.0% of the variance, P < 0.001. Significant contributors to the model included BMI (β = 0.14, P < 0.001), systolic BP (β = 0.02, P < 0.001), and HOMA index score (β = 0.12, P < 0.01). This model correctly classified 93.9% of individuals with no steatosis and 41.8% with steatosis. The overall classification accuracy of the model was 80.9%.
Results of the reduced multivariable model for fibrosis indicated that it explained 30.4% of the variance, P < 0.001. Significant contributors to the model included BMI (β = 0.15, P < 0.001), AST (β = 0.04, P < 0.001), and age (β = 0.03, P < 0.01). This model correctly classified 99.1% of individuals with no fibrosis and 17.1% with fibrosis. The overall classification accuracy of the model was 91.7%.
Discussion
Utilizing VCTE, which is more accurate in determining hepatic steatosis and fibrosis compared to standard liver ultrasound or laboratory data/prediction tools, we found that 27.3% of U.S. adults or an estimated 51 million individuals had steatosis. Furthermore, 7.7% of those in the sample, which represents 14 million individuals, were found to have fibrosis. Together, these results underscore the weight of our findings.
The importance of NAFLD is not only in its possible progression to cirrhosis but also in its association with the components of metabolic syndrome and link to cardiovascular disease. 3 We found that age, gender, BMI, and diabetes were all independently associated with both hepatic steatosis and fibrosis, and as expected, BMI was by far the greatest predictor of both. Although steatosis was increasingly present across all BMI categories, its prevalence particularly increased from overweight to obese categories and from Class 1 to Class 2 obesity. Fibrosis prevalence was nearly identical between normal-weight and overweight individuals and only substantially increased in those who were obese. Clearly, BMI, more specifically obesity, is strongly related to hepatic steatosis and fibrosis.
The question then arises whether VCTE should be used to screen those with obesity. The American Association for the Study of Liver Diseases has not recommended routine screening for NAFLD even in high-risk groups due to uncertainties over diagnostic tests, treatment options, and cost-effectiveness. 1 Alternatively, the European Association for the Study of the Liver recommends screening with laboratory evaluation and/or ultrasound in those patients with obesity or metabolic syndrome. 20
In our study, 42.7% of all adults were classified with obesity, thus differentiating which individuals with obesity to screen with VTCE would be optimal from a population health perspective if access and cost were prohibitive. In particular, identifying those with obesity who are at risk for hepatic fibrosis would be beneficial. Multivariate modeling indicated the combination of BMI, AST, and age had the best overall classification accuracy, but still only correctly classified those with fibrosis in 17% of subjects.
Another strategy would be to evaluate those with significant risk for steatosis since steatosis (≥S1) was present in approximately a quarter of those without fibrosis, but approximately two-thirds of those with moderate or severe fibrosis (≥F2). Modeling indicated that the combination of BMI, systolic BP, and HOMA index score correctly classified ∼40% of subjects with steatosis. In addition to these multivariate predictors, individual variables that significantly predicted steatosis were high-density lipoprotein (HDL) cholesterol, triglycerides, uric acid, and self-reported diabetes.
Hence, fulfilling traditional metabolic syndrome criteria (combination of waist circumference, HDL-cholesterol, triglycerides, BP, and fasting plasma glucose), particularly in older adults with obesity, may be a reasonable way to determine which individuals should be offered VCTE.
One risk factor we clarified is the contribution of gender to NAFLD. Steatosis has not been consistently linked to gender, with multiple studies showing increased prevalence in men or women. We found that men had approximately twice the prevalence of steatosis as women at any grade. In addition, consistent to what others have reported, we found non-Hispanic Blacks were significantly less likely to have steatosis than other race/ethnicities; this persisted after controlling for BMI. We found no difference between other groups.
The principal strength of this study is that the data come from NHANES, which is weighted to represent the noninstitutionalized U.S. population. Also, a validated tool with well-established cut points was used to assess steatosis and fibrosis. Previous studies from NHANES used ultrasound or liver biomarkers that are insufficient for accurate diagnosis. Limitations of this study include its observational cross-sectional nature, the lack of physical activity measures that would have assisted with determining the contribution of metabolic health on the prevalence of steatosis and/or fibrosis at any BMI category, and insufficient numbers to differentiate the higher stages of fibrosis.
In conclusion, our study is the first U.S. national estimate of the prevalence of steatosis and fibrosis using a validated measure. The overall prevalence of significant steatosis and fibrosis was 27.3% and 7.7%, respectively. BMI was the most important predictor of both steatosis and fibrosis, and additionally, male gender, increasing age, and diabetes were independent predictors. Multivariate modeling showed the combination of BMI, systolic BP, and HOMA index best predicted steatosis, while the combination of BMI, AST, and age best predicted fibrosis.
Footnotes
Disclaimer
The views expressed herein are those of the authors and do not reflect the official policy of the Department of the Army, Department of Defense, or U.S. Government.
Acknowledgments
The authors thank Ms. Lindy Hall for her contributions to this research.
Author Disclosure Statement
No conflicting financial interests exist.
Funding Information
No funding was received for this article.