




Abstract
Background:
The rs7903146 variant in the TCF7L2 gene is associated with defects in postprandial insulin and glucagon secretion and increased risk of type 2 diabetes. However, it is unclear if this variant has effects on glucose metabolism that are independent of islet function.
Methods:
We studied 54 nondiabetic subjects on two occasions where endogenous hormone secretion was inhibited by somatostatin. Twenty-nine subjects were homozygous for the diabetes-associated allele (TT) and 25 for the diabetes-protective allele (CC) at rs7903146, but otherwise matched for anthropometric characteristics. On 1 day, glucagon infused at a rate of 0.65 ng/kg/min, and at 0 min prevented a fall in glucagon (nonsuppressed day). On the contrary, infusion commenced at 120 min to create a transient fall in glucagon (suppressed day). Subjects received glucose (labeled with [3-3H]-glucose) infused to mimic the systemic appearance of oral glucose. Insulin was infused to mimic a prandial insulin response. Endogenous glucose production (EGP) was measured using the tracer dilution technique.
Results:
Lack of glucagon suppression increased postchallenge glucose concentrations and impaired EGP suppression. However, in the presence of matched insulin and glucagon concentrations, genetic variation in TCF7L2 did not alter glucose metabolism.
Conclusion:
These data suggest that genetic variation in TCF7L2 alters glucose metabolism through changes in islet hormone secretion.
Introduction
Type 2 diabetes is a common metabolic disorder that results from a complex interaction between genes and the environment. 1 Although genome-wide association studies have identified multiple genetic loci that predispose to the disease, 2 –4 variation at rs7903146 in the TCF7L2 locus is arguably the locus with the greatest effect on disease predisposition. 5 Multiple investigators have shown that diabetes-associated variation at TCF7L2 impairs insulin secretion in nondiabetic subjects. 6 –9 More recently, we demonstrated that the diabetes-associated allele at rs7903146 is also associated with impaired suppression of glucagon after ingestion of glucose. 10
Defects in insulin and glucagon secretion contribute to the pathogenesis of type 2 diabetes. 11 In lean nondiabetic subjects, Shah et al. demonstrated that a lack of glucagon suppression caused hyperglycemia. Although this was especially marked with a postchallenge insulin profile mimicking that observed in people with type 2 diabetes, hyperglycemia was also observed with a “nondiabetic” insulin profile. 12
As part of a series of experiments intended to quantify the interaction of impaired glucagon suppression with insulin secretion to alter endogenous glucose production (EGP), we studied 54 subjects on two occasions in the presence of suppressed glucagon (SG) and nonsuppressed glucagon (NSG). 13 The experimental design afforded us an opportunity to examine whether diabetes-associated variation in the TCF7L2 locus has direct effects on glucose metabolism, independent of changes in islet function.
Although most, 14,15 but not all, 16,17 studies suggest that the T-allele at rs7903146 has no direct effects on hepatic glucose metabolism or insulin action, clamp conditions do not replicate postprandial conditions adequately. 18 However, by balancing recruitment by the rs7903146 genotype (CC vs. TT—diabetes-protective vs. diabetes-associated, respectively), we are able to measure a genotype-attributable effect on glucose metabolism when insulin and glucagon concentrations are matched in response to an identical glucose challenge.
We report that under these experimental conditions, diabetes-associated genetic variation in TCF7L2 does not directly alter glucose metabolism.
Methods
Screening
The details of this experiment have been reported previously. 13 After approval by the Mayo Institutional Review Board, we utilized the Mayo Clinic Biobank (a repository of 50,000 DNA samples collected from volunteers), to identify a new cohort of 2000 individuals aged 25–70 without diabetes, and who resided within a 100-mile radius of the Mayo Clinic (Rochester, MN). Their genotype at rs7903146 was determined as before. 10 Subsequently, those individuals with a suitable genotype were invited to participate in this study. Those who expressed interest were invited to the Clinical Research Unit and, after informed consent was obtained, underwent a 2-hr 75-gram oral glucose tolerance test (OGTT) as per our usual practice. 19
In this way, we recruited a total of 29 nondiabetic subjects homozygous for the disease-causing allele (TT) and 25 subjects homozygous for the disease-protective allele (CC) at rs7903146. The cohorts were otherwise matched for age, gender, fasting glucose, and bodyweight. Participants had no history of chronic illness or diabetes. All subjects were instructed to follow a weight maintenance diet containing 55% carbohydrate, 30% fat, and 15% protein for at least 3 days before the study. Body composition was measured using dual-energy X-ray absorptiometry (Lunar, Madison, WI) at screening.
Experimental design
All subjects completed the two studies described below—the NSG study day and the SG study day on separate occasions. The two study days were performed in random order, at least 2 weeks apart. The experimental design is shown in Fig. 1. On both study days, subjects were admitted to the Clinical Research and Trials Unit (CRTU) at 17:00 on the day before study. They then consumed a standard 10 kcal/kg meal (55% carbohydrate, 30% fat, 15% protein) and fasted overnight. The following morning (05:30), a forearm vein was cannulated to allow infusions to be performed. In addition, a cannula was inserted retrogradely into a vein of the contralateral dorsum of the hand, which was then placed in a heated Plexiglas box maintained at 55°C to allow sampling of arterialized venous blood.

Experimental design utilized.
At ∼06:00 (−180 min), a primed (10 μCi prime, 0.1 μCi/min continuous) infusion containing trace amounts of [3- 3 H] glucose was started and continued until 09:00 (0 min). At 09:00 (0 min), the infusion was decreased in a way that mimics the anticipated fall in EGP. In addition, a “prandial” glucose infusion also labeled with [3- 3 H] glucose was started to produce glucose concentrations similar to those observed after oral ingestion of 75 grams of glucose. 20 This minimizes variation in specific activity, ensuring accurate measure of glucose turnover. 21
An infusion of somatostatin (60 ng/kg/min) was started at time 0 to inhibit endogenous islet secretion and therefore ensure identical portal insulin concentrations on the two study days. 14 Insulin was infused using a variable insulin infusion to mimic postprandial insulin secretion concentrations. 22
On the NSG study day, at time 0, glucagon was infused at 0.65 ng/kg/min until the end of the study to maintain glucagon concentrations as previously described. 23
On the SG study day, no glucagon was infused for the first 120 min, and then was infused at 0.65 ng/kg/min from 120 to 300 min to mimic postprandial glucagon suppression. 13
Analytic techniques
All blood was immediately placed on ice after collection, centrifuged at 4°C, separated, and stored at −80°C until assay. Plasma glucose concentrations were measured using a Yellow Springs glucose analyzer. Plasma insulin concentrations were measured using a chemiluminescence assay (Access Assay, Beckman, Chaska, MN). Plasma C-peptide was measured using a 2-site immunoenzymatic sandwich assay (Roche Diagnostics, Indianapolis, IN). Glucagon was measured using a two-site enzyme-linked immunosorbent assay (Mercodia, Winston Salem, NC) in accordance with the manufacturer's instructions. [3- 3 H] glucose-specific activity was measured by liquid scintillation counting following deproteinization. 24
Calculations
The oral minimal model was used to calculate β cell responsivity, insulin action, and disposition index from the screening OGTT data. 25 Two-segment smoothing using the method of Bradley et al. was used to decrease variation in specific activity. 26 Glucose appearance and disappearance were calculated using the nonsteady-state equations of Steele et al., using the tracer infusion rate for each interval. 27 The volume of distribution of glucose was assumed to equal 200 mL/kg, with a pool correction factor of 0.65. 28 EGP was calculated by subtracting the glucose infusion rate from the tracer-determined rate of glucose appearance. 21 All rates of turnover are expressed per Kg/lean body mass.
Statistical analysis
All continuous data are summarized as mean ± standard error of the mean. Area under the curve (AUC) and area above basal were calculated using the trapezoidal rule for each subject on the NSG and SG day, respectively. An unpaired, two-way Student t-test (parametric) or a Mann–Whitney test (nonparametric) was used to examine changes between genotype groups. The D'Agostino and Pearson omnibus normality test implemented in Prism 5 (GraphPad Software, San Diego, CA) was utilized to determine if data were normally distributed. A P value <0.05 was considered statistically significant.
Results
Subject characteristics at screening in each genotype group
We studied 29 subjects with the TT genotype and 25 subjects with the CC genotype at rs7903146 (Table 1, Fig. 2). The groups were matched for age (54 ± 2 vs. 54 ± 2 years, P = 0.98 TT vs. CC, respectively), body mass index (28.7 ± 0.7 vs. 27.1 ± 0.7 kg/m2, P = 0.13), and sex (68% female in both groups) with varying degrees of glucose tolerance. Similarly, to what we observed previously, 10 subjects with the TT genotype had higher fasting glucagon concentrations and impaired postchallenge suppression (2.0 ± 0.1 vs. 1.7 ± 0.1 nmol per 2 hrs, P = 0.03—Fig. 1).
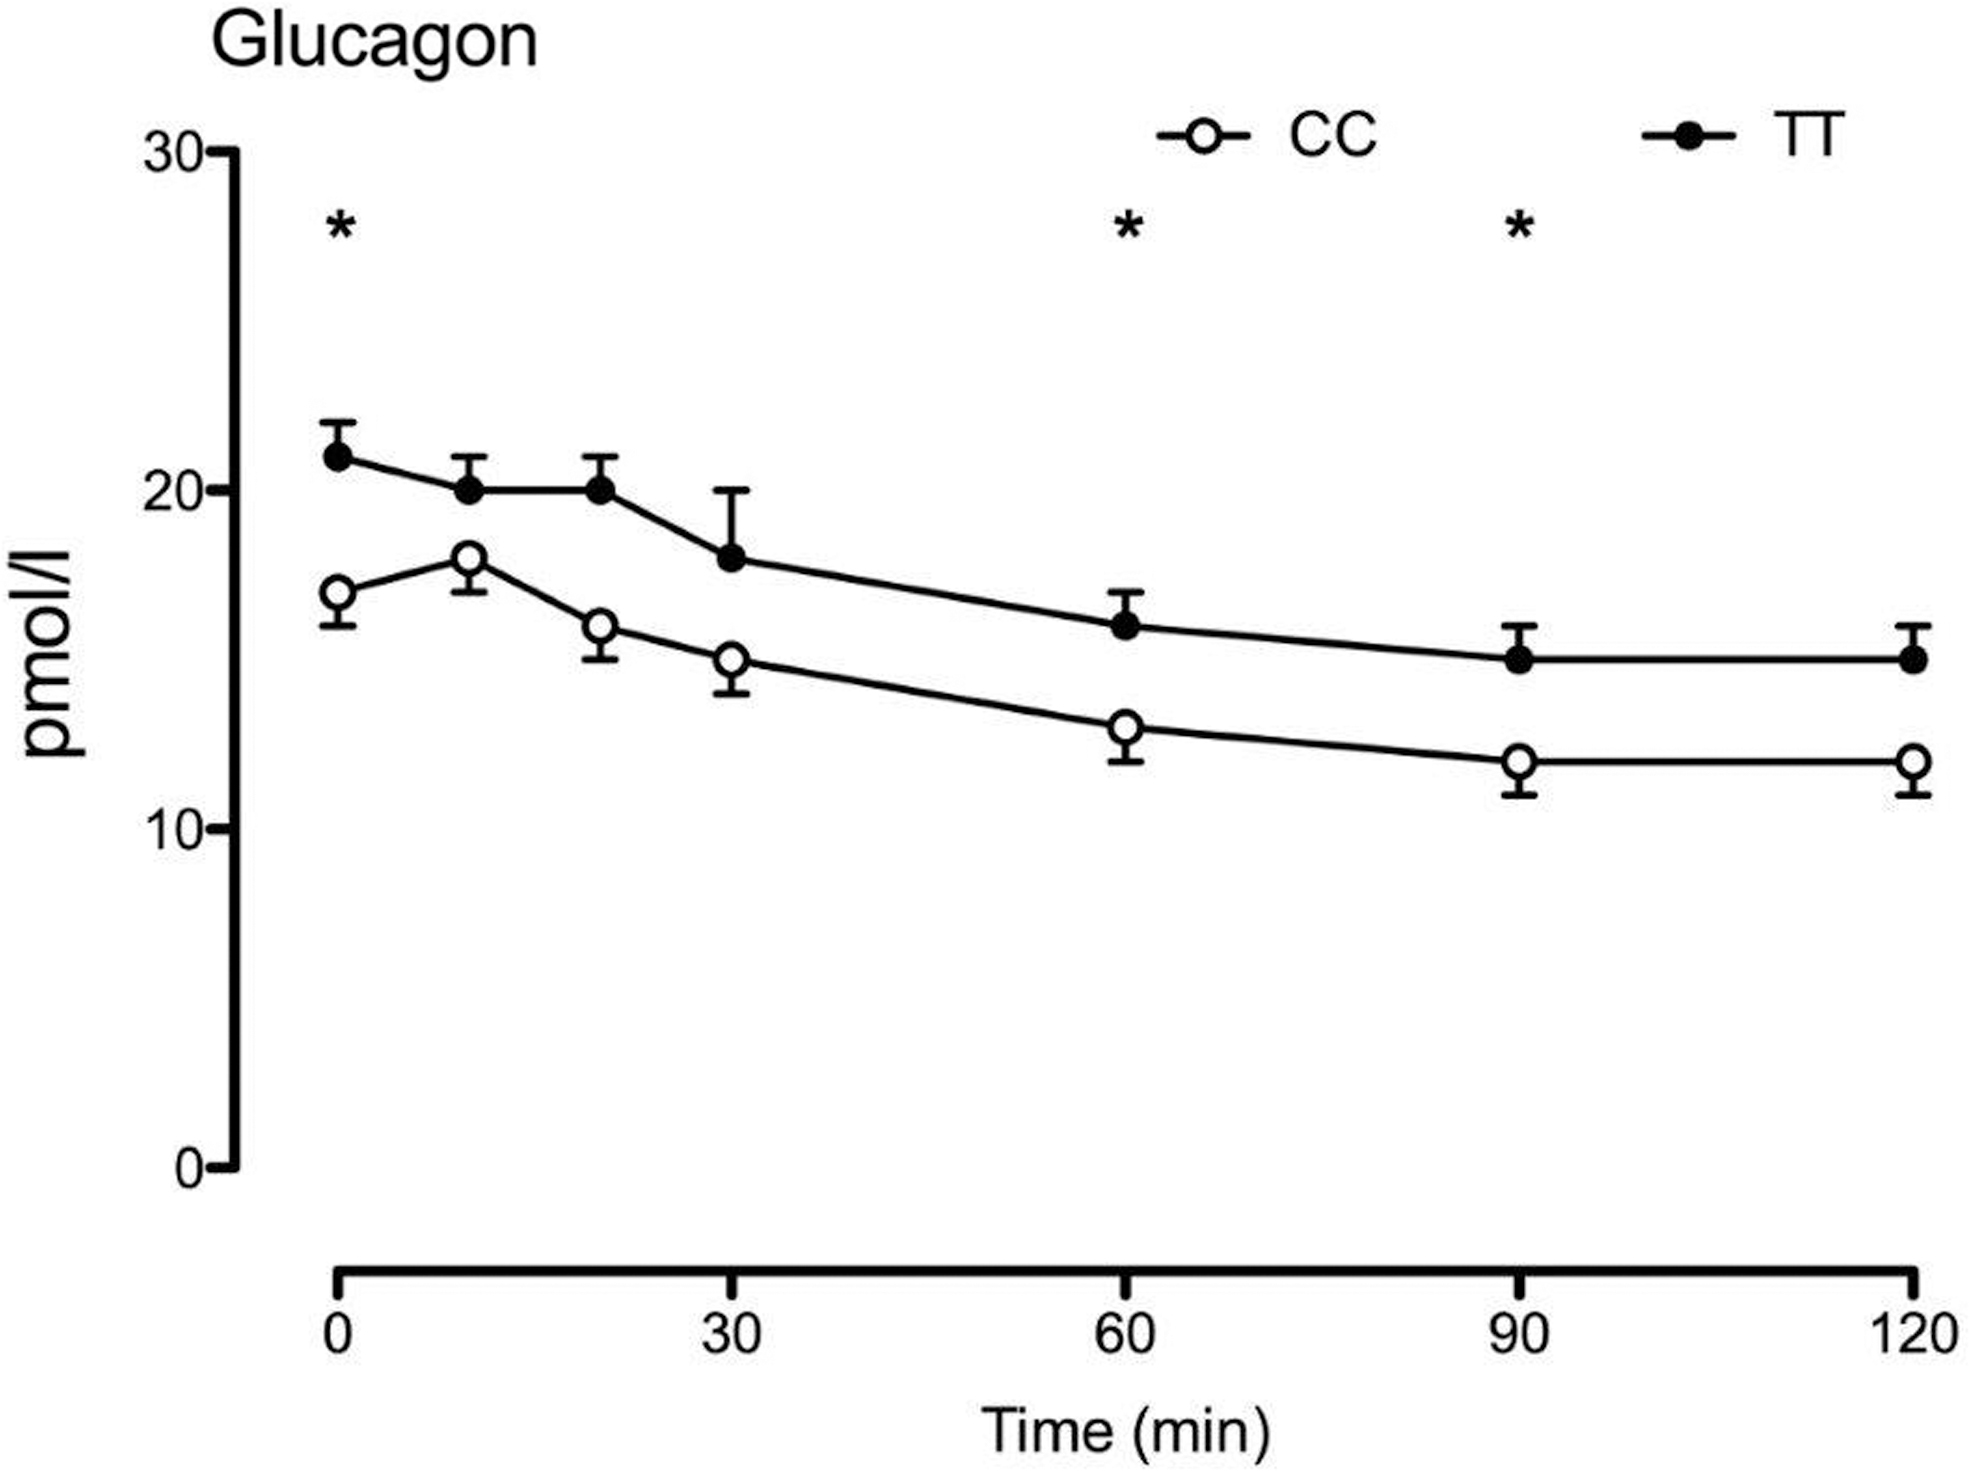
Genotype at rs7903146 altered glucagon concentrations during the OGTT screening. Note that glucagon concentrations during the OGTT screening were measured by radioimmunoassay (EMD Millipore, Billerica, MA). *P value <0.05 for a two-tailed unpaired t-test. OGTT, oral glucose tolerance test.
Participant Characteristics at the Time of Screening When Characterized by TCF7L2 Genotype at rs7903146
P-values represent results of an unpaired two-tailed t-test except for *, which represents the results of a chi-squared test.
BMI, body mass index; CC, diabetes-protective allele; TT, diabetes-associated allele.
Glucagon, insulin, and C-peptide concentrations in each genotype group during the NSG and SG study days
Fasting glucagon concentrations were higher in the TT group compared with the CC genotype group on the NSG (Fig. 3A) and the SG (Fig. 3B) study days (e.g., mean fasting glucose on the SG day was 7.3 ± 0.8 vs. 5.1 ± 0.5 pM, P = 0.02). Fasting insulin concentrations (Fig. 3C, D) did not differ between genotype groups on either study day.

Glucagon, insulin, and C-peptide concentrations during the nonsuppressed
By design, somatostatin inhibited endogenous insulin (and glucagon) secretion in both groups. C-Peptide concentrations decreased (Fig. 3E, F) over the course of both study days. After time 0 when insulin and glucagon were infused, concentrations of these hormones (Fig. 3A–D) did not differ between genotype groups on either study day.
Glucose, EGP, and glucose disappearance in each genotype group during the NSG and SG study days
When insulin and glucagon concentrations were matched in the genotype groups, the response to intravenous glucose did not differ during both the NSG (Fig. 4A) and SG (Fig. 4B) study days.
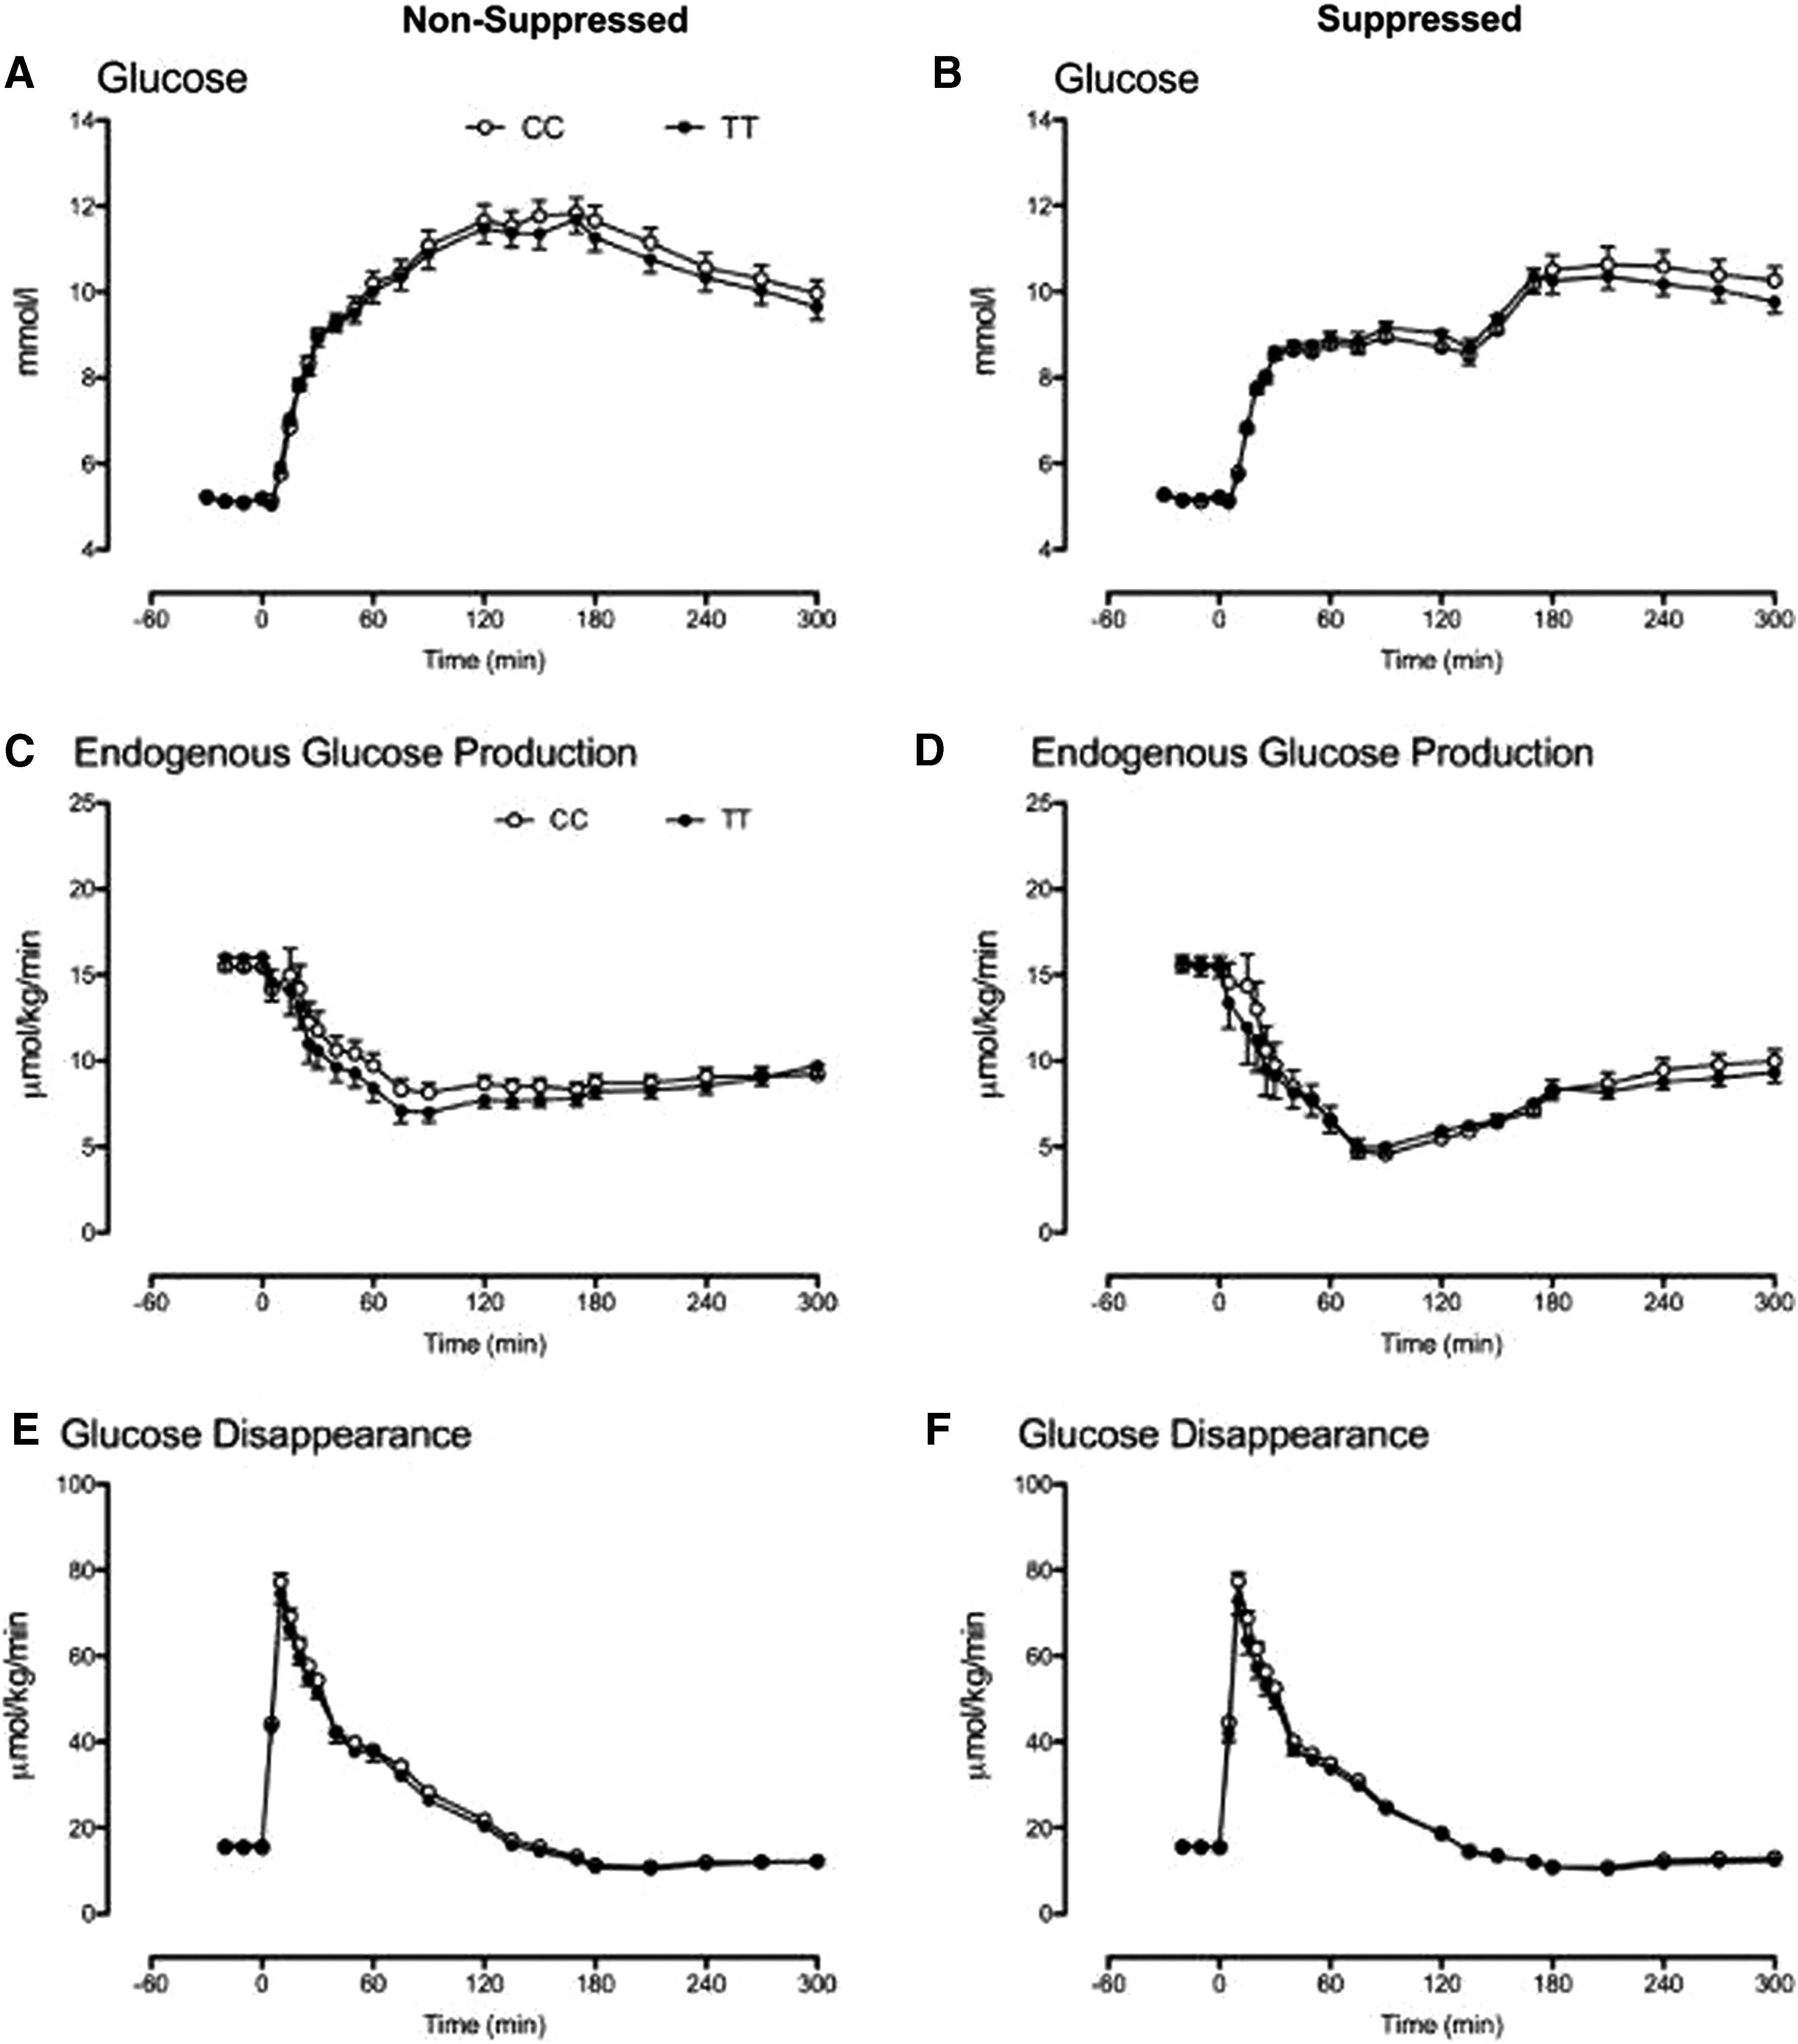
Glucose concentrations and rates of EGP and glucose disappearance during the nonsuppressed
Fasting and nadir EGP also did not differ between genotype groups during the NSG (Fig. 4C) and the SG (Fig. 4D) study days. Similarly, fasting, peak, and integrated glucose disappearance did not differ during the NSG (Fig. 4E) and the SG (Fig. 4F) study days.
Discussion
We and others have used diabetes-associated genetic variation in TCF7L2 to probe the pathogenesis of type 2 diabetes. 29 This work has suggested that TCF7L2 alters islet responses to glucose. Indeed, people with two copies of the diabetes-associated allele (T) at rs7903146 exhibited impaired postprandial suppression of glucagon. In addition, the hyperbolic relationship of β cell responsivity with insulin action was altered so that people with the TT genotype had comparatively decreased responsiveness for a given insulin action. However, the effects of insulin on glucose metabolism in an individual depend on both insulin secretion and insulin action.
There has been some controversy as to whether the genetic variation in TCF7L2 also alters insulin action and has direct effects on hepatic metabolism. 16,30 –32 To address this, we utilized a euglycemic clamp and the deuterated water method to show that the genotype at rs7903146 did not alter insulin's effects on EGP, peripheral glucose disposal, and the contribution of gluconeogenesis to glucose production. 14 Our data to date have demonstrated that diabetes-associated variation at TCF7L2 alters insulin secretion and action, as well as glucagon secretion in nondiabetic humans. To date it is unknown if these variants alter the hepatic response to glucagon. The experimental design utilized in this series of experiments enabled us to ascertain whether EGP and glucose disposal responses to SG or NSG are affected by the rs7903146 genotype when insulin concentrations are matched.
In this experiment, when glucagon was suppressed, the EGP nadir and integrated AUC did not differ between genotype groups. A similar result was observed when glucagon was suppressed for the first 2 hrs after intravenous glucose challenge (SG study day). Although insulin concentrations did not differ between the two study days, no differences in peak and integrated glucose disappearance were observed between genotype groups. These experimental results support our prior findings that genetic variation in TCF7L2 does not alter insulin action. 10,33 As previously, we noted differences in glucagon secretion: fasting glucagon concentrations were higher in subjects with the TT genotype (before the start of the experiment) as well as at the time of screening (Fig. 1).
It is certainly possible that our experiment lacked the power to detect very small differences in insulin action between genotype groups. However, using nadir suppression of EGP as an example, this experiment is powered to detect a between-group difference of 22%—1.5 μmol/kg/min. An experiment powered to detect a 10% difference—0.7 μmol/kg/min, would require ∼130 subjects in each genotype group. Previously, a large study of 550 individuals using a euglycemic hyperinsulinemic clamp also demonstrated that the rs7903146 genotype was not associated with differences in insulin action. 15
There are other limitations to the experiment that need to be acknowledged. The first is that by using somatostatin, we inhibited gastrointestinal motility and were therefore unable to give glucose by mouth. Intravenous delivery of glucose does not stimulate incretin hormone secretion, which might directly affect insulin and glucagon secretion. On the contrary, there is no evidence that oral versus intravenous delivery of glucose alters hepatic glucose metabolism in humans. 34 More importantly, we were able to match insulin and glucagon concentrations between genotype groups to assess the effect of TCF7L2 on hormone action.
The subjects studied were nondiabetic and had relatively normal glucose tolerance compared with the larger more heterogenous group we studied previously. Indeed, in this cohort, β cell function was relatively intact, and abnormalities in α cell function were relatively subtle. However, by design, the experiment sought to compare responses to glucagon (and secondarily to insulin) when concentrations of these hormones were matched across the genotype groups.
Finally, the concentrations of insulin present during the experiment likely did not match the portal concentrations of insulin normally present in the postprandial period. The relative insulin deficiency in these circumstances might exaggerate the effects of glucagon on EGP. Nevertheless, the values of glucose disappearance and EGP that we observed during the experiment are similar to those we observe in nondiabetic subjects studied using an oral challenge. 35
This analysis was undertaken to examine whether genetic variation in TCF7L2 alters the response to glucagon in the presence of matched insulin concentrations. When glucagon was infused continuously or suppressed for the first 2 hrs, there were no significant differences in glucose concentrations between genotype groups. Because glucose concentrations represent a balance between glucose appearance and disappearance, we utilized tracer methodology to ensure that there were no reciprocal, and offsetting, differences in EGP and glucose disappearance between the genotype groups. Again, the responses of EGP and Rd to matched concentrations of insulin, and glucagon in the presence of an identical glucose challenge, did not differ between groups.
Taken together, these data demonstrate that diabetes-associated genetic variation in TCF7L2 does not alter glucagon and insulin action in nondiabetic humans.
Footnotes
Authors' Contributions
J.D.A. and A.M.E. researched data and ran the studies; M.C.L. undertook mathematical modeling of insulin secretion and action; D.S.W. assisted with data management and organization as well as with the data analysis; K.R.B. supervised the statistical analyses; C.C. and C.D.M. supervised the mathematical modeling, contributed to the discussion, and reviewed/edited the article; A.V. designed the study, oversaw its conduct, researched data, and wrote the first draft of the article. A.V. is the guarantor of this work and, as such, had full access to all the data in the study and takes responsibility for the integrity of the data and the accuracy of the data analysis.
Acknowledgment
The authors acknowledge the support of the Mayo Clinic General Clinical Research Center.
Author Disclosure Statement
A.V. is the recipient of an investigator-initiated grant from Novo Nordisk and has consulted for vTv Therapeutics and Zeeland Pharmaceuticals. None of the other authors declares conflict of interests related to this study.
Funding Information
The authors acknowledge the support of the Mayo Clinic General Clinical Research Center (DK TR000135). A.V. is supported by DK78646, DK116231, and DK126206.