




Abstract
Background:
No study has examined whether serum uric acid/creatinine (sUA/Cr) is associated with the newly defined metabolic-associated fatty liver disease (MAFLDs). Furthermore, studies on other factors influencing their relationship have not been conducted.
Aim:
To investigate the relationship between sUA/Cr and newly defined MAFLD, and to identify any factors that affect this relationship.
Methods:
We retrospectively reviewed the data of patients who underwent abdominal computed tomography (CT) at the Hospital Health Promotion Center. Participants were divided into the healthy (no evidence of liver disease; n = 707), MAFLD+non-heavy drinking (steatosis diagnosed by CT and drinking <140 and 70 grams/week for men and women, respectively; n = 291), and MAFLD+heavy drinking (fatty liver diagnosed by CT and drinking >140 and 70 grams/week for men and women, respectively; n = 61) groups. The relationship between sUA/Cr and MAFLD among the three groups were compared using multivariate logistic regression.
Results:
After adjusting for age, it was observed that when the sUA/Cr ratio increased by 1, the risk of MAFLD increased by 1.205 times the risk in the normal group. After adjusting for age, an increase by 1 in the sUA/Cr ratio increased the probability of non-heavy drinking+MAFLD and heavy drinking+MAFLD by 1.302 and 1.556 times, respectively, compared with healthy individuals. For those who smoked, the probability of heavy drinking+MAFLD was 9.901 times higher compared with healthy individuals.
Conclusion:
The newly defined MAFLD is related to sUA/Cr. The amount of alcohol consumption and smoking influenced the association between sUA/Cr and MAFLD.
Introduction
The prevalence of fatty liver disease has increased with the increase in the proportion of individuals who are overweight or have obesity worldwide. 1 Non-alcoholic fatty liver disease (NAFLD) has now been renamed metabolic-associated fatty liver disease (MAFLD). 1 –3 Previously, NAFLD used to be diagnosed when fatty liver was observed on computed tomography (CT), magnetic resonance imaging, fibro scanning, and ultrasound images or was confirmed by a biopsy. 4,5
Furthermore, when defining NAFLD, obvious alcohol consumption and other secondary liver diseases had to be excluded. 4 –6 Contrastingly, MAFLD, as it was renamed after much expert discussion, is an efficient definition that has considered metabolic dysfunction; the diagnostic criteria were released in 2020. 1 –3,7 The new definition considers the presence or absence of metabolic diseases, such as diabetes, hypertension, and dyslipidemia relevant, and the diagnosis does not consider the amount of alcohol consumed. MAFLD is diagnosed when fatty liver is observed, by the abovementioned methods, in patients with obesity and diabetes or in those who are overweight. 1 –3,7 In patients with a normal weight, MAFLD is diagnosed if two or more metabolic risk factors are present. It has been proven that MAFLD is more accurate in defining metabolic liver disease and reflecting disease progression than conventional NAFLD. 1 –3,7
However, fatty liver can also be caused by alcohol consumption of >210 grams/week for men and >140 grams/week for women, which was previously classified as alcoholic fatty liver disease. 8,9 Fatty liver in the presence of alcohol consumption less than the above amount was classified as NAFLD. 4 –6 Currently, fatty liver is not classified according to the amount of alcohol consumed, as it has been redefined into the concept of MAFLD. However, there has been debate as to whether light and moderate alcohol use affects the prognosis of MAFLD.
Moreover, NAFLD has been associated with elevated blood uric acid (UA) levels 10,11 and decline in renal function. 12 Previous evidence suggests that the serum UA/creatinine (sUA/Cr) ratio is strongly linked to metabolic syndromes and B cell function in type 2 diabetes. 13 Furthermore, sUA/Cr can be a marker of full metabolic syndromes in patients with type 2 diabetes. 14 Based on this evidence, another study demonstrated an association between sUA/Cr and NAFLD. 15 Furthermore, the newly defined MAFLD was found to be associated with chronic kidney disease. 16 Therefore, we designed this study to investigate the relationship between sUA/Cr and the newly defined MAFLD. Additionally, a subgroup analysis was designed comparing the sUA/Cr between a group that consumed alcohol at a high-risk level and a group that did not, as it is unclear whether the prognosis of MAFLD is affected by light or moderate alcohol use.
Materials and Methods
Study population
Medical records from patients >19 years of age who were examined at the University Hospital Health Promotion Center and underwent abdominal CT from March 2013 to November 2018 were retrospectively selected for review. Individuals with incomplete records, acute illness, and positive acute hepatitis-related tests, and those positive for hepatitis B surface antigen or hepatitis C virus antibody were excluded from the study. Additionally, patients with abdominal pelvic CT findings suggestive of cancer were also excluded. As a result, 1059 participants were included in the final analysis. This study followed the ethical standards of the Declaration of Helsinki and was approved by the Institutional Review Board of the Wonkwang University Hospital (IRB approval no. 201609-HR-097). The requirement for obtaining patient consent was waived as this study was conducted by retrospectively reviewing previously recorded information.
Diagnosis of MAFLD and CT scan of the abdominal pelvis
The diagnosis of MAFLD was defined as follows 1 :
Overweight or obesity [defined as body mass index (BMI) ≥23 kg/m2] and fatty liver on CT.
Lean/normal weight (defined as BMI <23 kg/m2) and fatty liver on CT, if there are at least two of the following metabolic risk factors:
Waist circumference ≥102/88 cm in Caucasian men/women (or ≥90/80 cm in Asian men/women).
Blood pressure ≥130/85 mmHg, or specific drug treatment.
Plasma triglyceride (TG) level ≥150 mg/dL (≥1.70 mM), or specific drug treatment.
Plasma high-density lipoprotein cholesterol (HDL-C) level <40 mg/dL (<1.0 mM) for men and <50 mg/dL (<1.3 mM) for women, or specific drug treatment.
Prediabetes [i.e., fasting glucose levels of 100–125 mg/dL (5.6–6.9 mM)], or 2-hr post-load glucose levels of 140–199 mg/dL (7.8–11.0 mmol), or Hemoglobin A1C of 5.7%–6.4% (39–47 mmol/mol).
Homeostasis model assessment of insulin resistance scores ≥2.5.
Plasma high-sensitivity C-reactive protein (hs-CRP) levels >2 mg/L.
Type 2 diabetes mellitus (according to widely accepted international criteria) and fatty liver on CT.
The Somatom Definition Computed Tomography Scanner (Siemens Medical Solutions, Forchheim, Germany) was used for CT scans of the abdomen and pelvis, and images were evaluated by a radiologist. To avoid examiner bias, all of the data were reviewed by one single medical imaging specialist who was blinded to the patients’ characteristics and study aims. Fatty liver was diagnosed when liver attenuation was <40 Hounsfield units (HU) or <10 HU compared with the spleen. 17
Anthropometric measurements and blood pressure
Height and weight were measured using an automatic height scale, and BMI was calculated by dividing the weight by the square root of height (kg/m2). Waist circumference was measured at the midpoint between the lowest rib and the iliac crest in the CT image, according to the World Health Organization recommendations. Blood pressure was measured using an automatic blood pressure monitor after maintaining stable pressure for >10 min; the average of two measurements was recorded.
Blood tests
After fasting for >8 hr, blood was collected from a vein and immediately sent to the Neodine Research Institute where biochemical tests were performed using a Hitachi 7600 automatic analyzer (Hitachi, Tokyo, Japan). Fasting blood sugar (FBS), total cholesterol (TC), TG, HDL-C, low-density lipoprotein cholesterol (LDL-C), alanine aminotransferase (ALT), aspartate aminotransferase (AST), gamma-glutamyl transpeptidase (γ-GT), UA, Cr, and hs-CRP concentrations were measured.
Clinical examination and lifestyle evaluation
Medical experts surveyed the patients’ medical history and lifestyle using a self-questionnaire. Smoking status was classified into smokers and nonsmokers; those who smoked consistently for 2 years were classified as smokers. Participants were divided into heavy and non-heavy drinkers based on an alcohol consumption of more, or <210 grams/week for men and 140 grams/week for women. Physical activity was evaluated using the “International Physical Activity Questionnaire,” and regular exercise was defined as at least 3 times a week, with a duration of at least 20 min per exercise. Blood pressure was measured in a sitting position using an automatic blood pressure monitor (BP-8800C; Colin Electronics Co. Ltd., Aichi, Japan).
Classification of study groups
Patients were classified into three groups as follows: (1) the healthy group, (2) the MAFLD+non-heavy drinking group, and (3) the MAFLD+heavy drinking group. The healthy group comprised individuals who showed a normal liver on abdominal CT, whose AST, ALT, and γ-GT values were normal, and who drank alcohol at a rate of <210 grams/week for men and <140 grams/week for women. 13 The MAFLD+non-heavy drinking group comprised those who were diagnosed with fatty liver disease according to abdominal CT results and drank <210 grams/week for men and <140 grams/week for women, regardless of the liver function test values. 4 The MAFLD+heavy drinking group comprised participants who drank >210 grams/week (for men) and >140 grams/week (for women) and were diagnosed with fatty liver disease according to the abdominal CT results (Fig. 1).
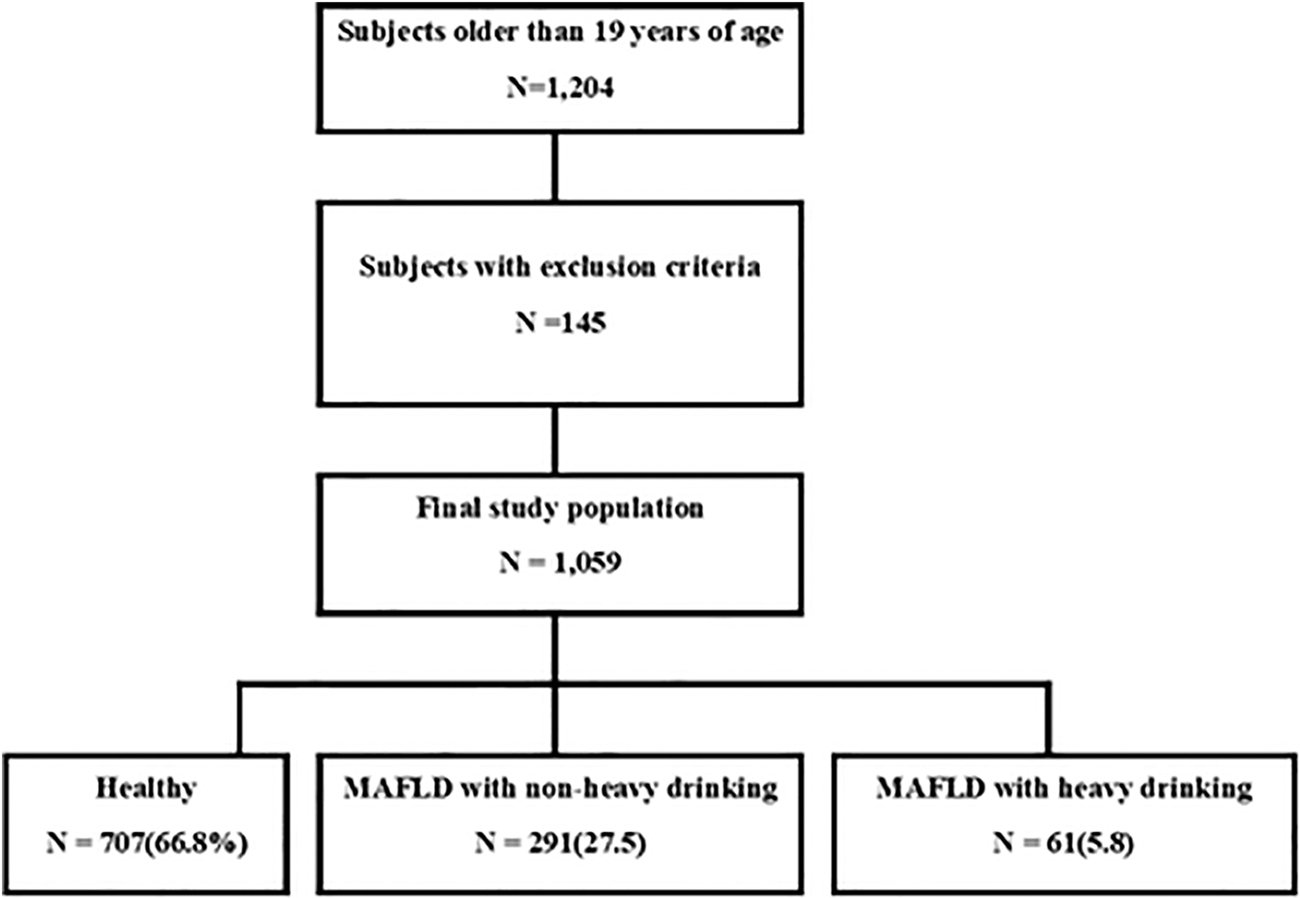
Flow diagram of the patients included in this study. MAFLD, metabolic-associated fatty liver disease.
Statistical analysis
SPSS for Windows (version 26.0; SPSS, Inc., Chicago, IL) was used for statistical analysis. A comparative analysis between noncontinuous variables was performed using the chi-square test. Comparative analysis between continuous variables was performed using a one-way analysis of variance. The Scheffe test was used for post hoc testing of differences among the groups. The analysis of covariance was used to analyze the average difference among the groups for the following factors: BMI, waist circumference, blood pressure, and blood glucose, TC, TG, HDL-C, LDL-C, and hs-CRP, after adjusting for age. The differences among the groups were confirmed using a simple and repeated method of contrast testing. The relationship between each group and sUA/Cr was analyzed using multivariate logistic regression analysis, after adjusting for age. Statistical significance was set at P < 0.05.
Results
General patient characteristics
The total number of participants was distributed as follows: 572 (62.7%) in the healthy group; 295 (32.3%) in the MAFLD+non-heavy drinking group; and 46 (5.0%) in the MAFLD+heavy drinking group. The average age was 52.14 ± 10.10 years in the healthy group, 52.38 ± 9.88 years in the MAFLD+non-heavy drinking group, and 49.70 ± 8.76 years in the MAFLD+heavy drinking group. The number of male participants was 387 (54.7%) in the healthy group, 196 (67.4%) in the MAFLD+non-heavy drinking group, and 61 (100.0%) in the MAFLD+heavy drinking group. The average BMI and waist circumference were lower in the healthy group than in both the nonheavy and heavy drinking groups. Significant differences in AST, ALT, and γ-GT levels were observed among the groups; they were higher in the heavy drinking group than in the healthy and nonheavy drinking groups. ALT levels were higher in the heavy drinking group than in the healthy and nonheavy drinking groups (Table 1).
General Patient Characteristics
Data are presented as n (%) or mean ± SD.
Continuous variables were analyzed using one-way analysis of variance, and a post hoc test was performed using the Scheffe test. Categorical variables were analyzed using the chi-square test.
γ-GT, gamma-glutamyl transferase; ALT, alanine aminotransferase; AST, aspartate aminotransferase; BMI, body mass index; MAFLD, metabolic-associated fatty liver disease; ND, not done; SD, standard deviation.
Comparison of cardiovascular risk factors
Significant differences were found among the groups in terms of average systolic blood pressure, diastolic blood pressure, FBS, TC, TG, HDL-C, LDL-C, and hs-CRP levels. In the comparative analysis between the groups through post hoc tests, no statistically significant differences were found between the heavy drinking and nonheavy drinking groups with respect to systolic blood pressure, diastolic blood pressure, FBS, and TG levels; however, the values from either group were higher than those of the healthy group. TC and hs-CRP levels were higher in the heavy drinking group than in the healthy group, and the HDL-C level was higher in the healthy group than in the nonheavy drinking group (Table 2).
Comparison of Cardiovascular Risk Factors
Data are presented as n (%) or mean ± SD.
The P values were calculated using one-way analysis of variance, and the post hoc test was performed using the Scheffe test.
The P values were calculated using the analysis of covariance after adjusting for age, BMI, smoking quantity per day, and weekly exercise frequency per week.
The P values were calculated using the simple contrast test.
The P values were calculated using the repeated contrast test.
DBP, diastolic blood pressure; HDL-C, high-density lipoprotein cholesterol; hsCRP, high-sensitivity C-reactive protein; LDL-C, low-density lipoprotein cholesterol; SBP, systolic blood pressure; TC, total cholesterol; TG, triglyceride.
Risk factors for MAFLD
After adjusting for age, an increase by 1 in the sUA/Cr ratio, increased the risk of MAFLD by 1.205 times that of the normal group and in smokers; the increased risk of MAFLD was 1.456 times that of the healthy group (Table 3). AST, ALT, and γ-GT levels were also statistically related to MAFLD.
Risk Factors for Metabolic-Associated Fatty Liver Disease
Adjusted for age.
The P values were calculated using the multiple logistic regression test.
CI, confidence interval; Cr, creatinine; OR, odds ratio; sUA/Cr, serum uric acid-to-creatinine ratio; UA, uric acid.
Factors related to nonheavy drinking with MAFLD and heavy drinking with MAFLD groups
After adjusting for age, an increase by one in the sUA/Cr ratio increased the risk of MAFLD (nonheavy drinking with MAFLD) is 1.302 times that of the healthy group. Smoking was not related to the association between sUA/Cr and nonheavy drinking with MAFLD (Table 4).
Factors Related to Metabolic-Associated Fatty Liver Disease with Nonheavy Drinking
Adjusted for age.
The P values were calculated using the multiple logistic regression test.
Additionally, an increase by 1 in the sUA/Cr ratio increased the risk of MAFLD (heavy drinking with MAFLD) by 1.556 times that of the healthy group. In smokers, the probability of heavy drinking with MAFLD was 9.901 times that of the healthy group when the sUA/Cr ratio increased (Table 5).
Factors Related to Metabolic-Associated Fatty Liver Disease with Heavy Drinking
Adjusted for age.
The P values were calculated using the multiple logistic regression test.
Discussion
The recently defined MAFLD has different criteria than the previously existing NAFLD. The new MAFLD definition does not consider a specific amount of alcohol consumed. However, alcohol consumption affects several metabolic diseases. Recently, the concept of MAFLD has emerged because of the increasing number of individuals who are overweight or have obesity, resulting in the need for renaming NAFLD. 1 The newly defined MAFLD better reflects overnutrition, a sedentary lifestyle, and metabolic factors, such as obesity, type 2 diabetes, hypertension, and dyslipidemia. 1,18 Because MAFLD was defined by experts very recently (i.e., in 2020), there is a lack of studies on MAFLD using efficient markers.
Cost-effective markers for predicting disease prevalence and progression are useful for many diseases, of which MAFLD is no exception. sUA levels are associated with several metabolic and nonmetabolic diseases. 11,19,20 Previous studies have evaluated the clinical importance of sUA/Cr as a marker in various metabolic diseases, such as diabetes mellitus, chronic kidney disease, and metabolic syndrome. Additionally, sUA/Cr has also been proposed as a biomarker for assessing disease severity and risk of nonmetabolic diseases, such as chronic obstructive pulmonary disease and Parkinson's disease. 21,22 Furthermore, sUA/Cr has proven to be an excellent predictor of chronic kidney disease in patients with type 2 diabetes, 23 and another study in patients with type 2 diabetes suggested a correlation between sUA/Cr and metabolic syndrome. 24
These studies assumed sUA/Cr as a renal function-normalized sUA, reflecting the net production of UA and predicting renal function. 13,23 The sUA/Cr as a renal function-normalized sUA has been studied to prove the relationship between UA and β cell function 13 ; a clinic-based cohort of Chinese patients with type 2 diabetes showed an independent positive correlation between sUA/Cr and β cell function using the homeostasis model assessment. 25 These previous studies are similar to this study.
In this study, we analyzed whether sUA/Cr had different effects on MAFLD depending on the amount of alcohol consumed. To date, many studies have been conducted to define alcohol-related liver disease on the basis of daily alcohol intake of 30 grams/day for men and 20 grams/day for women. 9,26 –28 It is hypothesized that alcohol consumption below these limits will not cause hepatic steatosis or have a fatal effect on liver disease progression and outcomes in adults.
Some conflicting reports suggest that moderate alcohol consumption is associated with or does not affect the reduction of vascular complications. 29,30 Other studies have shown that modest drinking (less than three drinks per day for men and less than two drinks per day for women) is associated with a reduced prevalence of non-alcoholic steatohepatitis and progressive fibrosis. 31,32 Contrastingly, the effect of alcohol use on liver disease progression is likely to have a dose-dependent response in the presence of metabolic syndrome. 33 Some studies have shown that even low alcohol intake in people with fatty liver increases the risk of disease progression. 13,31,34 Low alcohol use has been linked to advanced liver disease and cancer, and it slows the rate of improvement in steatosis and NASH.
Alcohol is a risk factor for cirrhosis, a complication of liver disease. 13,34 A meta-analysis of 17 studies investigated whether this relationship follows a continuous dose–response pattern or has a threshold, and showed that alcohol consumption had a far greater impact on mortality from cirrhosis than on morbidity. 28 Therefore, it can be said that the amount of alcohol intake affects the progression of liver disease. Although the definition of MAFLD does not specify an amount of alcohol consumption, it can be assumed that it will affect MAFLD in several ways. Our results show that the relationship between sUA/Cr and MAFLD in this study differs depending on the amount of alcohol used. However, in another study, low-to-moderate alcohol use was associated with reduced mortality and cardiovascular disease risk, but only among nonsmokers. 35
Furthermore, a cohort study of Korean adults was conducted to investigate the effect of smoking on NAFLD. 36 The results showed that in a large cohort of young and middle-aged men and women, current smoking, pack-years, and urinary cotinine levels were positively associated with a higher risk of developing NAFLD. Active smoking and BMI have also been reported to have a synergistic effect on NAFLD. 36 Smoking contributes to NAFLD through increased hepatic adipogenesis, increased lipolysis in adipose tissue due to insulin resistance, and reduced channeling of fatty acids to the β-oxidation pathway. 37 Our study also showed that the sUA/Cr ratio in smokers was 9.901 times higher than that in nonsmokers both in the healthy and MAFLD with heavy drinking groups.
Our study has several limitations. First, our findings cannot be generalized, because the patients included in the study were recruited from a single center. Therefore, differences according to the sex, age, and race were not considered. Second, it is difficult to investigate alcohol consumption, smoking habits, and exercise frequency through self-diagnosis questionnaires, as these might be unreliable. Third, NAFLD was determined by CT without histological confirmation of fatty liver. However, CT, a noninvasive and highly accurate test, has recently been considered appropriate for diagnosing fatty liver and MAFLD, which is why it was used in our study. 2,7,38
Conclusions
Our study is the first to examine the relationship between sUA/Cr and the newly defined MAFLD. Although there is no limit on the amount of alcohol consumption included in the definition of MAFLD, we divided MAFLD into nonheavy drinking and heavy drinking groups based on the patients’ amount of alcohol consumption. Accordingly, the sUA/Cr ratio had a positive correlation with MAFLD compared with the healthy group; as the sUA/Cr ratio increased by 1, the odds were 1.556 times higher in the MAFLD+heavy drinking group than in the healthy group, and 9.901 times higher in smokers than in nonsmokers. Both alcohol consumption and smoking influenced the relationship between sUA/Cr and MAFLD. In the future, it will be necessary to retrospectively review several factors that affect MAFLD collected across multiple centers.
Footnotes
Acknowledgment
The authors would like to thank Editage for English language editing.
Authors' Contributions
A.L.H. designed and conducted the research; A.L.H. analyzed data; H.K.L. wrote the article; and A.L.H. had primary responsibility for the final content. All authors have read and approved the final article.
Author Disclosure Statement
No conflicting financial interests exist.
Funding Information
This research was funded by the Wonkwang University (2022).