




Abstract
Background:
Patients with metabolic syndrome components were frequently noted to have increased nasal and parotid activity on clinically referred scintigraphic whole-body blood pool scans. This increase in activity was not observed in patients without metabolic syndrome. Increased nasal blood pool activity in patients with elevated body mass indices (BMIs) has implications for (1) sleep apnea, (2) risk of nasal infection, and (3) possible impaired nasal lymphatic drainage of brain waste proteins.
Methods:
To follow-up this clinical observation, a retrospective study was performed on 200 patients having whole-body blood pool scans referred over a 3-year period. The whole-body blood pool scans were evaluated for an association between nose and parotid region of interest (ROI) to heart ROI maximum (max) pixel ratios as correlated with clinical conditions, including obesity, diabetes, hypertension, and sleep apnea. Continuous variables of BMI, hemoglobin A1c (HbA1c), blood glucose, and blood lipids were also correlated with these ratios.
Results:
A direct association of nose to heart max ratio (NHMR) with diabetes, sleep apnea, and hypertension was found with an increase in the ratio of +0.10 (P = 0.002), +0.13 (P = 0.0002), +0.08 (P = 0.0123), respectively. Correlation of NHMR with continuous variables had moderate correlation with BMI (r = 0.36, P < 0.0001), glucose (r = 0.27, P = 0.0001), HbA1c (r = 0.25, P = 0.0008) and less association with the number of diabetes medications (r = 0.22, P = 0.0021). Similar associations were found for parotid to heart max ratios but were weaker than the NHMR.
Conclusions:
Patients with metabolic syndrome components have significantly increased nasal and parotid activity on blood pool scans. These associations have implications for the treatment of sleep apnea, for nasal infections involving such agents as Covid-19, and for the risk of dementias related to decreased clearance of brain waste proteins through nasal turbinate lymphatics in patients with metabolic syndrome. If further studies support these findings, the nasal turbinates and the increased parasympathetic activity controlling their dilation could become a new therapeutic target.
Introduction
A
In our nuclear medicine clinic, we observed a unique finding in patients with metabolic syndrome components [with or without elevated body mass indices (BMIs)] who had been referred for a whole-body scan. These patients were frequently noted to have significantly increased blood pool activity in the nasal turbinate and parotid gland regions. In contrast, patients with minimal nasal and parotid blood pool activity generally had normal BMIs and diagnoses other than metabolic syndrome.
The possibility that patients with metabolic syndrome have increased nasal blood pool activity, likely due to nasal turbinate vasodilation, could have important implications for the diagnosis and possible treatment of a variety of medical conditions such as sleep apnea, nasal infections, and other medical conditions affecting the nasal turbinates. 1 –5 Increased nasal turbinate vasodilation might also interfere with the clearance of brain waste proteins, which traverse from the cerebral spinal fluid (CSF) through nasal turbinate lymphatics. 6 This nasal turbinate lymphatic pathway has been hypothesized to be involved in the development of Alzheimer's disease, 7 and many studies have shown an association between metabolic syndrome and Alzheimer's disease. 8,9 Vascularity of the nasal turbinates and the parotid gland is under the control of the autonomic nervous system with either increased parasympathetic activity or decreased sympathetic activity causing nasal turbinate vasodilation. 10
The objective of this study was to quantitatively determine if the clinically observed high nose and parotid blood pool activity on whole-body blood pool imaging in patients with a high BMI and other components of metabolic syndrome could be verified in a large-scale retrospective study using quantitative region of interest (ROI) analysis.
Following an extensive search of the literature, the authors believe that this is the first documented observation of the association of increased nasal and parotid blood pool activity in patients with metabolic syndrome.
Materials and Methods
To further investigate our observation, we performed a large-scale retrospective review of 200 patients referred for whole-body blood pool imaging from the rheumatology clinic to find out if increased nasal and parotid blood volume correlated with metabolic syndrome components. In these referred patients, whole-body blood pool imaging was performed to detect sites of inflammation as the first part of a standard whole-body bone scan performed 3 hr postinjection. 11 Although whole-body blood pool scanning is not routinely performed in all imaging clinics, it has been shown to be useful in the detection of sites of soft tissue inflammation. 12
The following clinical information was collected on each patient: prior diagnosis of diabetes, impaired glucose tolerance, hypertension, sleep apnea, hyperlipidemia, and the number of medications for diabetes. The following continuous variables were recorded for each patient: BMI, an average of two recent fasting glucose values, two recent blood pressures, hemoglobin A1c (HbA1c), triglycerides, high-density lipoproteins (HDL), low-density lipoproteins (LDL), and total cholesterol. The 200 patients were representative of the city of San Antonio's population with >50% having Hispanic surnames.
The patients referred from the rheumatology clinic were retrospectively evaluated for an association between nose and parotid maximum (max) pixel activity and total regional activity ratios compared to heart max pixel and total region activity. The images were statistically correlated with clinical conditions, including diabetes, obesity, hypertension, and sleep apnea. BMI, HbA1c, blood glucose, and blood lipids were also correlated with these whole-body blood pool image ratios. Other continuous variables were also correlated with the number of antihypertensive medications, number of antidiabetic medications, and number of antilipidemic medications. The ROI ratios comparing nose/heart and parotid/heart ratios provided a quantitative index of relative blood volumes in the nose and parotid region compared to each patient's heart blood volume.
Quantitative assessment of nasal and parotid blood pool was performed by comparative ROI analysis of blood pool images in relationship to components of metabolic syndrome, including BMI, the diagnosis of diabetes, hypertension, hyperlipidemia, and sleep apnea. We also retrospectively looked at laboratory values, including HbA1c, serum lipids, and blood glucose.
ROI analysis of these previously obtained clinical whole-body blood images was performed by drawing ROIs over the nasal turbinate region and the parotid region and by comparing the nasal activity to the heart blood pool region as shown in Fig. 1. As a second standard of activity, a ROI was also drawn over the left anterior mid thigh. The maximum pixel counts for the nose, parotid, heart, and thigh were recorded in each region with the highest number of counts. The Total counts were the sum of all counts in the corresponding regions. For each individual, ratios of the Total and Maximum counts for these regions were calculated for nose/heart, parotid/heart, nose/thigh, and parotid/thigh. Table 1 uses counts and percentages for qualitative variables and medians and interquartile ranges for quantitative variables.
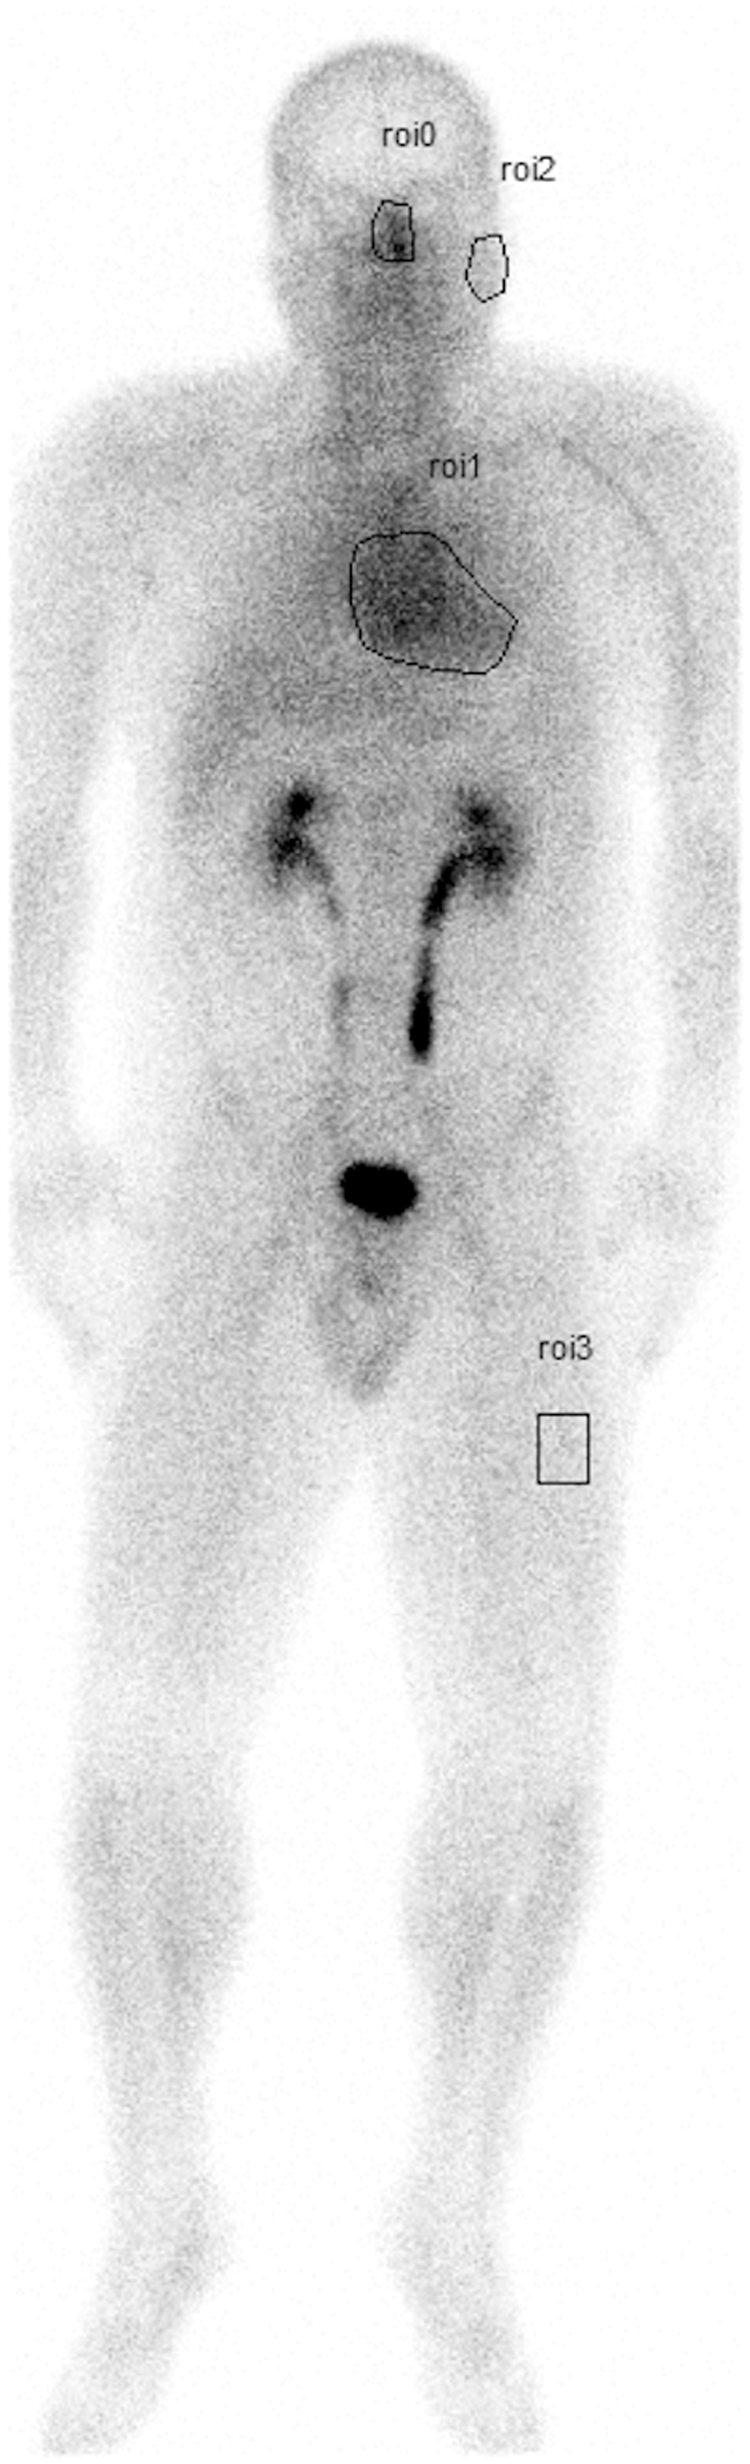
ROIs example image: This image demonstrates how the four ROIs were drawn around the nose, parotid, heart, and thigh. Based on these ROIs, the total counts of each region were quantitatively determined, as well as the counts in the pixel within the region with the most counts which is designated as the max pixel. The ratios between the nose region counts and the heart region counts can be compared. In this patient, total counts in the heart are 71,656, max heart pixel count is 58; total counts in the nose are 8709, max pixel of the nose is 55; total counts in the parotid are 3697, max pixel of the parotid is 26, and total counts in the thigh are 5292, the thigh max pixel is 20. The nose/heart max ratio is 0.95. The nose/heart total region count ratio is 0.12. max, maximum; ROIs, regions of interest.
Clinical Characteristics and Medication
(1+) = 1 or more medications.
Statistics presented: n (%); median (IQR).
BMI, body mass index; IQR, interquartile range; max, maximum.
The study was approved by the Institutional Review Board for a retrospective review (No. HSC20200389E). No patient identification appeared in the article; therefore, patient consent was not required. The review took place from May 1, 2017 to May 1, 2020 with patients <18 years of age and >80 years of age excluded. The rheumatology patients all had whole-body blood pool imaging acquired as part of their assessment of joint and other musculoskeletal-related inflammation.
Imaging acquisition and analysis methodology
All patients were injected with 20–25 mCi of 99mTc-MDP, and whole-body blood pool images were obtained beginning at 2–3 min and taking 6–7 min to scan from head to feet after injection of the bone avid radiopharmaceutical. This early imaging of the bone avid radiopharmaceutical within the first 10 min after injection is considered to be a marker of the patient blood pool as the bone avid radiopharmaceutical requires 3 hr for bone deposition and clearance of activity from the soft tissues. Images were obtained with a dual-headed gamma camera (GE Infinia Hawkeye 4, Boston, MA) using low energy, high-resolution collimators with an energy window set at 140 keV and with a 20% window moving at a rate of 36 cm/min. 12,13 Total time for whole-body blood pool image acquisition was ∼6 min.
The maximum pixel counts were recorded from the pixels in each region with the highest number of counts. The nose/heart maximum ratios were tested for association with continuous variables like BMI using Pearson correlation. The nose to heart max ratio was tested for association with sleep apnea, hypertension, and diabetes using the Wilcoxon rank-sum test. All testing was two sided with a significance level of 0.05. The statistical software used for the analysis was R (Version 4.0, Vienna, Austria).
Similar max pixel ratios were performed for the parotid gland. In addition, ratio comparisons were also performed for the total number of counts in each region to obtain the nose/heart total count ratios and parotid/heart total region count ratios. Using this same methodology above, nose/thigh and parotid/thigh max pixel and total region count ratios were correlated.
Results
There were 200 subjects in the samples with a median BMI of 32, and 88% were female. There was no selection bias other than the fact that more women presented to the rheumatology clinic compared to men (the prevalence of rheumatoid arthritis in women to men is 3:1), and these patients were referred for whole-body nuclear medicine scans. The images were viewed in order of their referral from the clinic. In this population, there were substantial frequencies of diabetes (28%), hypertension (53%), hyperlipidemia (46%), and sleep apnea (26%) as shown in Table 1. The percentage of patients on medications for diabetes, hypertension, and hyperlipidemia and the number of medications for each are shown in Table 1.
The average systolic blood pressure in our patient population was 125 mmHg (115–135), with a diastolic pressure of 72 mmHg (65–80). The authors surmise that the normal blood pressures were due to the antihypertensive medications taken by the patients. In our study, 53% of the patients were hypertensive, and 47% of the patients were taking antihypertensive medication (Table 1). The presence of hypertension was statistically significant with regard to an elevated nose to heart max ratio (Table 2).
Average Values of Nose to Heart Max Ratio for Different Clinical Characteristics
Values are represented as mean (standard deviation). P values depict the Wilcoxon test.
Statistically significant.
The Pearson correlation of nose to heart max ratio (NHMR) with continuous variables had moderate correlation with BMI (r = 0.36, P < 0.0001), glucose (r = 0.27, P = 0.0001), and HbA1c (r = 0.25, P = 0.0008) and less association with the number of diabetic medications (r = 0.22, P = 0.0021). There was no significant correlation with the number of antihyperlipidemic medications taken (r = 0.10, P = 0.1749) as shown in Table 3. The association between BMI and nose to heart max ratio is shown in scatterplots in Fig. 2D in patients with and without diabetes. Similar significant associations were found for total nose count/total heart count ratios (not shown).
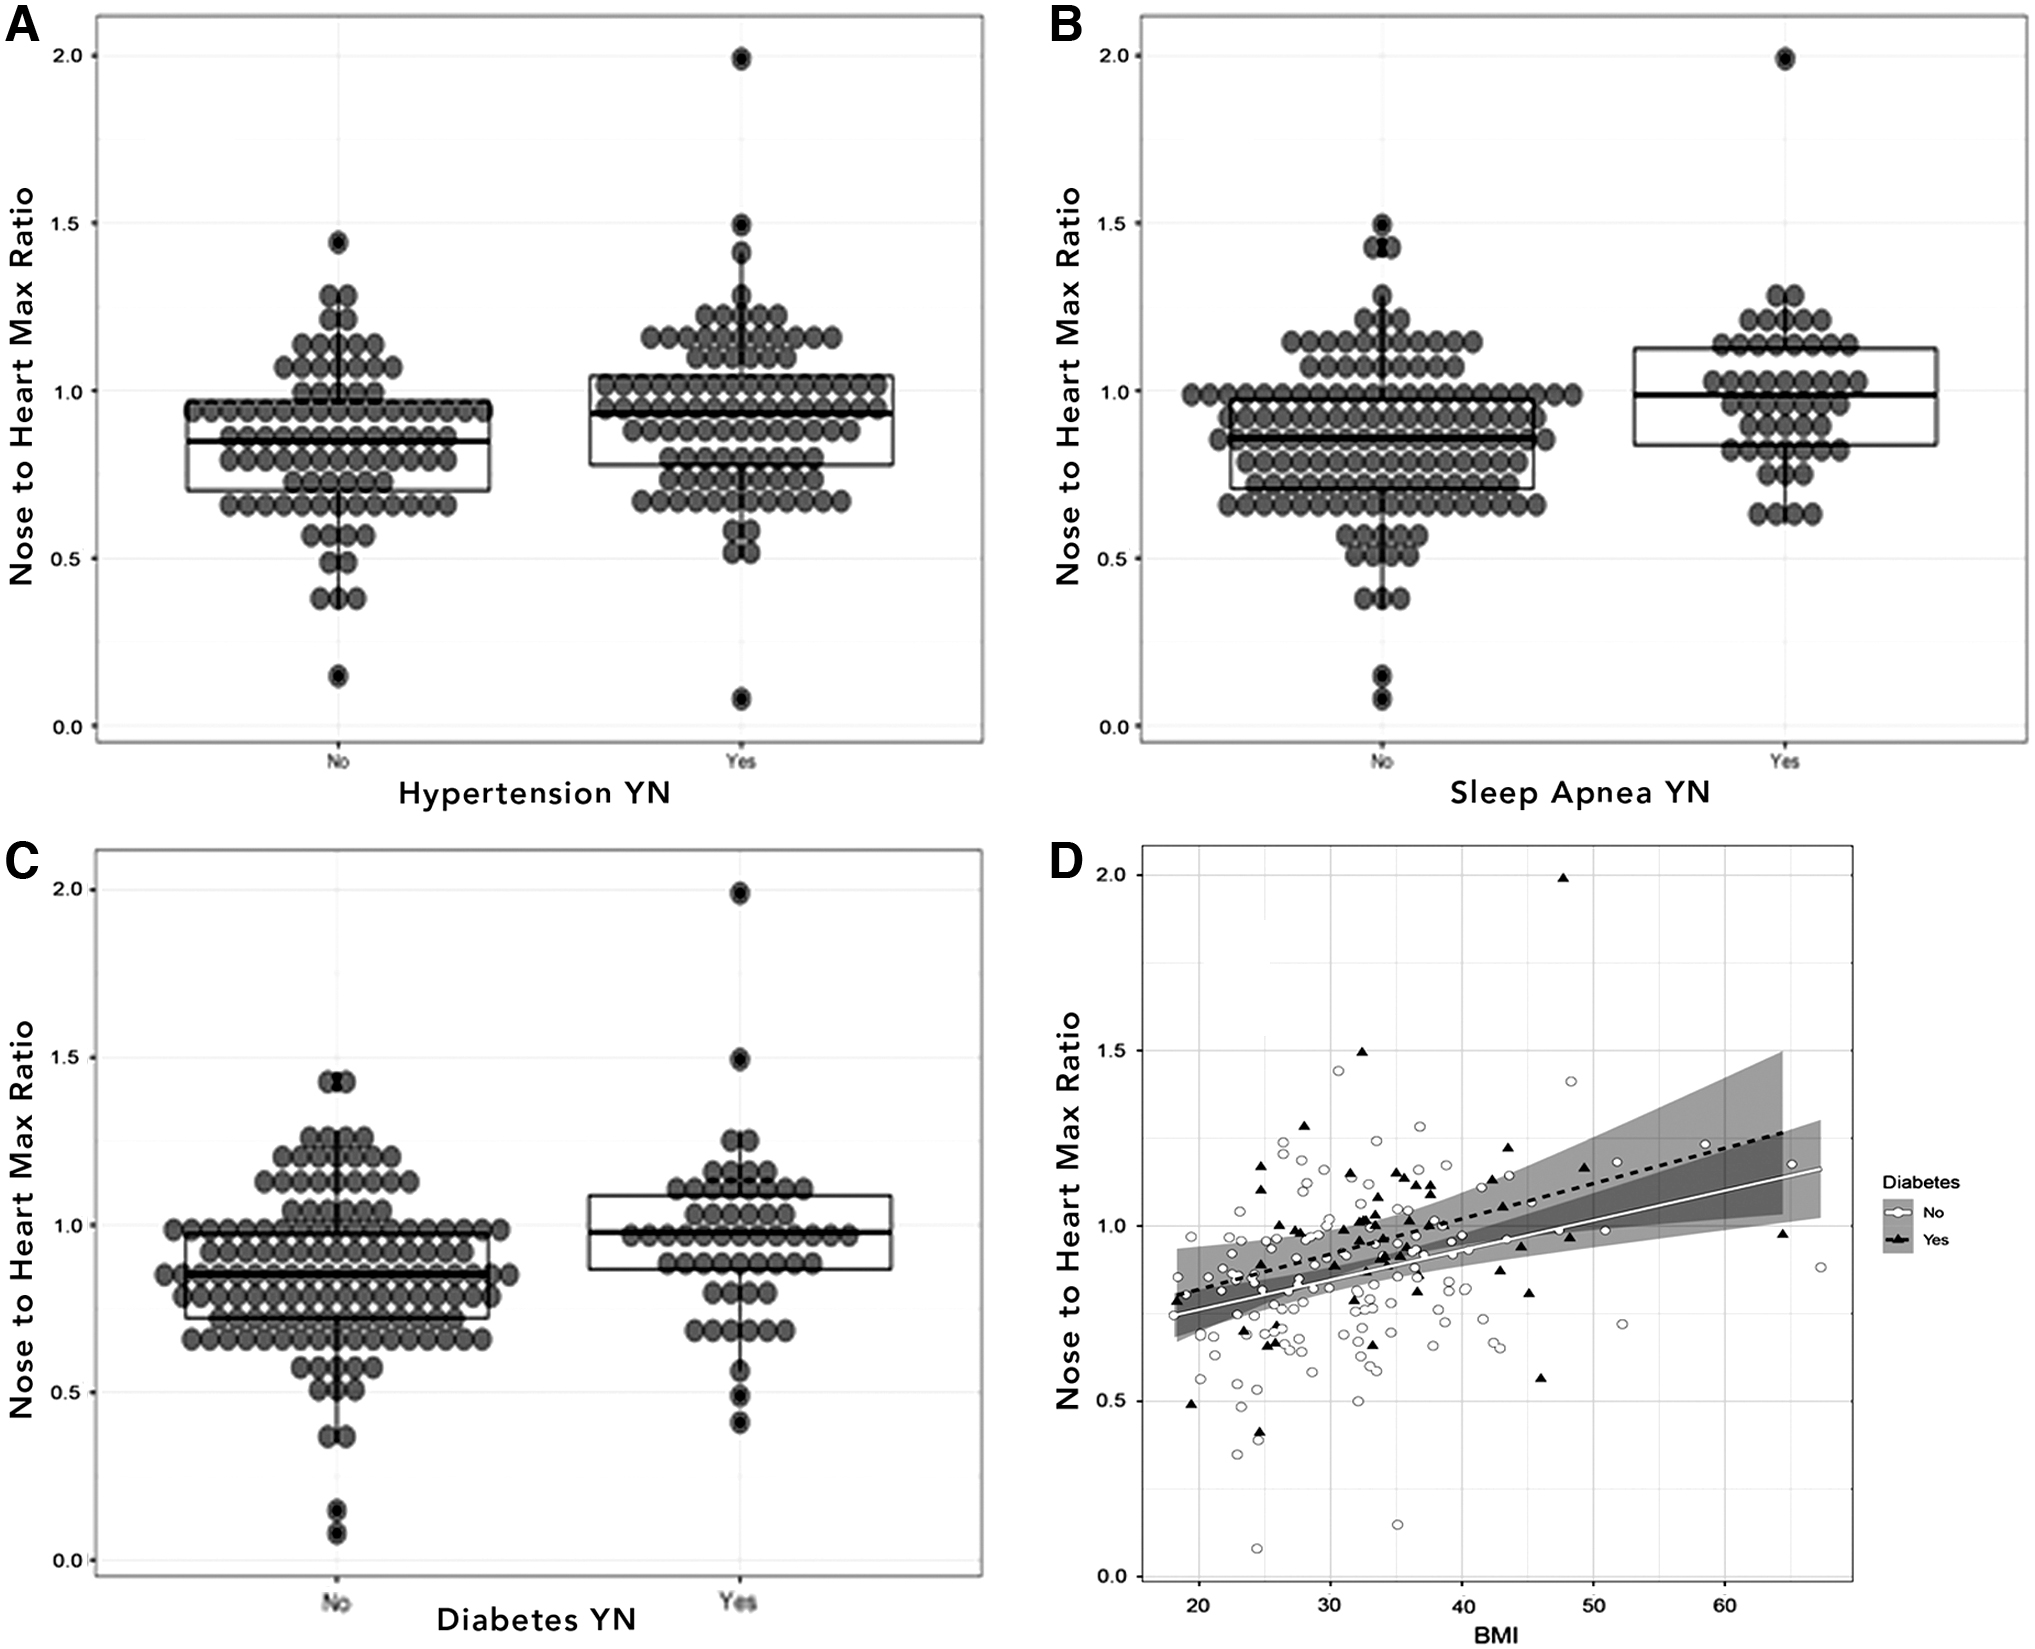
Dot plots of nose to heart max ratios in patient population.
Pearson Correlations Between Continuous Variables and Nose to Heart Max Ratios
Statistically significant.
CI, confidence interval.
The Pearson correlation of parotid total count/heart total count ratios shown in Table 3 had more associations than parotid max/heart max ratios, but still weaker associations than all nose ratios. The parotid/heart total ratio was significantly correlated with BMI (r = 0.38, P = < 0.0001) and the number of antihypertensive medications (r = 0.24, P = 0.0009). Like the nose/heart total and max ratios, the parotid/heart total ratio was significantly associated with clinical conditions (diabetes P = 0.03, sleep apnea P = 0.01, and hypertension P = 0.005 by Wilcoxon tests). The analysis of covariance of parotid to heart total ratio regressed onto clinical conditions, and BMI showed some significant relationships (sleep apnea P = 0.05, BMI P = 0.005), but still fewer associations with independent predictors than nose/heart max and nose/heart total ratios.
The direct association of NHMR with clinical conditions was first examined separately. While gender and hyperlipidemia were not associated with nose/heart max ratios, diabetes (mean with diabetes 0.96 vs. 0.86, +0.10 difference, Wilcoxon test, P = 0.002), sleep apnea (mean with apnea 0.99 vs. 0.86, +0.13 difference, Wilcoxon test, P = 0.0002), and hypertension (mean with hypertension 0.93 vs. 0.85, +0.8, Wilcoxon test, P = 0.0123) were all associated with an increase in ratio as shown in Table 2. These associations are visualized in Fig. 2A–C.
The conditions that were individually associated with NHMR were entered into a linear regression. The interpretation of the regression indicates that a person without diabetes, sleep apnea, hypertension, hyperlipidemia, or BMI >25 kg/m2 has an expected nose/heart max ratio of 0.72. The clinically metabolic-related conditions that increased the ratio were: diabetes (regression coefficient, Beta +0.07, P = 0.05), sleep apnea (Beta +0.09, P = 0.015), and BMI >25 (Beta +0.15, P < 0.001). All were statistically significant as shown in Table 4. Based on this linear regression, an individual patient who has two metabolic syndrome-related conditions of diabetes (Beta +0.07) and BMI >25 (Beta +0.15) would be expected to have a nose/heart max ratio of 0.94 = 0.72 + 0.07 + 0.15, while an individual having three metabolic syndrome-related conditions of diabetes, BMI >25, and sleep apnea would be expected to have a nose/heart max ratio of 1.03 = 0.94 + 0.9.
Linear Model with Sleep Apnea, Diabetes, Hyperlipidemia, Hypertension, and Body Mass Index
Statistically significant.
Similar significant associations were found for total nose/total heart ratios (not shown). No significant associations were found for nose/thigh and parotid/thigh ratios.
Examples of typical patients without and with metabolic syndrome are shown in Fig. 3A and B. Atypical images of a patient with increased BMI without metabolic syndrome versus a normal weight patient with metabolic syndrome are shown in Fig. 4A and B. Figure 5A and B illustrates a patient with metabolic syndrome before and after significant weight loss. The patient shows statistically decreased nasal and parotid activity following weight loss. Figure 5C illustrates the various regions drawn and analyzed, and Fig. 5D shows a computed tomography (CT) image of this patient's head with arrows showing enlarged turbinates.
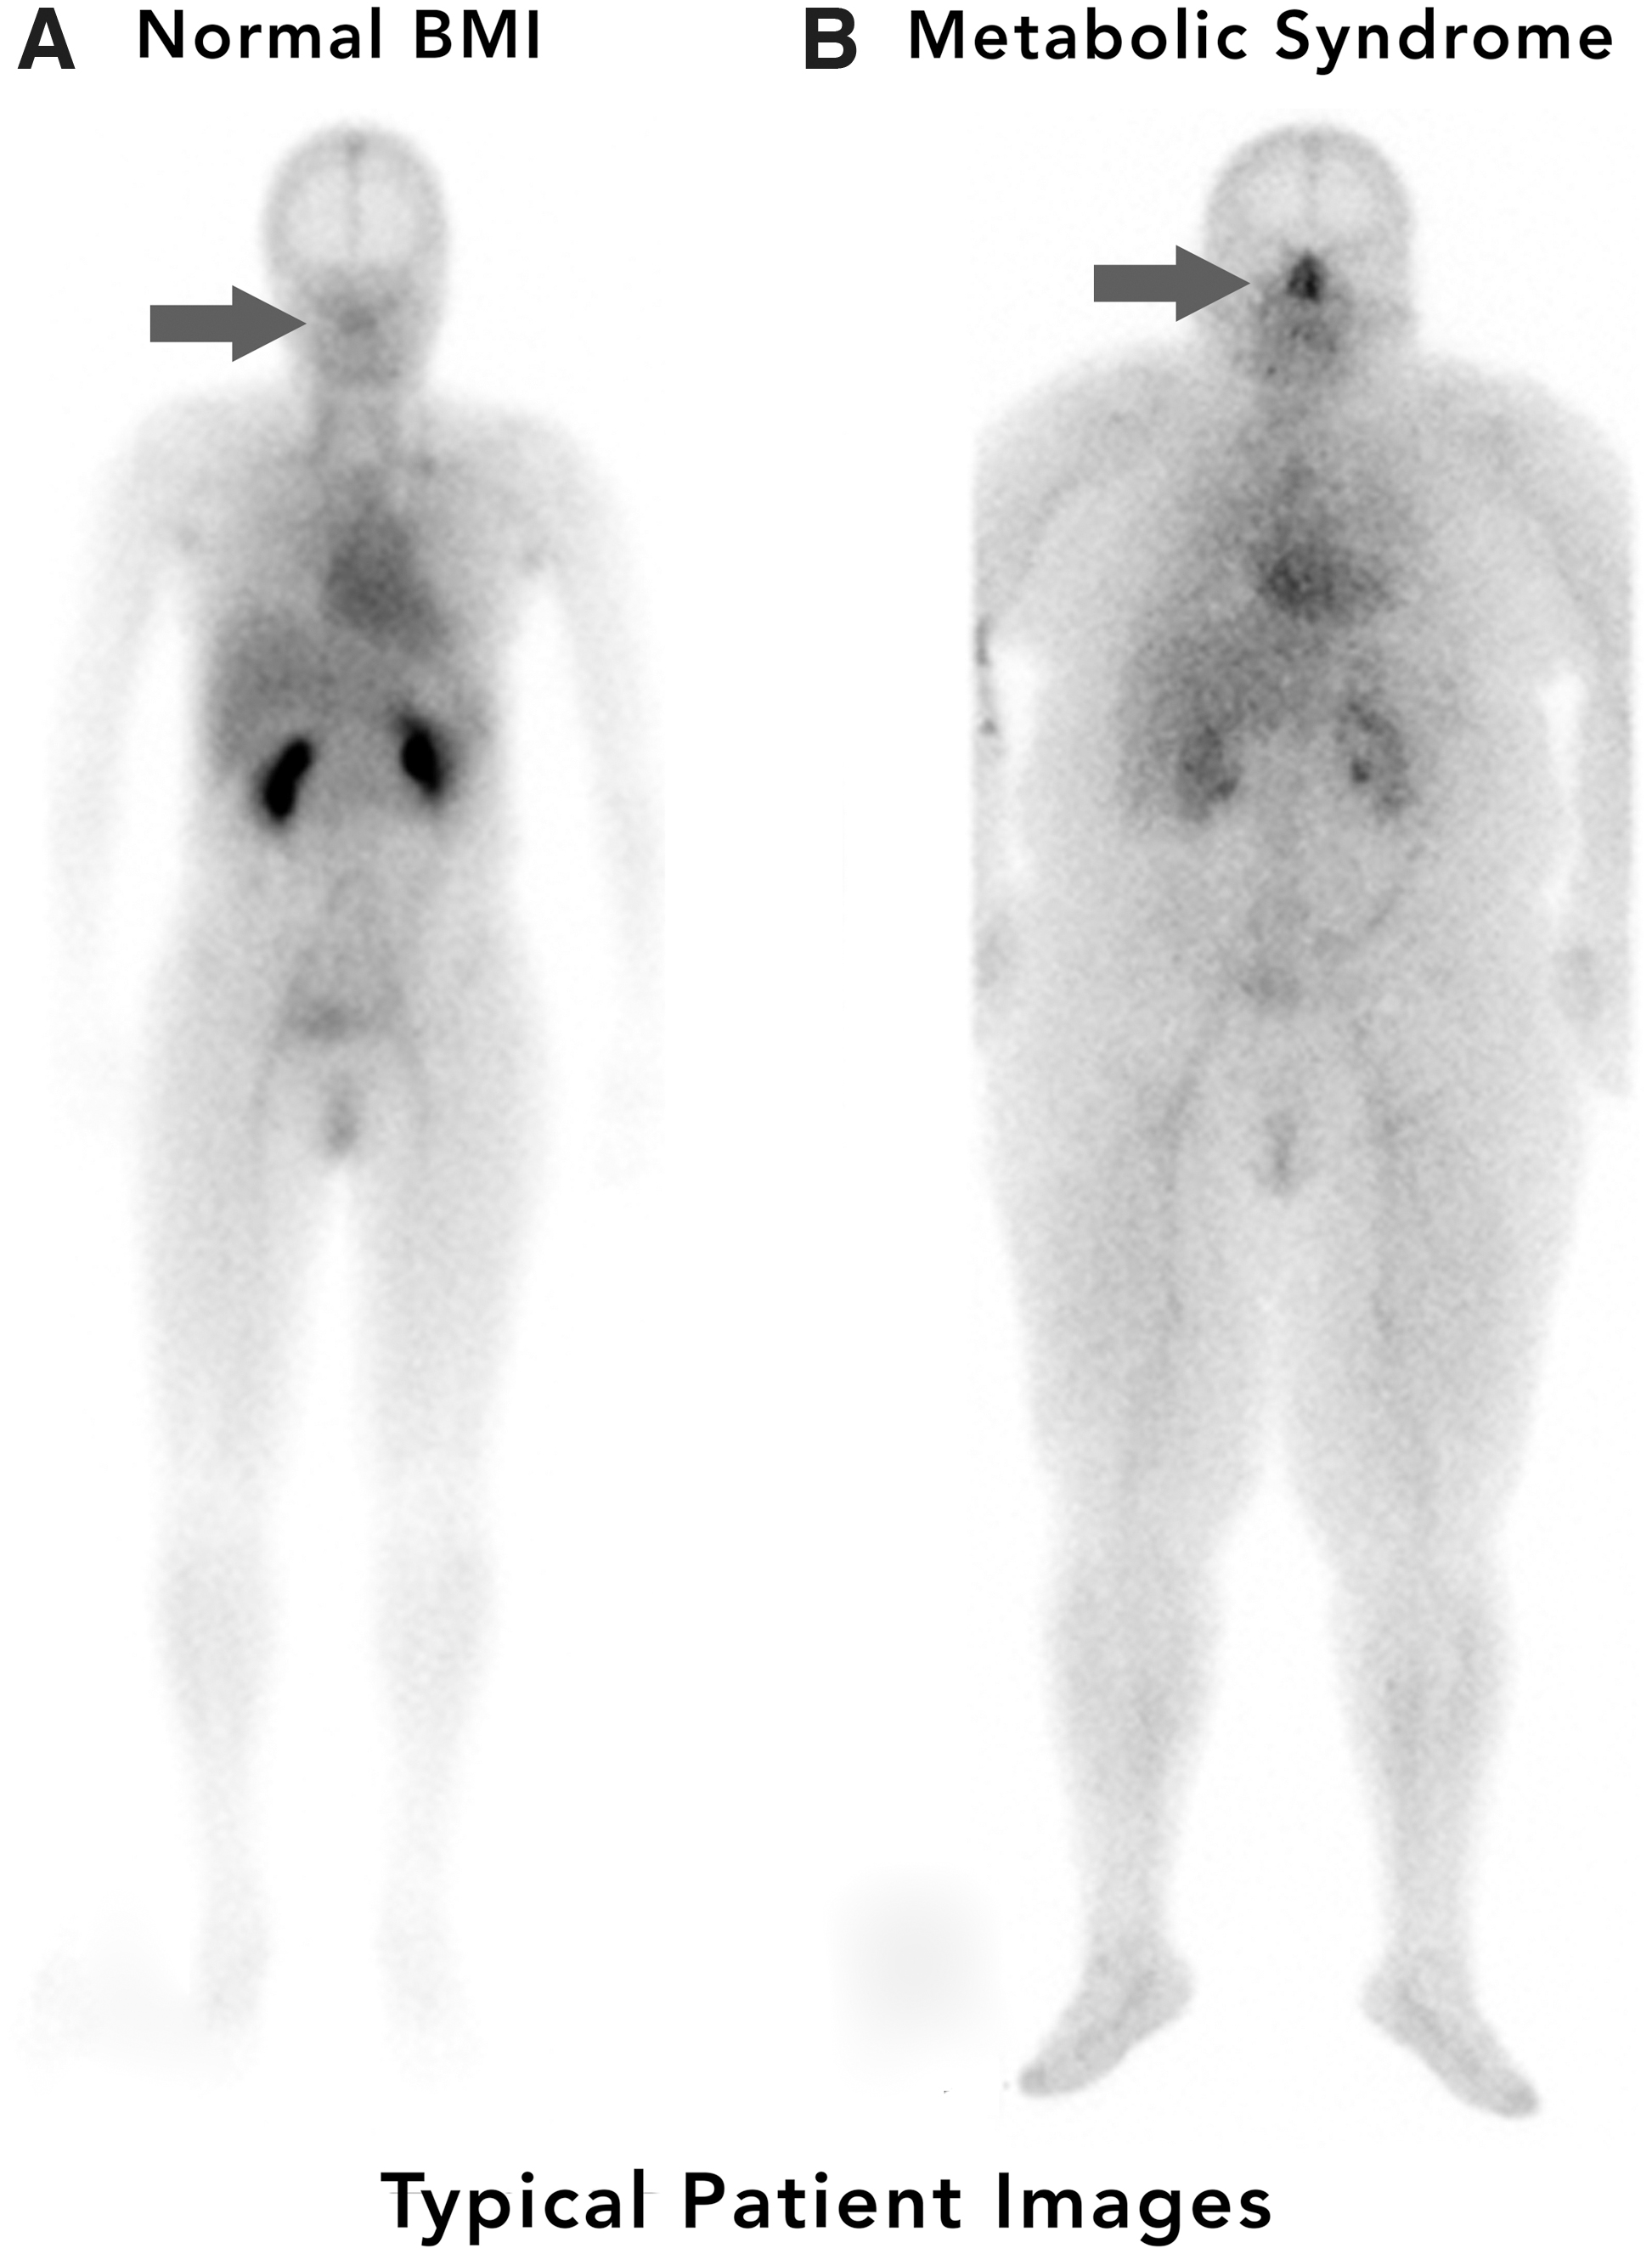
Typical images.

Atypical images.

Male patient with metabolic syndrome before and after weight loss.
Discussion
Metabolic syndrome is now considered a global epidemic. 14 The components of metabolic syndrome include abdominal obesity, insulin resistance, diabetes, hypertension, and dyslipidemia. 14 In our retrospective review of 200 patients, patients with metabolic syndrome components had significantly higher nasal blood/heart ratios than those patients without metabolic syndrome components. BMI, sleep apnea, diabetes, and hypertension were all positively correlated with nose/heart ratios as were the number of patients' antihypertensive and antihyperglycemic drugs. Although the blood pool phase of a bone scan is not a true representation of actual blood volume, when it is obtained during the early phase of a bone scan, it does provide a good marker of the increased vascularity of a region. This early phase blood pool imaging is commonly used to assess patients with possible osteomyelitis. 11
Although the findings in this study are preliminary from a retrospective analysis, these findings do provide support for a future prospective study of a more balanced population of normal metabolic and metabolic syndrome patients. These studies could be performed with a true blood pool marker such as tagged 99m-Tc-radiolabeled red blood cells. If these findings are confirmed in future prospective studies, the nasal turbinates could be a novel target for the treatment of nasal turbinate-associated diseases, including sleep apnea, nasal infections, and diseases that may be associated with impaired CSF drainage of waste products through the nasal lymphatics.
In our current study, both nasal/heart and parotid/heart blood pool ratios were positively correlated with components of metabolic syndrome. Both nasal turbinate and parotid gland vasodilation are under autonomic control with increased parasympathetic activity causing vasodilation and increased sympathetic activity causing vasoconstriction. 10 This raises the possibility that subjects with metabolic syndrome may have upregulation of parasympathetic activity affecting more than one organ system causing nasal turbinate and parotid vasodilation. Prior studies have shown that patients with metabolic syndrome components, including type 2 diabetes, 15 –20 elevated BMI, 16 and hypertension, 17 have significantly increased rates of gastric emptying which is also consistent with upregulated parasympathetic activity. 21,22
The possibility of increased parasympathetic upregulation of nasal turbinates, parotid glands, and gastrointestinal motility contrasts with well-known previously described upregulation of sympathetic activity in essential hypertension. 23 Increased sympathetic upregulation has also been previously described in patients with obstructive sleep apnea, 24 which is the condition with the highest direct correlation with nasal blood pool volume in our retrospective study (Table 2 and Fig. 2B). Increased sympathetic muscle activity in sleep apnea patients is strongly associated with resistant hypertension with several studies reporting that up to 80% of patients with resistant hypertension have sleep apnea. 25 The co-occurrence of parasympathetic upregulation of some organ systems while other organ systems simultaneously have sympathetic upregulation has been previously hypothesized by one of the authors. 26
Based on the linear regression model in this study, a patient with diabetes, sleep apnea, and BMI >25 would have significantly increased nasal activity on these blood pool scans. Although the normal blood volume in the nasal turbinate region has, to our knowledge, never been precisely quantitated, the total nose/heart ratios in our study suggest that this nasal turbinate blood volume is normally about 5%–10% of total cardiac blood volume (400 mL) or ∼20–40 mL. In patients with BMIs >25 and multiple metabolic syndrome components, however, our extrapolated data suggest a nasal turbinate blood volume of >20% of cardiac volume or >80 mL.
This increased blood volume in the constrained space of the nasopharyngeal region could significantly contribute to the increased nasal airflow resistance observed in patients with sleep apnea. 27 Although the precise cause of sleep apnea is unknown, nasal valve airflow resistance is considered to be an important factor in the etiology of sleep apnea. 1,27 Haight and Cole found that erectile tissue in the anterior portion of the inferior turbinate could increase in diameter by as much as 5 mm with nasal mucosal congestion being associated with increased nasal airflow resistance. 28 Although nasal turbinate measurements have not been frequently studied, Rodrigues et al., did find that obesity in sleep apnea patients is associated with an increased inferior turbinate hypertrophy as determined by CT volumetric measurements. 29
The possibility of increased nasal turbinate vasodilation in metabolic syndrome patients could also have implications regarding susceptibility for upper respiratory infection. This possibility is particularly relevant during the current Covid-19 pandemic as sleep apnea and obesity are significant risk factors for developing severe Covid-19. 30 –33 In addition, the nasal turbinates are generally recognized as the first site of Covid-19 infection, most likely related to the highest concentration of Covid-19 virus binding angiotensin-converting enzyme 2 (ACE2) receptors, located in the nasal turbinates. 3 High initial viral loads in the nasopharynx have been correlated with the ultimate severity of Covid-19 infection and risk of death. 34 Abnormally dilated nasal turbinates in patients with metabolic syndrome may also bear some relationship to the loss of smell, commonly observed in patients with Covid-19 infection, sleep apnea, and dementia. 4,35 –38
The importance of the nasal lymphatic pathway in the clearance of CSF has become recognized over the last 20 years. Previously, the commonly accepted understanding was that CSF is primarily cleared by the arachnoid villi. 39 Many experimental studies over the last 20 years have challenged this assumption. 6,40,41 While there is little experimental evidence supporting the arachnoid villi CSF clearance route, many studies in animal models have shown a prominent role for CSF clearance through the cribriform plate into the nasal turbinates. 6,40,41 In experimental models, complete obstruction of CSF movement through the cribriform plate into the nasal mucosa resulted in the development of increased intracranial pressure and hydrocephalus. 40,41
Although an understanding of the importance of CSF lymphatic drainage through the cribriform plate is incomplete, impairment of CSF flow through the nasal lymphatic pathway, secondary to nasal turbinate vasodilation, could result in accumulation of waste proteins in the brain. 6 Recent imaging-based evidence in humans provides support for the importance of nasal lymphatic drainage in humans. Using a dynamic positron emission tomography (PET) imaging study of a radiotracer for tau pathology to study cerebrospinal fluid clearance, de Leon et al. concluded that the human nasal turbinate is part of the CSF clearance system. 42 In another recent PET imaging study, Alzheimer's patients showed decreased accumulation of an amyloid imaging radiotracer in the nasal turbinate region, which was consistent with these patients having reduced CSF clearance through the nasal lymphatic pathways. 7 These findings could also explain the recent reports that sleep apnea, which in this study is associated with increased nasal blood pool activity, is now considered a significant risk factor for the subsequent development of dementia. 43,44
Limitations of this study include the fact that it is a retrospective study of patients referred to our radiology department with suspected rheumatological conditions. This study also has a much higher percentage of female patients than male patients. Certainly, a follow-up prospective study would be indicated in a more balanced population, including a greater number of young metabolically normal subjects, as well as subjects with metabolic syndrome. This study also has limitations related to the performance of image analysis. The drawing of the ROI around the nasal and parotid regions does introduce some variability and potential subjectivity as the number of pixels in the region size varies between patients; however, in our study for statistical analysis, we focused on the maximum pixel activity which does not vary between different region sizes.
The use of the maximum pixel counts is similar to how the MaxSUV is used in PET imaging of tumor metabolism to reduce interobserver variability due to different region sizes. Another image-related limitation is the possibility that there could be attenuation-related differences between patients with high BMIs who are likely to have metabolic syndrome components versus patients of normal BMIs who are more likely to be metabolically normal. Although this limitation has been considered, it doesn't explain the clear visual differences noted in the images of the head which should have minimal or no attenuation differences based on BMI. As shown in Fig. 4, some patients with elevated BMIs, without metabolic syndrome, have low nose to heart ratios, while other patients with normal BMIs and metabolic syndrome have high nose/heart ratios. This would suggest that differences in body attenuation are not an explanation for the findings in this study.
A strength of this study is that quantitative data could be derived permitting statistical analysis of the relative ratios of nasal and parotid activity in a large number of patients. Another strength of this study is that whole-body nuclear imaging allows clear visualization of nasal blood pool activity as related to other organ systems such as the heart. This type of whole-body ratio imaging is a strength of the nuclear imaging technique that is not possible with other imaging modalities such as CT or magnetic resonance imaging (MRI). In the few patients in this study who did have CT or MRI images of the head, it was possible to see nasal turbinate thickening in patients with metabolic syndrome raising the possibility that in future studies, it may be possible to do volume-based measurements of nasal turbinate volume on CT or MRI images and perform a comparison between metabolic syndrome patients and normal subjects.
Components of metabolic syndrome such as obesity are risk factors for sleep apnea, diabetes, infection, and dementia. 29,31,33,45 –47 If the findings in the study are substantiated, whole-body blood pool imaging could help to categorize patients at most risk of developing the medical conditions discussed above based on their nose/heart ratios.
Conclusions
Patients with metabolic syndrome components have significantly increased nasal and parotid activity on whole-body blood pool scans likely related to increased nasal turbinate blood volumes. These associations could have important implications for treatment of sleep apnea, risk of nasal infections, such as severe Covid-19 in patients with metabolic syndrome, and risk of dementia-related illness due to decreased clearance of brain waste proteins through nasal turbinate lymphatics. The increased nasal blood and parotid blood volumes are consistent with autonomic dysregulation. If future prospective studies support these findings, the nasal turbinates and the increased parasympathetic activity controlling their dilation could become a new therapeutic target. The nuclear whole-body blood pool imaging as shown in this article may prove to be a convenient tool for predicting and monitoring patients for future medical risks and their response to therapeutic interventions. 48
Footnotes
Authors' Contributions
The corresponding author is responsible for ensuring that the descriptions are accurate and agreed by all the authors. W.T.P. is a Nuclear Medicine physician and is the first and corresponding author. He made the initial clinical observation and designed the study, performed image analysis, and wrote significant portions of the article.
N.J.I. is a Radiology resident who performed the gathering of the clinical information on each patient, entered the data in a REDCap database, and contributed to the editing of the article. S.B.E. is a Radiology resident who set up the REDCap database information capture. He also participated in the design of the study. H.T.D. is a Rheumatologist who referred the patients for the whole-body blood pool studies, worked on the initial design of the study, and edited the article. J.G.S. is a Pathologist who edited the article and assisted with article submission. J.A.G. is a professional statistician who has many publications using statistical analysis. He made recommendations for the design of the current study based on the planned future statistical analysis. After the data were collected in REDCap, he performed all the statistical analysis, correlations, and design of the tables, showing the statistical correlations. All of our data are available in REDCap for review upon request.
Acknowledgments
The authors thank Jonathan Sumner of UT Health San Antonio Creative Media Services for his help on the formatting of the images in the article and Dr. Daniel Duffy of Audie Murphy VA, San Antonio for his guidance and inspiration in the use of whole body blood pool imaging.
Author Disclosure Statement
None of the authors has a conflict of interest regarding any aspects of this article.
Funding Information
No funding was received for this retrospective research.