
Abstract
Background:
This study aimed to investigate the prevalence rate of adult sarcopenic obesity and discuss its predisposing factors.
Methods:
A total of 14,608 participants including 7521 men and 7087 women aged 18–93 years were enrolled in this study. The definition of sarcopenia was based on appendicular skeletal muscle mass index (ASMI) standards (≤7.0 kg/m2 for men and ≤5.7 grams/m2 for women). The definition of obesity followed percent body fat (PBF) ≥25% for men and ≥35% for women. Sarcopenic obesity was defined as the combination of sarcopenia and obesity diagnosis. Risk factors for the onset of sarcopenic obesity were analyzed by logistic regression analysis, followed by diagnostic value assessment.
Results:
There were 496 cases of sarcopenic obesity, including 308 male patients and 188 female patients. The overall prevalence rate was 3.4%, with 4.10% for men and 2.65% for women. Compared with nonsarcogenic obesity group, the subjects with sarcogenic obesity showed shorter height and circumference of limbs, arm muscle, neck, chest, waist and hip, lighter weight, lower body mass index (BMI), bone mineral content (BMC), skeletal muscle mass, basal metabolic rate (BMR), body cell mass, fitness score and ASMI, and higher body fat mass, PBF, waist–hip ratio (WHR), visceral fat area (VFA), extracellular fluid/total body fat, and extracellular water/total body water (ECW/TBW; P < 0.01). Based on logistic regression analysis, BMI, BMC, PBF, WHR, BMR, VFA, fitness score, lean balance trunk, lean balance left leg, ASMI, ECW/TBW and the circumference of left arm, left leg, arm muscle, chest waist and hip were considered as risk factors for sarcogenic obesity (P < 0.05). After receiver operating characteristic (ROC) curve analysis of basic condition, muscle mass, and limb condition, ASMI [area under the curve (AUC) = 0.75] showed relatively high diagnostic value for adult sarcopenic obesity; other indicators (AUC <0.75) showed moderate diagnostic value for adult sarcopenic obesity, except for fitness score. According to joint ROC analysis, combination of BMC, PBF, VFA, and ASMI (AUC = 0.78) showed high diagnostic value for adult sarcopenic obesity. ASMI was correlated with BMI (r = 0.246, P < 0.001), BMC (r = 0.798, P < 0.001), WHR (r = 0.197, P < 0.001), BMR (r = 0.932, P < 0.001), PBF (r = −0.761, P < 0.001), and VFA (r = −0.530, P < 0.001). In adult patients with sarcopenic obesity, a decrease in ASMI indicators may be accompanied by a decrease in BMI, BMC, WHR, and BMR as well as an increase in PBF and VFA.
Conclusion:
The prevalence rate of adult sarcopenic obesity was 3.40%. ASMI was closely correlated with BMI, BMC, PBF, WHR, BMR, and VFA, which may serve as early indicators in the diagnosis of adult sarcopenic obesity.
Introduction
Sarcopenia is a type of degenerative disease characterized by progressive, widespread reduction in skeletal muscle mass and strength with age. 1 The increase in life expectancy of the population in recent decades has led to a significant rise in the prevalence of sarcopenia. 2 Factors commonly associated with sarcopenia include aging, developmental effects in childhood, malnutrition later in life, prolonged bed-ridden or sedentary lifestyle, chronic wasting diseases, and the intake of specific medications. 3 Available studies have shown that sarcopenia is connected to many diseases that affect public health, like a combination of sarcopenia with osteoporosis accompanied by ageing-related bone loss, leading to easy falls and fractures in the elderly people, which then becomes one of the main causes of disability and death in the elderly population. 4 –6 The diagnostic criteria for sarcopenia have not been universally agreed upon, but bioelectrical impedance analysis (BIA) combined with appendicular skeletal muscle mass (ASM) index (ASMI) is now widely used clinically to define sarcopenia. 7
With obesity as a global phenomenon and growing at a younger age, it has become one of the most common and neglected public health problems worldwide in the last 40 years. 8,9 Obesity is commonly recognized as a risk factor for metabolic and cardiovascular diseases, and has been shown to contribute significantly to thrombosis, atherosclerosis, and cancer, and to have an impact on hemodynamics and neurohumoral pathways. 10 –13 Internationally, indicators including body mass index (BMI), waist–hip ratio (WHR), and percent body fat (PBF) were currently used to diagnose obesity. 14
Longitudinal studies have shown that fat mass increases with age, peaking at 60–75 years, whereas muscle mass and strength begin to decline gradually at age 30, with a rapid decline at age 60, which results in the emergence of a group of patients with both sarcopenia and obesity. 15 –17 In 1996, Heber et al. first referred to the coexistence of reduced muscle mass and increased fat mass as sarcopenic obesity. 18 Compared with patients with simple obesity or simple sarcopenia, patients with sarcopenic obesity are at higher risk for physical dysfunction, metabolic disorders, are prone to a combination of multiple chronic diseases, and are closely linked to physical disability, worsening of the condition, and mortality. 19 –22 Therefore, in the era of rapid population aging, sarcopenic obesity is increasingly gaining attention in clinical practice. However, there is a lack of research on the prevalence rate of sarcopenic obesity in adults and its diagnosis in China.
In this study, we investigated the prevalence rate of adult sarcopenic obesity in China and discussed its predisposing factors to provide reference for the prevention and diagnosis of sarcopenic obesity.
Methods
Subjects
A total of 14,608 participants (18–93 years old) who received examinations in Tongde Hospital of Zhejiang Province from July 1, 2016 to December 30, 2020 were recruited for this experiment. All participants met the following inclusion and exclusion criteria.
Inclusion criteria were as follows: participants (1) aged ≥18 years old, (2) are able to be self-active and (3) self-care, and (4) have no cognitive disorder.
Exclusion criteria were as follows: participants have (1) malignant cancers, (2) cardiovascular diseases, (3) liver and kidney dysfunction, (4) electronic and metal implants such as pacemakers, (5) congenital muscular and skeletal dysplasia, and (6) recently been using drugs that influence muscle function and body composition (glucocorticoids, diuretics, etc.).
The study was carried out in accordance with the guidelines of the Declaration of Helsinki, and the study protocol was approved by the Scientific Research Ethics Committee at Tongde Hospital of Zhejiang Providence (Approval No. 2022-11-JY).
Definition of sarcopenia
All participants received a diagnosis of sarcopenia using BIA. Sarcopenia is defined as ASMI, which was made by Asian Working Group for Sarcopenia (AWGS) in 2019. 23 The diagnostic threshold is ≤7.0 kg/m2 for men and ≤5.7 grams/m2 for women. ASM is the sum of the muscle volume from both upper limbs and both lower limbs. ASMI = ASM/height. 2
Definition of obesity
For identifying obesity, all participants were tested by PBF diagnostic stand, as follows: obesity was diagnosed based on PBF ≥25% for men and ≥35% for women, 24 according to the World Health Organization (WHO).
Definition of sarcopenic obesity
The diagnosis of sarcopenic obesity is based on the combinative diagnosis of sarcopenia and obesity. 25
Height measurement
HCM-800 ultrasonic machine (Shengyuan) for physical examination was used to measure height of all participants, with the measurement value accurate to 0.1 cm. During the measurement, the subjects were required to stand barefoot and upright with their eyes looking straight ahead.
Body composition test
Inbody720 analyzer (Biospace, Seoul, Korea) was applied to measure body composition including weight, BMI, PBF, WHR, visceral fat area (VFA), soft lean mass, skeletal muscle mass, ASM, lean balance trunk, intracellular and extracellular water (ECW), mineral and basal metabolic rate (BMR), and so on. The participants taking part in the test were asked not to eat and drink, and avoid intense exercise at least 3 hr before the test and to empty the bladder before the measurement. During the test, the subjects were required to wear light clothing, stand barefoot with their feet on the foot electrodes, hold the hand electrodes with both hands, and relax their bodies with their upper limbs hanging down naturally. The data results were automatically stored in the computer through the body composition software as soon as the operator entered the subject's height, age, and gender.
Statistical analysis
Statistical analysis was realized using SPSS 20.0 software (IBM, Chicago, IL), where quantitative data were presented as mean ± standard deviation. Difference comparisons between two groups were analyzed by independent t-test and risk factors for the occurrence of sarcopenic obesity were analyzed by logistic regression analysis. The diagnostic value of risk factors for sarcopenic obesity in adults was displayed by receiver operating characteristic (ROC) curves, followed by area under curve (AUC) value calculation. The diagnostic value of indicators with AUC values <0.75 is moderate, that of indicators with AUC values >0.75 and <0.9 is good, and that of indicators with AUC values >0.9 is significant. The correlation of ASMI with BMI, bone mineral content (BMC), PBF, WHR BMR, and VFA was analyzed by Pearson correlation analysis using GraphPad Prism 7.0 software (GraphPad Software, San Diego, CA). The threshold of statistical significance for comparing differences was set at P < 0.05.
Results
Prevalence of sarcopenic obesity in adults
There were 7521 men and 7087 women who participated in this study, and among them 308 men and 188 women were determined as sarcogenic obesity, with a total prevalence rate of 3.40%, 4.10% for men and 2.65% for women, according to the results based on ASMI diagnosis (≤7.0 kg/m2 for men and ≤5.7 grams/m2 for women) and PBF diagnosis (≥25% for men and ≥35% for women). Therefore, we divided all subjects into sarcogenic obesity group (n = 496) and nonsarcogenic obesity group (n = 14,112).
Comparison of basic conditions
As given in Table 1, the sarcogenic obesity group was significantly older, shorter in height, and lighter in weight than the nonsarcogenic obesity group (P < 0.001). The values of BMI, BMC, skeletal muscle mass, BMR, body cell mass, and fitness score in the sarcogenic obesity group was significantly lower than those in the nonsarcogenic obesity group (P < 0.001). Meanwhile, the values of body fat mass, PBF, WHR, and VFA in the sarcogenic obesity group was higher than those in the nonsarcogenic obesity group (P < 0.001). However, there were no significant difference in fat free mass, intracellular water and ECW, total body water (TBW), mineral, protein, as well as soft lean mass between the sarcogenic obesity group and the nonsarcogenic obesity group.
Comparison of Basic Conditions Between Sarcopenic Obesity Group and Nonsarcopenic Obesity Group
Difference comparisons between two groups were analyzed by independent t-test, and the threshold of statistical significance for comparing differences was set at P < 0.05.
BMC, bone mineral content; BMI, body mass index; BMR, basal metabolic rate; ECW, extracellular water; PBF, percent body fat; TBW, total body water; VFA, visceral fat area; WHR, waist–hip ratio.
Comparison of muscle mass and limbs
As given in Table 2, the sarcogenic obesity group had less muscle mass including lean balance right arm, lean balance left arm, lean balance right leg, and lean balance left leg than the nonsarcogenic obesity group (P < 0.001). Besides, the ASMI was remarkably lower in the sarcogenic obesity group than in the nonsarcogenic obesity group (P < 0.001). For limbs comparison, the sarcogenic obesity group showed high values in extracellular fluid/total body fat and ECW/TBW relative to the nonsarcogenic obesity group (P < 0.001; Table 3). But, the sarcogenic obesity group showed markedly smaller circumference of right arm, left arm, right leg, left leg, arm muscle, neck, chest, waist, and hip than the nonsarcogenic obesity group (P < 0.01; Table 3).
Comparison of Muscle Mass Between Sarcopenic Obesity Group and Nonsarcopenic Obesity Group
Difference comparisons between two groups were analyzed by independent t-test, and the threshold of statistical significance for comparing differences was set at P < 0.05.
ASMI, appendicular skeletal muscle mass index.
Comparison of Limbs Between Sarcopenic Obesity Group and Nonsarcopenic Obesity Group
Difference comparisons between two groups were analyzed by independent t-test, and the threshold of statistical significance for comparing differences was set at P < 0.05.
ECF, extracellular fluid; TBF, total body fat.
Analysis of risk factors for sarcopenic obesity in adults
Table 4 provides basic condition-related risk factors of sarcopenic obesity by logistic regression analysis. The results suggested that age, BMI, BMC, PBF, WHR, BMR, VFA, and fitness score were associated with the occurrence of sarcopenic obesity in adults (P < 0.05). As for muscle mass-related risk factors, lean balance left arm, lean balance trunk, lean balance left leg, and ASMI were detected to be associated with the occurrence of sarcopenic obesity in adults (P < 0.01; Table 5). In addition, as illustrated in Table 6, ECW/TBW and the circumference of left arm, left leg, arm muscle, chest, waist, and hip might be risk factors for the development of sarcopenic obesity in adults (P < 0.05).
Analysis of Basic Condition Related Risk Factors of Adult Sarcopenic Obesity
Risk factors for the occurrence of sarcopenic obesity were analyzed by logistic regression analysis.
CI, confidence interval; OR, odds ratio; SE, standard error.
Risk Factors Related to Muscle Mass in Adult Sarcopenic Obesity
Risk factors for the occurrence of sarcopenic obesity were analyzed by logistic regression analysis.
Risk Factors Related to Limb Condition in Adult Sarcopenic Obesity
Risk factors for the occurrence of sarcopenic obesity were analyzed by logistic regression analysis.
Analysis of the early diagnostic value of sarcopenic obesity in adults
According to the exhibition of ROC curve (Fig. 1A) and the analysis of AUC value (Table 7), fitness score was significantly highly valuable for diagnosing adult sarcopenic obesity than other risk factors in basic condition (AUC = 0.95), and age, BMI, BMC, PBF, WHR, BMR, and VFA showed moderate diagnostic value for adult sarcopenic obesity (AUC <0.75). Among muscle mass-related indicators, ASMI showed a significant diagnostic value for sarcopenic obesity (AUC = 0.75), and lean balance left arm, lean balance trunk, and lean balance left leg showed moderate diagnostic value for adult sarcopenic obesity (AUC <0.75) (Table 7 and Fig. 1B). After ROC analysis of limb condition, circumference of left arm, left leg, arm muscle, chest, waist, and hip as well as ECW/TBW showed moderate diagnostic value for adult sarcopenic obesity (AUC <0.75; Table 7 and Fig. 1C).
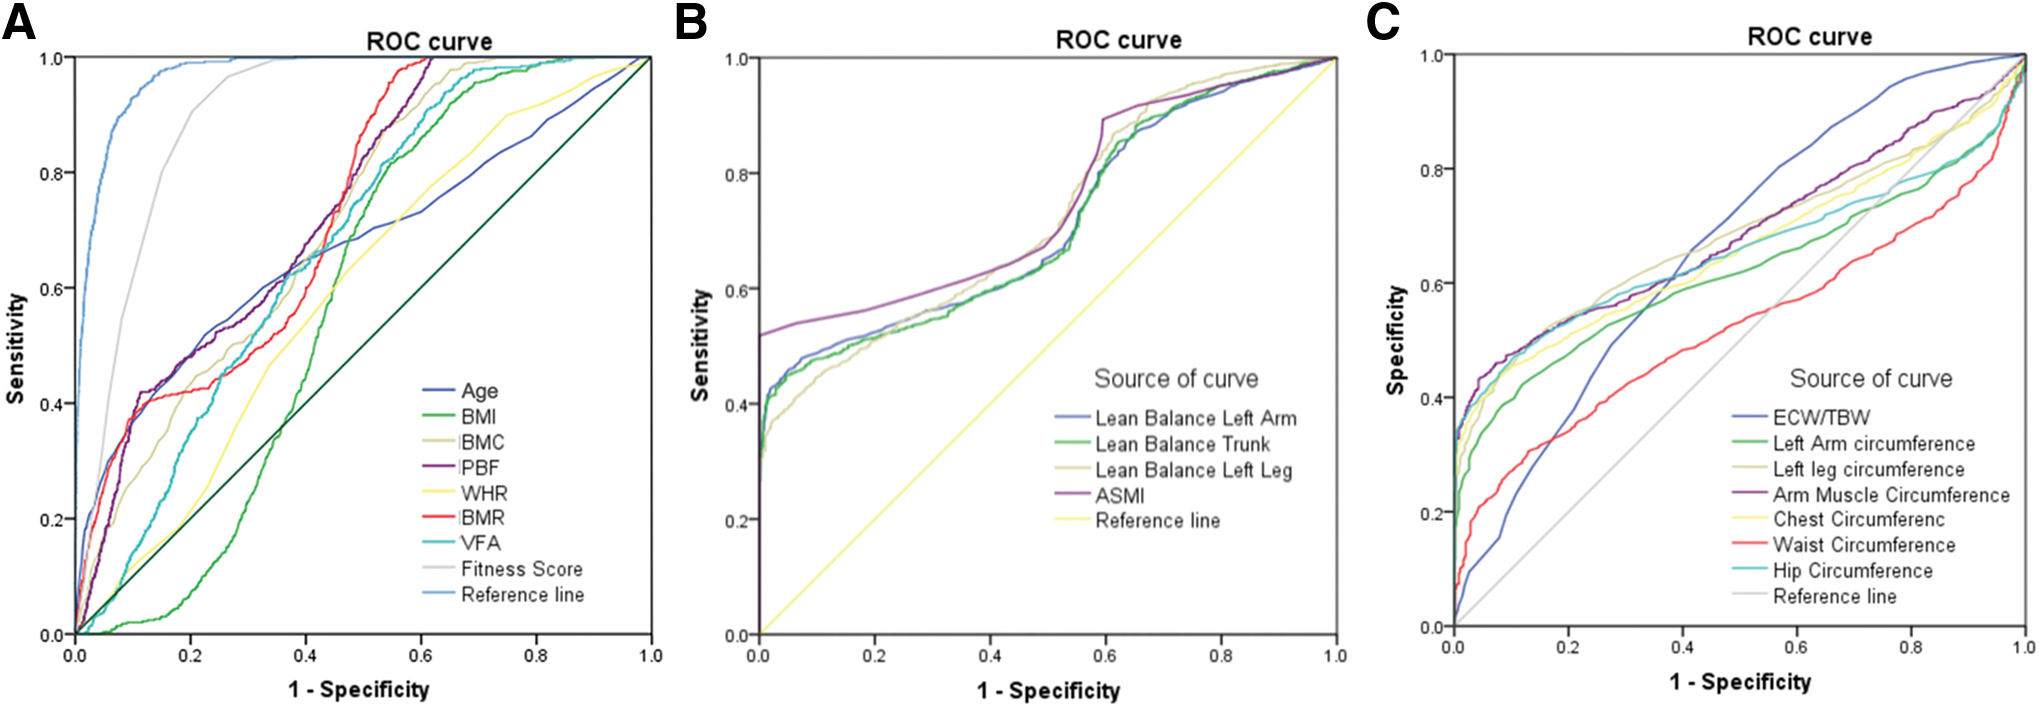
ROC curve for diagnosing adult sarcopenic obesity.
Receiver Operating Characteristic Curve Analysis of Indicators in the Diagnosis of Adult Sarcopenic Obesity
The diagnostic value of risk factors for sarcopenic obesity in adults was displayed by ROC curves, followed by AUC value calculation.
AUC, area under the curve; ROC, receiver operating characteristic.
Correlation between ASMI level and baseline conditions
As given in Table 8, ASMI was significantly correlated with baseline indicators including BMI, BMC, PBF, WHR, BMR, and VFA (P < 0.001). In addition, as delineated in Table 8 and Fig. 2, ASMI was positively correlated with BMI (r = 0.246), BMC (r = 0.798), WHR (r = 0.197), and BMR (r = 0.932), and was negatively correlated with PBF (r = −0.761) and VFA (r = −0.530).
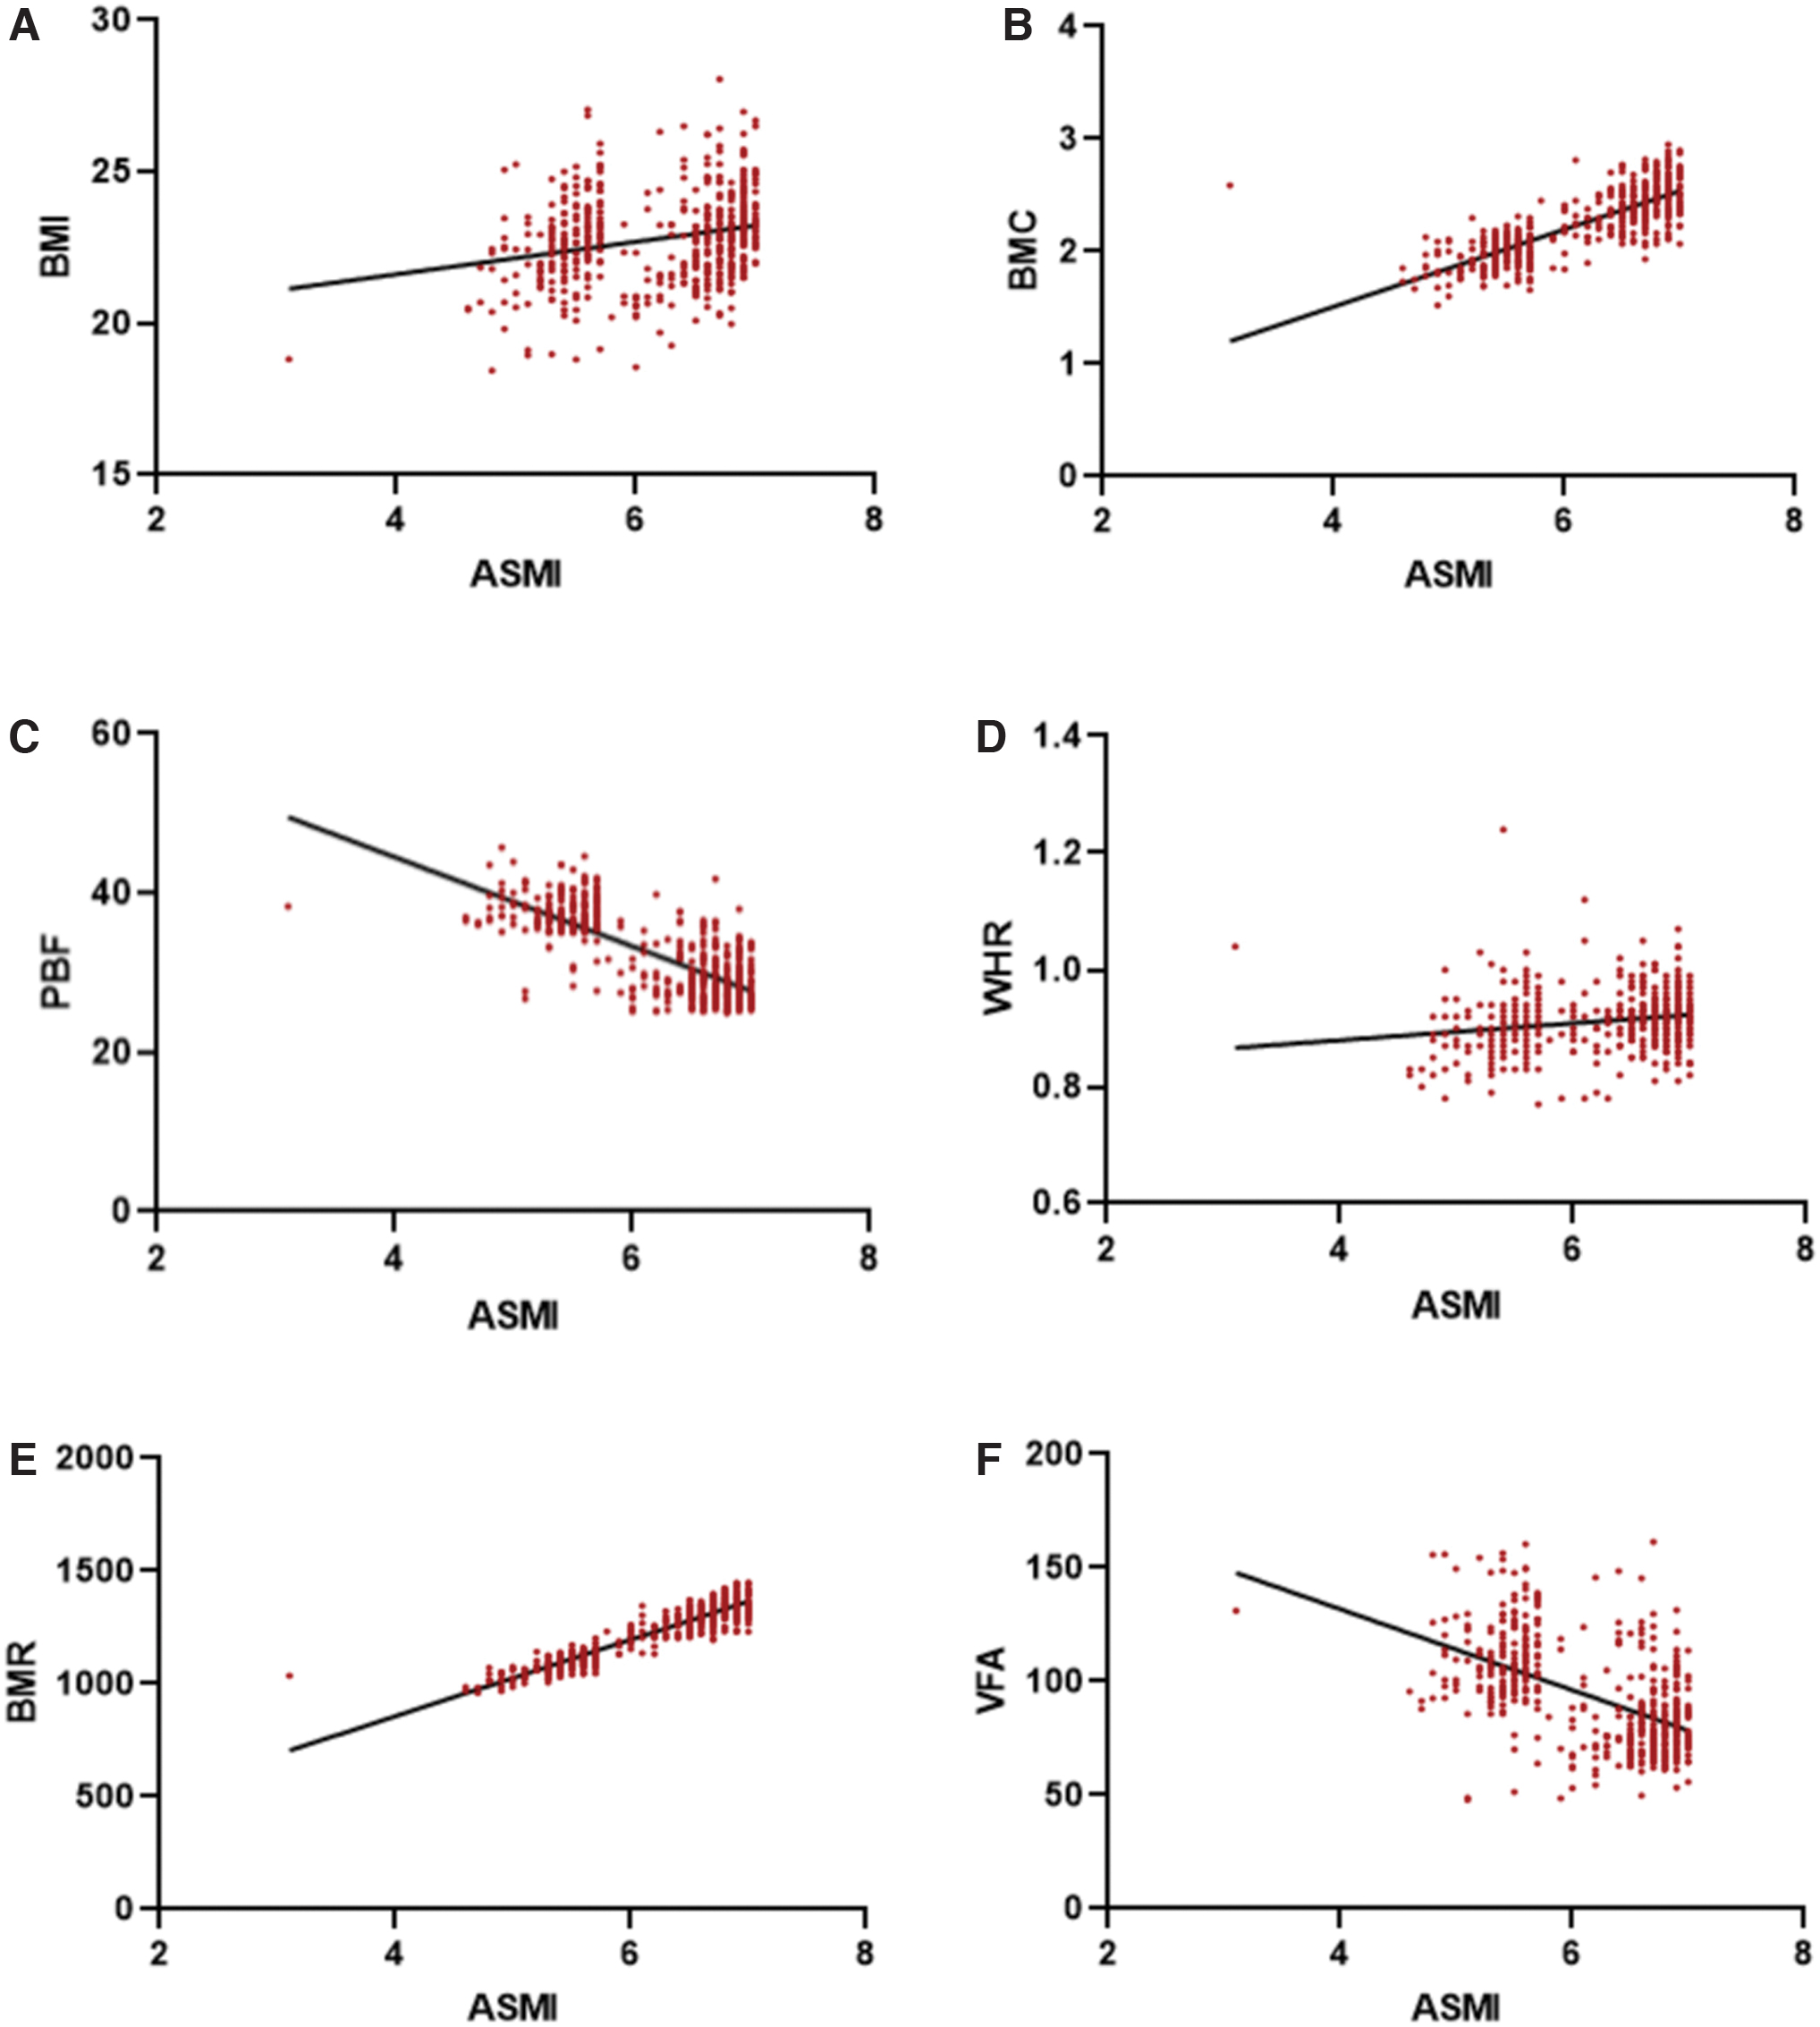
Correlation between ASMI level and baseline conditions in adult patients with sarcopenic obesity.
Correlation Between Appendicular Skeletal Muscle Mass Index Level and Baseline Conditions in Adult Patients with Sarcopenic Obesity
The correlation of ASMI with BMI, BMC, PBF, WHR BMR, and VFA was analyzed by Pearson correlation analysis.
Discussion
In retrospect, most of the studies on sarcopenic obesity at home and abroad have focused on the elderly group, and there are less studies on sarcopenic obesity in the adult group, let alone in China. 26 However, the growing problems of poor dietary structure, insufficient exercise, and choric diseases have led to a trend of young adults and middle-aged adults suffering from sarcopenic obesity. 27,28 In this study, we assessed sarcopenic obesity in 14,608 participants aged 18–93 years in China and found that the overall prevalence of sarcopenic obesity in adults was 3.40%, with 4.10% in men and 2.65% in women. It is suggested that the age range of patients threatened by sarcopenic obesity is expanding younger.
At present, the rise in the incidence of sarcopenic obesity as well as the multiple complications it triggers not only seriously declines the life quality of patients, but also bring a heavy burden to society. 29 Research on sarcopenic obesity is in its early stages, and its definition and diagnostic criteria remain unified. 30 The combination of sarcopenia and obesity diagnoses is widely used in most domestic and international studies to assess sarcopenic obesity, but the application of different diagnostic criteria for sarcopenia and obesity has produced significant differences in obtained prevalence rate of sarcopenic obesity. 31 Therefore, finding effective assessment methods is of great importance for the early prediction, diagnosis, and management of adult sarcopenic obesity.
Assessment of skeletal muscle mass is the basis for diagnosing sarcopenia. 32 Guidelines for the diagnosis of sarcopenia recommend the assessment of skeletal muscle mass as one of the main diagnostic parameters for the diagnosis of sarcopenia and give the threshold values for determining low skeletal muscle mass using dual-energy X-ray absorptiometry (DXA) and BIA, respectively. 23,33 Considering the ethnic variability, we evaluated 14,608 subjects for ASMI by referring to the definition and diagnostic criteria of sarcopenia in accordance with Asian population given by AWGS in 2019. 23 In this study, BMI, WHR, and PBF diagnostic obesity thresholds were introduced to assess all subjects, respectively, and the results of these were combined with patients with sarcopenia for counting sarcopenic obesity cases.
BMI is now commonly used as a clinical indicator to diagnose obesity, but it relies on height and weight and cannot completely distinguish muscle from fat, and may judge a muscular person as obese. 34 WHR emphasizes the determination of abdominal obesity and conveys signals of disease risk, but provides a relatively one-sided definition of obesity and fails to detect peripheral obesity caused by the accumulation of fat in the hips and limbs. 35 Compared with BMI and WHR, PBF directly reflects body fat content and distinguishes whether weight gain is attributed to increased muscle mass or to increased fat, and is considered the gold standard for evaluating obesity. 36
Considering the above reasons, we finally identified 496 cases of sarcopenic obesity in 14,608 subjects based on the combination of ASMI diagnosis (≤7.0 kg/m2 for men and ≤5.7 grams/m2 for women) and PBF diagnosis (≥25% for men and ≥35% for women), and the prevalence rate was higher in men (4.10%) than in women (2.65%). As a matter of fact, prevalence of sarcopenic obesity in elderly patients in Europe was 42.9% in men and 18.1% in women, 37 suggesting that men are more likely to be suffering from sarcopenic obesity than women. Collectively, it arrives at a conclusion that ASMI diagnosis combined with PBF diagnosis could be an effective and applicable strategy for defining adult sarcopenic obesity, and adult men are at greater risk of developing sarcopenic obesity than adult women in China.
A variety of factors cause body composition to change with aging. For example, body fat increases until the seventh decade of life, and thereafter decreases, 38 vertebral compression leads to a loss of height, which affects anthropometric measures such as BMI, 39 muscle mass declines after peaking in the fourth decade, so that weight gain is mostly gained as fat rather than lean mass. 40 In addition, as we age, the reduction in energy expenditure is not proportionally associated with a reduction in the desire to eat, which promotes fat accumulation and leads to small year positive changes in energy balance, which may lead to weight gain. 26
By comparing the body composition indicators, muscle mass, and limbs, we found significant differences between sarcopenic obesity group and nonsarcopenic obesity group in BMI, BMC, PBF, WHR, BMR, VFA, fitness score, ASMI, ECW/TBW and circumference of left arm and leg, arm muscle, chest, waist and hip, which were further revealed as risk factors of adult sarcopenic obesity. In addition, we also found that the sarcogenic obesity group was older in age than the nonsarcogenic obesity group, and age was associated with the occurrence of sarcopenic obesity in adults. To seek effective indicators to prevent adult sarcopenic obesity, we performed a further investigation using ROC curve and AUC value analysis, from which fitness score (AUC = 0.905) and ASMI (AUC = 0.75) might act as valuable indicators in the early prediction of sarcopenic obesity in adults.
We further did a correlation analysis of ASMI with BMI, BMC, PBF, WHR, BMR, and VFA in patients diagnosed with this ailment based on the ROC curve analysis of basic condition. Evidence has shown that changes in body composition are strongly associated with the development of sarcopenic obesity. 41 With aging and decreasing physical activity, skeletal muscle mass undergoes a progressive decline accompanied by loss of muscle strength and bone mineral density, 42 and at the same time, the loss of mass of skeletal muscle, one of the main target organs for insulin, may cause insulin resistance, which leads to a decrease in glucose metabolism levels of the body. 43 In addition, high caloric intake and low levels of physical activity contribute to fat storage in the abdomen, limbs, or internal organs. 44 Based on previous findings, we further analyzed the correlation between ASMI level and baseline conditions in adult patients with sarcopenic obesity. Of note, ASMI was positively correlated with BMI, BMC, WHR, and BMR, and was negatively correlated with PBF and VFA.
In conclusion, this study unraveled that the prevalence rate of adult sarcopenic obesity was 3.40% in China, and supported that the combination of ASMI and PBF diagnosis could be an effective definition for sarcopenic obesity in adults. Meanwhile, this study also demonstrated a close correlation of ASMI with BMI, BMC, PBF, WHR, BMR, and VFA, which could be potentially applied as positive or negative indicators in the diagnosis of adult sarcopenic obesity in Asia.
Footnotes
Acknowledgments
The authors thank the doctors and nurses in Physical Examination Center of Tongde Hospital, Zhejiang Province who facilitated the recruitment and interviews.
Authors' Contributions
X.L. designed the study, collected and analyzed the data, and wrote the article, W.J. carried out the recruitment and collected the data, B.C. gave critical comments. All the authors have read and approved the final version of the article.
Author Disclosure Statement
The authors declare no conflicts of interest.
Funding Information
This study was supported by Tongde Hospital of Zhejiang Province.