




Abstract
Background:
Resting skeletal muscle in insulin resistance prefers to oxidize carbohydrate rather than lipid, exhibiting metabolic inflexibility. Although this is established in resting muscle, complexities involved in directly measuring fuel oxidation using indirect calorimetry across a muscle bed have limited studies of this phenomenon in working skeletal muscle. During mild exercise and at rest, whole-body indirect calorimetry imperfectly estimates muscle fuel oxidation. We provide evidence that a method termed “ΔRER” can reasonably estimate fuel oxidation in skeletal muscle activated by exercise.
Methods:
Completely sedentary volunteers (n = 20, age 31 ± 2 years, V̇O2peak 24.4 ± 1.5 mL O2 per min/kg) underwent glucose clamps to determine insulin sensitivity and graded exercise consisting of three periods of mild steady-state cycle ergometry (15, 30, 45 watts, or 10%, 20%, and 30% of maximum power) with measurements of whole-body gas exchange. ΔRER, the RER in working muscle, was calculated as (V̇CO2exercise –V̇CO2rest)/(V̇O2exercise – V̇O2rest), from which the fraction of fuel accounted for by lipid was estimated.
Results:
Lactate levels were low and stable during steady-state exercise. Muscle biopsies were used to estimate mitochondrial content. The rise of V̇O2 at onset of exercise followed a monoexponential function, with a time constant of 51 ± 7 sec, typical of skeletal muscle; the average O2 cost of work was about 12 mL O2/watt/min, representing a mechanical efficiency of about 24%. At work rates of 30 or 45 watts, active muscle relied predominantly on carbohydrate, independent of insulin sensitivity within this group of very sedentary volunteers.
Conclusions:
The fraction of muscle fuel oxidation from fat was predicted by power output (P < 0.001) and citrate synthase activity (P < 0.05), indicating that low mitochondrial content may be the main driver of fuel choice in sedentary people, independent of insulin sensitivity.
Introduction
There is abundant evidence that resting, insulin-resistant skeletal muscle prefers to oxidize carbohydrate. 1 –5 This contrasts with a preference for lipid oxidation in skeletal muscle from active, fit, healthy individuals. 6 This preference for carbohydrate in resting muscle has been proposed to be responsible for insulin resistance in skeletal muscle, at least in part. 7 However, it is less clear that insulin-resistant muscle continues to prefer carbohydrate during mild exercise of an intensity that is encountered during, for instance, easy walking.
Several studies, using combinations of whole-body (pulmonary) gas exchange measurements and tracer infusions, have suggested that insulin-resistant muscle is capable of oxidizing lipid and, in some cases, may prefer to oxidize lipid from plasma. 8 –11 However, all these studies used whole-body gas exchange measurements to use indirect calorimetry to estimate muscle fuel oxidation without correction for contributions from tissues other than muscle, so the interpretation of their results may be somewhat confounded.
Classic studies of fuel preference in resting muscle used arteriovenous catheterization techniques, which present methodological challenges and additional risk to patients, limiting their wide-spread use in the study of fuel preference, especially during exercise. It has been recognized for decades that low-intensity exercise produces increments in pulmonary V̇O2 of an extent that can be accounted for almost entirely by fuel oxidation in working muscle. 12 –14 Thus, increments in V̇O2 and V̇CO2 during mild exercise have been used to derive a respiratory exchange ratio (RER) in working muscle in healthy people that has the potential for application to insulin resistance. 14 The purposes of the present study, therefore, were two-fold: first, to provide data supporting the validity of this technique for estimating fuel oxidation in working muscle, and second, to use this method to estimate fuel selection in working muscle of individuals who are very sedentary, unfit, and mainly insulin resistant.
Materials and Methods
Screening and euglycemic clamps
This study consisted of three visits to the University of Arizona Clinical and Translational Science Research Center, as shown (Fig. 1). Studies were approved by the University of Arizona Institutional Review Board, and participants gave written, informed consent. Twenty participants (aged 21–55) received a history and physical examination, screening laboratory measurements, measurement of body composition (bioimpedance), an ECG, and a 75 gram oral glucose tolerance test. Participants were not taking any medications that affect glucose metabolism. Participants were instructed to maintain their usual diet and not to engage in exercise 48 hrs before any testing. All volunteers reported not taking part in regular exercise.
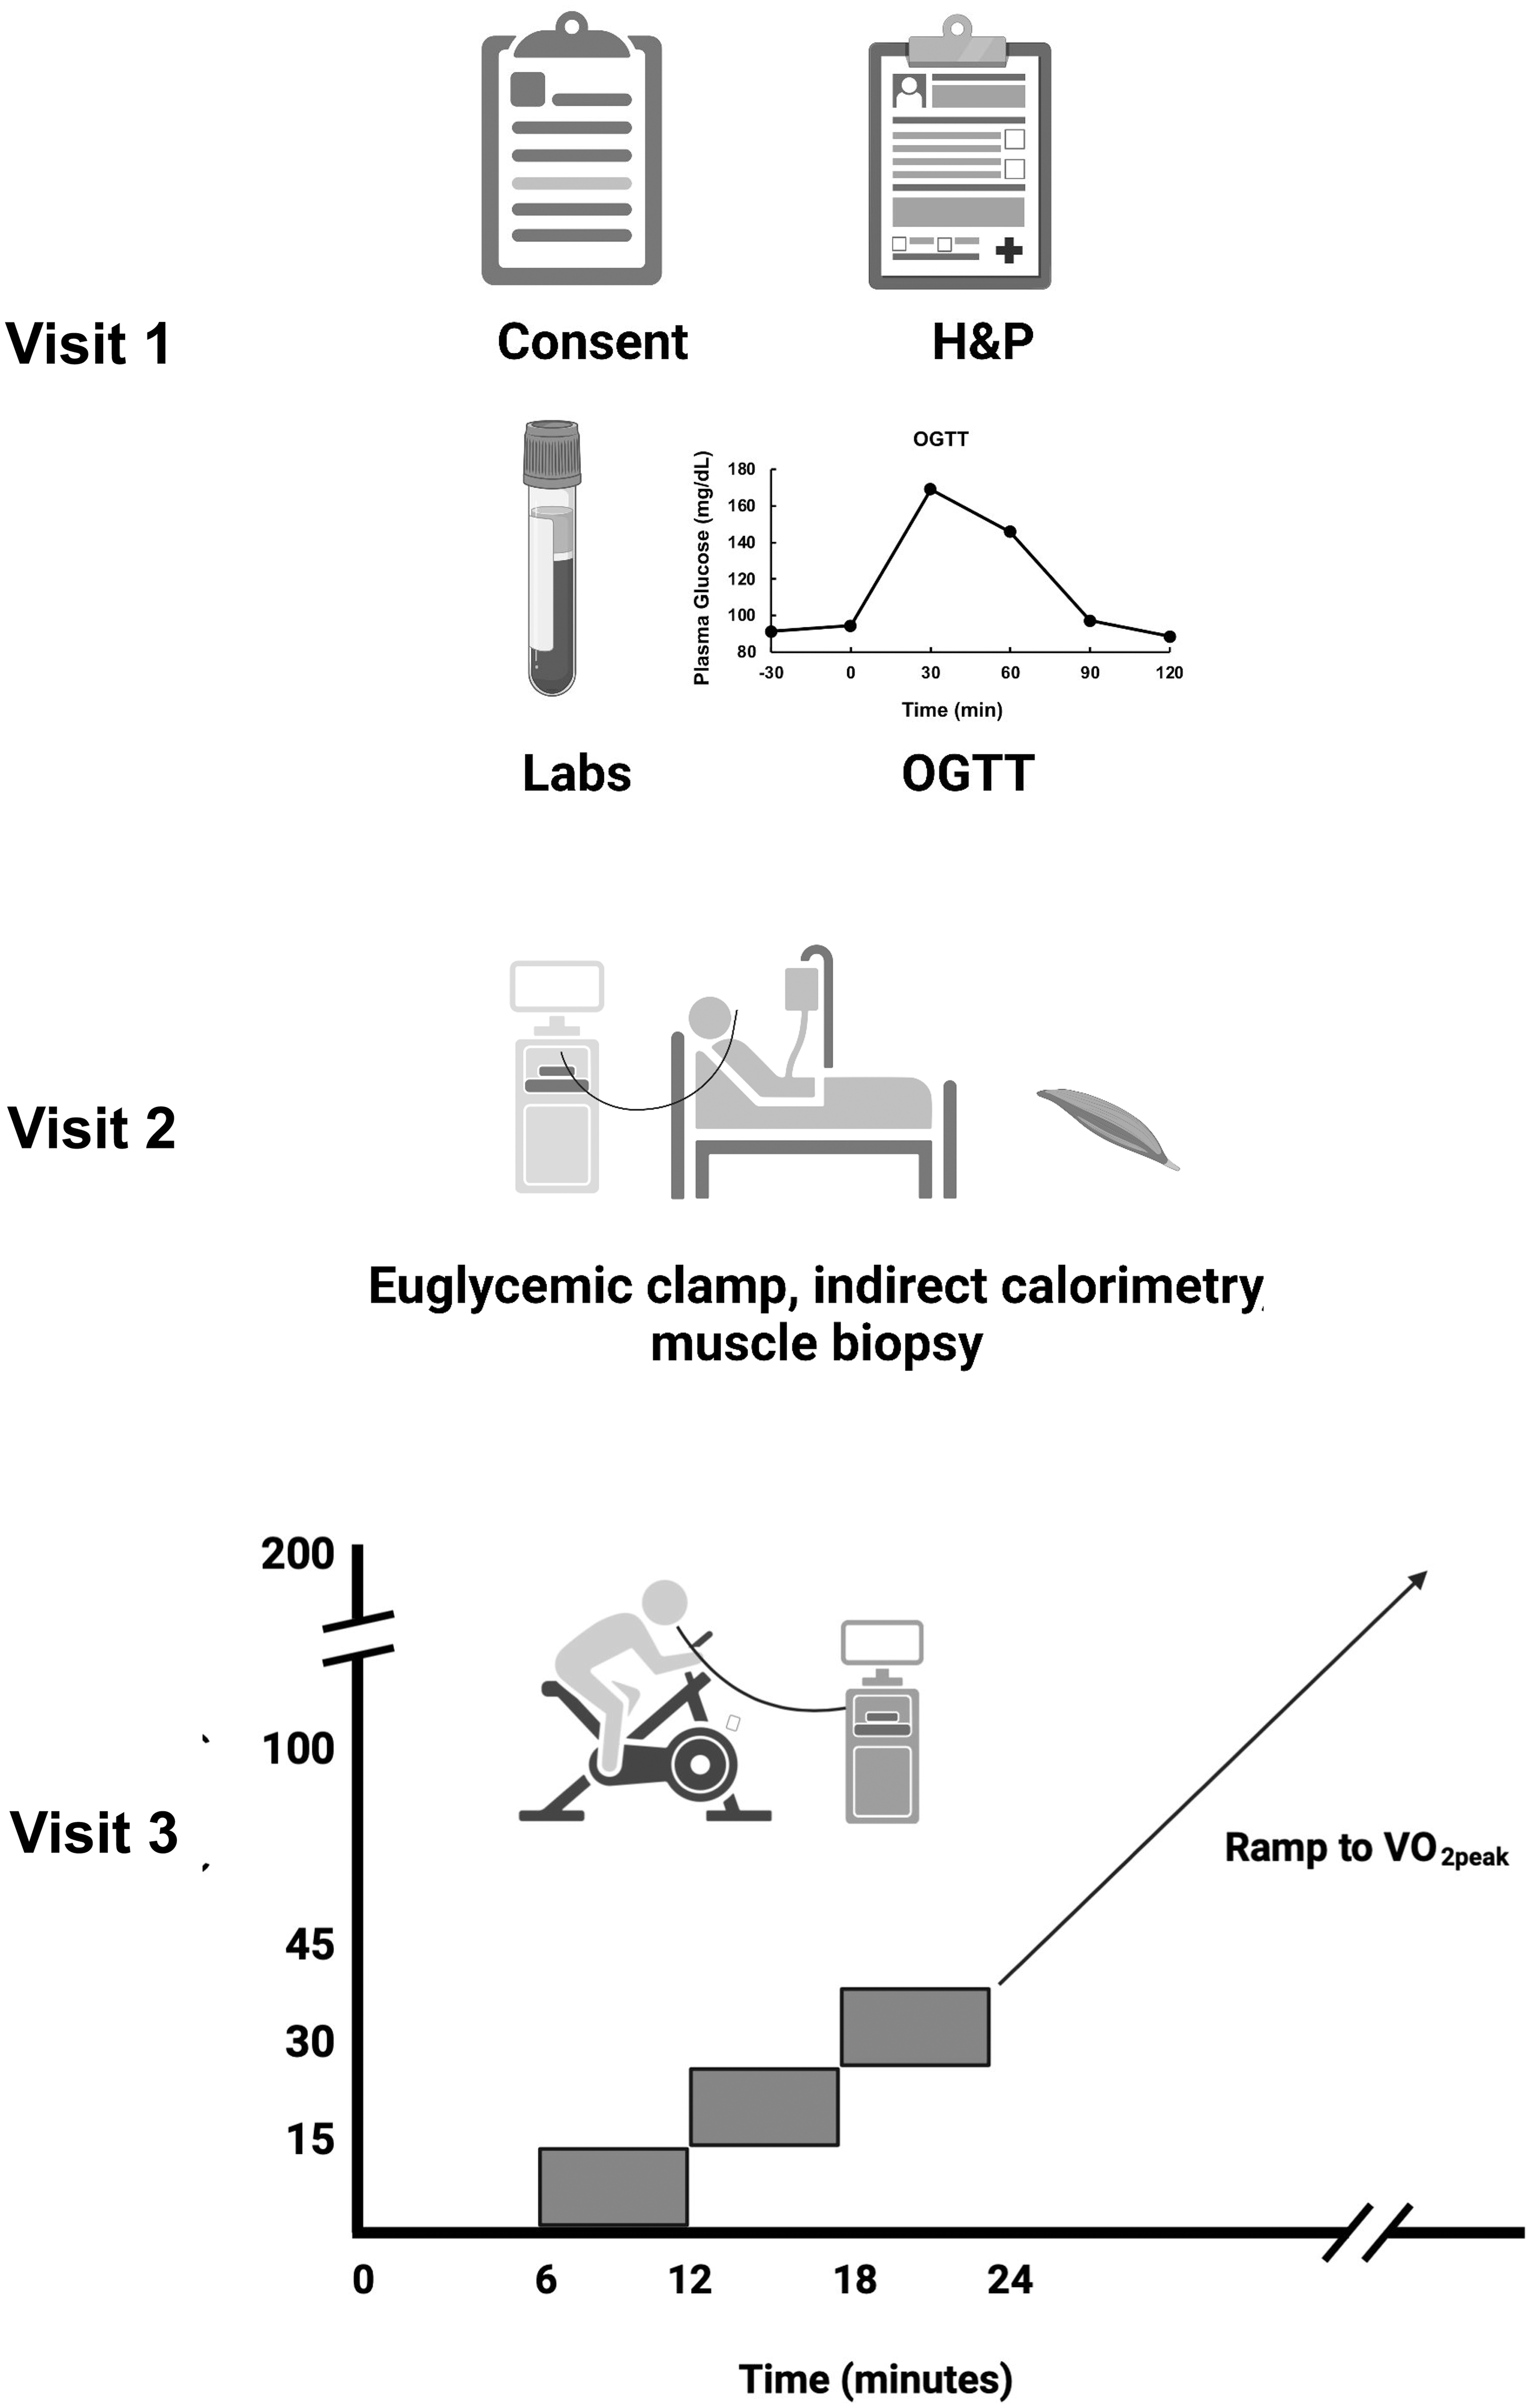
Design of studies. Visit 1 consisted of a screening and consent visit, including history and physical examination, blood drawing for laboratory measurements, and a 75 gram OGTT. Visit 2 consisted of a euglycemic, hyperinsulinemic clamp experiment with muscle biopsies, and Visit 3 consisted of a graded cycle ergometry test with indirect calorimetry and a ramp protocol to determine VO2peak. OGTT, oral glucose tolerance test.
All volunteers underwent a euglycemic, hyperinsulinemic clamp with indirect calorimetry and percutaneous muscle biopsies, starting at 7–8 am after an overnight fast. 15 Isotopically labeled glucose (6,6-dideuteroglucose, Cambridge Laboratories) was used to trace glucose metabolism, 16 and steady-state conditions were assumed for calculating the rates of glucose metabolism. Participants had a percutaneous needle biopsy of the vastus lateralis muscle using under basal conditions 1 h before starting an insulin infusion at a rate of 80 mU•m−2•min−1. One half hour before starting the insulin infusion, indirect calorimetry was used to measure basal rates of oxygen consumption and carbon dioxide production. Plasma glucose was measured every 5–10 min and euglycemia was maintained using an infusion of 20% dextrose. Ninety minutes after starting the insulin infusion, indirect calorimetry was again used to measure gas exchange for 30 min. Biopsies were frozen in liquid nitrogen for later analysis. 15,16
Exercise testing
On another day, at least 1 week separated from the glucose clamp, gas exchange measurements were made at rest and during progressive cycle exercise using a Parvo Medics metabolic measurement system (TrueOne 2400; Parvo Medics, Salt Lake City, UT) (Fig. 1, Visit 3). This system relies on gas measurements from a mixing chamber and sampling was done four times per minute. After catheter placement for blood sampling, subjects rested on the cycle for 6 min and then exercised at power outputs of 15, 30, and 45 watts for 6 min at each intensity. V̇O2 and V̇CO2 values at rest and during the three exercise periods were used to calculate ΔV̇O2 and ΔV̇CO2 during exercise.
Delta values were used to calculate a Respiratory Exchange Ratio due to working muscle (ΔRER = ΔV̇CO2/ΔV̇O2). ΔRER estimates the oxidative metabolism of muscle performing mild exercise. 14 Blood was collected for measurement of lactate concentrations during this period. This was followed by a ramp protocol to determine V̇O2peak. One subject could not adequately complete the exercise protocol due to anxiety and another had resting blood lactate levels greater than 2 mM, so their exercise data were not used.
Muscle biopsy processing
Muscle biopsies were stored in liquid nitrogen until they were homogenized 15 for assays of ANT1 content and acetylation 17 or citrate synthase activity. 18
ANT1 acetylation analysis
ANT is one of the most abundant mitochondrial proteins, 19 making it feasible to quantify ANT using lysates of whole muscle. ANT1 is the sole identifiable ANT isoform in human skeletal muscle. 20 ANT1 acetylation (%) and abundance were estimated using 13 C and 15 N-labeled synthetic peptides surrounding the acetylation site (lysine 23) as internal standards. 17 These synthetic heavy-labeled peptides had the same amino acid sequences as the tryptic peptides surrounding Lys23 that are observed in mass spectrometry experiments. 21 The abundance of unacetylated ANT1 is referred to as “functional” ANT1 considering the dramatically lower affinity for the acetylated form. 21
Analytical assays
Enrichment of deuterated glucose was determined by LC-MS. 22 Insulin was assayed using ELISA (ALPCO, Salem, NH). Blood lactate was measured using either Analox (Analox Instruments, Lunenburg, MA) or YSI (YSI, Yellow Springs Instruments) lactate analyzers. Plasma insulin was assayed using ELISA. 16 Citrate synthase activity was determined in whole muscle lysates as described. 18
Calculations and statistics
Rates of glucose turnover were calculated using steady-state equations. 23 Carbohydrate and lipid oxidation rates were calculated as described. 24 Statistical comparisons were performed using t-tests or analysis of variance. Pearson's correlation coefficient was used to assess relationships between two variables. The effects of exercise on blood lactate concentrations and whole-body RER were determined using repeated measures analysis of variance (ANOVA procedure, Stata software; StataCorp, College Station, TX). Kinetics of the rise in V̇O2 after starting exercise were determined in two ways, first by fitting the curves to a monoexponential function, 13,25 and second, using the algebraic technique of Whipp. 25 V̇O2 kinetic data were smoothed using three point moving averages (Data Curve Fit Creator; SRS1 Software, Boston, MA).
Curve fitting was done using the Solver add-in for Excel. Integration of smoothed V̇O2 kinetic data was performed using the QUADXY function of ExceLab (ExcelWorks LLC, Boston, MA), which is based on cubic splines. Predictors of muscle fuel oxidation at three submaximal power outputs were assessed using a repeated measures mixed linear models approach (xtmixed procedure, Stata), where the independent variables of power output, insulin-stimulated glucose disposal, ANT content, citrate synthase activity, or the time constant of V̇O2 kinetics at onset of exercise were used as predictors of ΔRER or the fraction of fuel oxidation from lipid.
Results
Participant characteristics
Participants (n = 20) had a large range of adiposity (BMI 20.4–47.0) (Table 1). Fasting plasma glucose and insulin averaged 89 ± 0.1 mg/dL and 5.8 ± 0.7 μU/mL; HbA1c varied between 4.9% and 6.0%. Recruitment over this range was intentional, to represent a broad range of insulin sensitivity.
Characteristics of Participants
Characteristics of volunteers who participated in the study. Data are given as Means ± SD.
Race is defined according to NIH reporting criteria and was self-reported.
Glucose metabolism and insulin action
Responses to 75 gram oral glucose are shown in Fig. 2A and B . By OGTT criteria, 26 three participants had type 2 diabetes mellitus, although all three patients had HbA1c between 5.7% and 6.0%, nondiabetic fasting plasma glucose, and were not being treated with diabetes medications.

Results of OGTT and glucose clamp studies. Plasma glucose
During the glucose clamp, insulin infusion raised serum insulin to 109 ± 7 μU/mL. Basal rates of glucose disposal and appearance were ∼3.5 mg•kg-FFM−1.min−1. Insulin infusion suppressed endogenous glucose production and raised glucose disposal to over 9 mg•kg-FFM−1.min−1 (Fig. 2C). Rates of insulin-stimulated glucose disposal varied from 3.0 to 17.8 mg•kg-FFM−1.min−1. Fat oxidation (Fig. 2D) fell during hyperinsulinemia, and carbohydrate oxidation rose from ∼1 to nearly 4 mg•kg-FFM−1.min−1 (range 2.2–6.7 mg•kg-FFM−1.min−1). Basally, 79% ± 3% of energy expenditure was from lipid, falling to 34% ± 4% during hyperinsulinemia. The fraction of fuel oxidation during hyperinsulinemia accounted for by carbohydrate was strongly correlated with insulin-stimulated glucose disposal (Fig. 2E).
Validation of exercise protocol and effect of exercise on fuel selection in working muscle
Volunteers underwent an exercise study with whole-body gas exchange at rest and during mild steady-state exercise of 15, 30, and 45 watts, followed by a ramp protocol to V̇O2peak. Exercise at 15, 30, and 45 watts caused whole-body V̇O2 to rise. The rise in V̇O2 gave the expected delta mechanical efficiency of skeletal muscle. In addition, the kinetic time constant (tau) of the rise in VO2 to steady state was a value routinely observed in both the V̇O2 kinetics and phosphocreatine recovery kinetics of skeletal muscle transitioning between rest and exercise. Blood lactate rose modestly from about 0.85 at rest to about 1.40 mM at 45 watts of exercise (Fig. 3A) and lactate concentrations were stable during the final 3 min of each 6-min period of exercise at 15, 30, or 45 watts.

Validation of whole-body indirect calorimetry for estimating Respiratory Exchange Ratio in mildly exercising skeletal muscle ΔRER.
The kinetics of V̇O2 between rest and the onset of exercise at 15 watts of power output are shown in Fig. 3B. The rise in V̇O2 after starting exercise shows a rapid rise that was well-fit using a monoexponential function. The time constant tau of the monoexponential rise was 51 ± 7 sec. The algebraic method of Whipp yielded a time constant of 37 ± 8 sec. Values derived using the two methods were positively correlated (r = 0.60, P < 0.05). The relationship between oxygen consumption and power output was linear, with an O2 cost of ∼11.8 mL O2/min/watt power (Fig. 3C). The relationship between power output and whole-body energy expenditure rate also was linear, with a slope indicating a cycling efficiency of about 24%. ΔRER (RER due to working muscle) and whole-body RER data are compared in Table 2.
Whole-Body (RER) and Working Muscle (ΔRER) Respiratory Exchange Ratios
For details of calculation of ΔRER, please see Materials and Methods section.
P < 0.01 versus whole-body RER by repeated measures ANOVA.
At all three power outputs, ΔRER is higher than whole-body RER (Table 2, repeated measures ANOVA, P < 0.001). Therefore, the fraction of fuel oxidation accounted for by fat is lower at each power output when estimated using ΔRER compared to what would have been the case had we used whole-body RER (Fig. 3D; repeated measures ANOVA, P < 0.001). Following steady-state exercise, a ramped exercise protocol was used to estimate VO2peak, which averaged 24.4 mL•kg−1 (range about 17–37 mL•kg) and was a significant predictor of insulin-stimulated glucose disposal (r = 0.55, P < 0.01).
ANT1 content/acetylation and citrate synthase activity
Acetylation of lysine 23 of ANT1 in whole muscle lysates determined by quantitative mass spectrometry averaged 10.5% ± 1.1% (range of 0.6% to 21.2%). ANT1 content was 7.07 ± 0.42 nM/gram muscle wet weight (range 2.66–11.2 nM/gram wet weight). Citrate synthase activity was 3.15 ± 0.19 μM/min per gram muscle wet weight and was not correlated with total ANT content.
Relationships among fuel selection during moderate exercise and power output, insulin sensitivity, ANT1 content, citrate synthase activity, or the time constant for V̇O2 kinetics
Mixed model regression analysis for repeated measures was used to assess whether these factors were independent predictors of ΔRER during moderate cycling exercise. The overall model was highly significant (P < 0.0001). As expected, power output (β = 0.00319 ± 0.0005, P < 0.001) was a significant predictor of fuel oxidation, with higher power outputs predicting higher carbohydrate oxidation.
In addition to power output, citrate synthase activity (β = −0.040 ± 0.017, P = 0.021) was a significant predictor of fuel choice. The negative β for citrate synthase activity indicates that higher citrate synthase activity predicts lower ΔRER, that is, greater fat oxidation. The time constant for V̇O2 kinetics derived using a fit to monoexponential kinetics (β = −0.0021 ± 0.001, P = 0.05) also was marginally significant. Insulin-stimulated glucose disposal during the euglycemic, hyperinsulinemic clamp was not a significant predictor of fuel choice in working muscle. Neither ANT1 content nor acetylation was significant predictor of fuel selection.
Discussion
The concept of metabolic flexibility 7,27 –29 grew from characterization of the “Randle Cycle”. 30 –33 Healthy, resting skeletal muscle prefers to oxidize lipid and responds to insulin by switching fuel preference to carbohydrate. 1,6 This response is a combined result of changes in fuel availability from tissues such as adipose tissue and direct effects of insulin on metabolic pathways in muscle. In contrast, insulin-resistant muscle under basal, resting conditions prefers to oxidize carbohydrate. 2,3,5 The term metabolic inflexibility has been used to refer to a reduced ability of resting skeletal muscle of insulin-resistant obese and type 2 diabetic patients to appropriately select oxidative fuels, in particular, lipid. With dietary caloric oversupply and reduced caloric expenditure, lipid would theoretically accumulate ectopically in muscle and contribute to insulin resistance. 7
As originally applied in the context of insulin-resistant muscle, metabolic flexibility specifically referred to a high resting, postabsorptive rate of carbohydrate oxidation with little if any change brought about by raising plasma insulin concentrations during a glucose clamp experiment. However, it has been less clear if insulin-resistant skeletal muscle appropriately selects oxidative fuels during mild exercise. Although this question has been addressed, 8 –11 those studies all have used whole-body indirect calorimetry to estimate fuel use in working muscle. Since whole-body indirect calorimetry at rest or during mild exercise is composed not only of fuel oxidation in muscle but also in many other tissues, it is unclear how well this method estimates fuel use in working muscle.
However, by calculating the increments in V̇O2 and V̇CO2 during exercise well below the lactate threshold, a “ΔRER” can be calculated. ΔRER theoretically is more representative of fuel oxidation in working muscle. The first purpose of the present study, therefore, was to provide data supporting the validity of this technique for estimating fuel oxidation in working muscle.
To estimate fuel selection in working muscle, volunteers performed three consecutive steady-state periods of cycle ergometry exercise at very low power outputs (15, 30, and 45 watts) that corresponded to ∼10%, 20%, and 30% of maximum power output achieved during a V̇O2 peak test. To provide validating data that this method in fact measures gas exchange in working muscle, we determined (1) blood lactate concentrations during exercise, (2) the kinetics of O2 at onset of exercise, and (3) the O2 cost of work during steady-state exercise (mL per minute, or V̇O2, per watt) and the related mechanical efficiency of cycling. Regarding lactate concentrations, during the periods of mild exercise, increases in blood lactate were small and lactate concentrations were stable during the final 3 min of steady-state exercise, during which ΔRER was calculated.
These measurements verified that the exercise intensities used were very mild and that working muscle likely was obtaining most of the energy required for performing work from oxidative processes. Under such conditions, V̇O2 reaches a rapid steady state and the rise in V̇O2 is monoexponential, reflecting O2 kinetics in muscle undergoing increased energy demand. 12 Regarding this aspect of the protocol, in the present study, during the transition from rest to steady-state exercise at 15 watts, V̇O2 kinetics did follow a classical monoexponential rise that is characteristic of skeletal muscle with time constants of 30–50 sec, which are in the range of time constants typically found either for a rise in V̇O2 at the onset of exercise 12,25 or recovery of phosphocreatine in muscle following exercise determined using 31 P-MRS. 34 –36
It should be noted here that a limitation of the interpretation of these V̇O2 data is that we used gas measurements from a mixing chamber, sampled at about 15 sec intervals, rather than breath-by-breath measurements typical of studies designed specifically to answer questions regarding V̇O2 kinetics, rather than fuel selection, which was the focus of this study. Regardless, the characteristics of V̇O2 kinetics at onset of exercise that we report are quite like the kinetics determined using breath-by-breath measurements (e.g., see Whipp 25 ). With a step increase in the rate of ATP breakdown, as occurs at the onset of exercise, such kinetics occur in creatine-containing tissues capable of transiently buffering ATP utilization with net phosphocreatine breakdown.
Since they coincide with the onset of work here, the only two sources of changes in gas exchange that would have these kinetic characteristics are working skeletal muscle and heart. However, in heart, step increases in workload (cardiac output) take place in the absence of any phosphocreatine breakdown. 37 Moreover, the exercise-induced rise in cardiac V̇O2 at these very low work rates would be expected to be less than 15 mL/min. 38 Regarding the oxygen cost of work, about 12 mL O2 per min per watt estimated here was within expected values, 39 as was mechanical efficiency of about 24%. It should be noted that the oxygen cost of work in the transition from rest to 15 watts was slightly higher than 12 mL O2/min per watt, likely reflecting the additional and unmeasured work contribution of movement of the legs required to pedal.
So overall, work at each steady-state period was probably slightly higher than the measured 15, 30, and 45 watts, but still within the range of very mild work rates. Taken together, these data provide strong evidence that ΔRER estimates the gas exchange, hence the fuel use, of working muscle activated by the mild exercise used here.
The second purpose of the present study was to use ΔRER to determine whether fuel selection of exercising muscle is related to insulin sensitivity. The individuals included here had a wide range of insulin sensitivity, but all were very sedentary, as indicated by a low mean V̇O2peak of only about 24–25 mL O2/Kg. The average V̇O2peak for either men or women with an average age of 31 years would be judged as “very poor.” Even adjusted for fat-free mass, this low value reflects the extremely sedentary nature of these volunteers.
A mixed model linear analysis using power output, insulin-stimulated glucose disposal rates, VO2peak, ANT content, citrate synthase activities, and the time constant of V̇O2 kinetics at the onset of exercise as independent variables predicting RER in working muscle (ΔRER) or fuel oxidation was used to determine which of these most influenced fuel choice during mild exercise. The results of this analysis showed that power output was a strong predictor of fuel choice (as expected), indicating that, across a very mild range of exercise intensity, the percent contribution of carbohydrate to energy production rose, while the relative contribution of lipid fell (P < 0.001). However, insulin-stimulated glucose disposal was not a significant predictor of fuel selection during mild exercise.
Therefore, unlike resting insulin-resistant skeletal muscle exposed to insulin, mild exercise produces changes in fuel oxidation that are independent of insulin sensitivity. There are several earlier studies that addressed the question of metabolic flexibility in exercising muscle. The main finding of the present study, that fuel choice during mild exercise is unaffected by insulin resistance, confirms the findings of Colberg et al. 9 The present studies and those of Colberg et al 9 emphasize that, in comparison to more physically active individuals, 14 carbohydrate is the preferred oxidative substrate during mild exercise. Three other studies found lipid oxidation to be higher in subjects who were likely to be insulin resistant.
The present results indicate whole-body RER overestimates skeletal muscle fat oxidation compared to ΔRER in exercising skeletal muscle from sedentary individuals. The overestimation of lipid oxidation that using whole-body indirect calorimetry causes, which we described, likely influenced the results of those studies and at least in sedentary people partially explains these discrepancies. The extent of overestimation of lipid oxidation in those studies in sedentary people is unknown, but the conclusions drawn from those studies should be reexamined considering the present data. Neither ANT1 content nor acetylation was significant predictors of muscle fuel selection. Likely, any effects of acetylation at lysine 23 (average of about 10% of total ANT1 protein) were too low to see any effects, given that it implies 90% of ANT1 was functionally active, as acetylation functionally inactivates ANT1 at physiological ADP concentrations. 40
Citrate synthase activity, however, which is widely accepted as a measure of mitochondrial content, was a significant predictor of fuel choice. Volunteers with higher mitochondrial content, as evidenced by higher citrate synthase activity, had higher fat oxidation during mild exercise, as would be expected. Given the highly sedentary nature of this group, it is unlikely that the relative contributions of carbohydrate and lipid to oxidative metabolism in muscle were at all “normal” during the mild exercise used here. The present findings stand in contrast to the findings of Willis et al 14 in healthy, active individual and those of Romijn et al 41 who examined the effects of exercise intensity in endurance-trained women and showed that at mild to even moderate exercise intensities, highly trained people have much lower whole-body RER than the participants in the current study or others cited above.
These results demonstrate another important finding, namely that very sedentary people with very low aerobic capacity (VO2peak), even in the absence of disease or insulin resistance, depend primarily upon carbohydrate as the main energy source during exercise that is equivalent to mild walking, compared with younger, more active individuals who continue to oxidize lipid. 14 This implies that when mild walking exercise is recommended to sedentary people, their perception of effort and the difficulty with which they sustain walking exercise may be such that such exercise recommendations may serve to discourage people from physical activity.
Conclusions
Taken together, the results of this study show that it is possible to measure fuel selection in skeletal muscle working at low, aerobic rates simply by subtracting resting V̇O2 and V̇CO2 values from those obtained during exercise and calculating a ΔRER. Skeletal muscle in very sedentary individuals prefers to oxidize carbohydrate relative to healthy, fit individuals reported in the literature, and this was unrelated to insulin sensitivity within the sedentary group. This preference for carbohydrate is consistent with lower activity of citrate synthase, a surrogate for mitochondrial content, being a predictor of carbohydrate oxidation. Further studies using the ΔRER method in healthy, fit individuals are required to better understand this phenomenon.
Footnotes
Acknowledgment
The authors thank Jean Finlayson for expert technical assistance, Judy Krentzel and Alma Leon for nursing assistance, and the volunteers.
Authors' Contribution
N.B.: Investigation, Formal Analysis, and Writing – Original Draft; R.Z B.: Investigation, Formal Analysis, and Writing – Review and Editing; D.K.C.: Investigation and Writing – Review and Editing; P.R.L.: Investigation and Writing – Review and Editing; L.N.K.: Formal Analysis; M.L.: Investigation; J.L.F.: Investigation and Writing – Review and Editing; W.T.W.: Conceptualization, Methodology Writing – Original Draft, and Supervision; L.J.M.: Conceptualization, Methodology Writing – Original Draft, Data Curation, Supervision, and Funding Acquisition.
Author Disclosure Statement
The authors declare no conflicts of interest.
Funding Information
This study was supported by NIH grant R01DK047936 (LJM) and the Center for Disparities in Diabetes, Obesity, and Metabolism, University of Arizona Health Sciences.