
Abstract
Objectives:
Various diseases are associated with obesity and metabolism. We sought to investigate the risk of cardiovascular disease (CVD) in diverse metabolic obesity phenotypes.
Methods and Results:
A prospective observational study of 1517 participants ≥25 years of age without CVD at baseline was conducted. Participants were categorized into four groups based on the condition of central obesity and metabolic health status: metabolically healthy normal weight, metabolically healthy obesity (MHO), metabolically unhealthy normal weight, and metabolically unhealthy obese (MUO). A multivariate Cox regression analysis was used to analyze the relationship between different obesity phenotypes and CVD. During 14830.49 person-years of follow-up, there were 244 incident cases of CVD. Of the 1517 participants, 72 (4.75%) and 812 (53.53%) were classified as having MHO and MUO, respectively. MHO and MUO had a tendency toward a higher risk of CVD [adjusted hazard ratios (HRs) = 1.49, 95% confidence interval (CI): 1.11–2.02 and HR = 1.25, 95% CI: 1.00–1.55, respectively] based on the waist circumference criterion.
Conclusion:
MHO and MUO can increase the risk of CVD.
Introduction
In recent years, the prevalence of obesity has increased dramatically worldwide and statistics show that 39%–49% of the global population (2.8–3.5 billion people) is overweight or obese. 1 In 2015 alone, ∼4 million people died due to obesity-related diseases, of which over two-thirds were caused by cardiovascular disease (CVD). 2 Obesity directly contributes to incident cardiovascular risk factors, including dyslipidemia, type 2 diabetes, hypertension, and sleep disorders. 3 Metabolic syndrome (MetS) is a group of clinical syndromes that are characterized by obesity, hyperglycemia (diabetes or impaired glucose regulation), dyslipidemia hypertriglyceridemia and/or low-density lipoprotein cholesterol (LDL-C), and hypertension, which seriously affect patient health. These factors directly promote the occurrence of atherosclerotic CVD and increase the risk of type 2 diabetes mellitus (T2DM). Therefore, the risk of CVD and T2DM increases significantly in MetS patients compared with those without MetS. 4
A previous study demonstrated that most of the CVD risk associated with a high body mass index (BMI) or an elevated waist circumference (WC) was mediated by altered intermediate risk factors (e.g., smoking, atherogenic dyslipidemia, hypertension, and diabetes mellitus). 5 Therefore, obesity is a prevalent factor that alters metabolic and cardiovascular risk factors and can be treated with pharmacotherapies; however, obesity can also be affected by lifestyle changes. Although several studies have reported a progressive increase in CVD risk associated with higher BMI values, 6 cardiovascular therapy remains controversial. Obesity may be associated with improved survival in patients with established CVD; this finding is termed the “obesity paradox.” 7,8 A possible explanation for this paradox is that BMI, rather than body fat distribution, is used to measure obesity rather than body fat. Besides, younger cardiovascular patients are generally healthier and more likely to have fewer comorbidities. 9 –11
Evidence has shown that more than 20% of obese people have a normal metabolism, which is termed metabolically healthy obesity (MHO), 12 –14 and about 10%–25% of people with normal body mass suffer from MetS, which is called metabolically obese normal weight. 5,15,16
Currently, very few prospective cohort studies have explored the association between healthy obesity phenotype and CVD in China. To better understand the role of obesity as a risk factor for CVD with major public health relevance, incident CVD was assessed in different metabolic phenotype conditions over a 10-year follow-up period, based on the WC criterion for obesity combined with different metabolic conditions.
Methods
Study design and participants
This was a prospective cohort study carried out in selected rural communities in northwest China. In each county, two villages were selected through stratified cluster sampling. Pregnant or breastfeeding women and patients with diseases such as coronary heart disease, diabetes, severe mental illness, infectious diseases, autoimmune diseases, and tumors were excluded. Residents 25 years of age or older were recruited in Pingluo County and Qingtongxia City of Ningxia province of northwest China from 2008 to 2012, and a longitudinal follow-up survey was performed based on the initial subjects from 2019 to 2020. A total of 2209 individuals completed the questionnaire interview, physical examination, and biological specimen collection in the cross-sectional survey, and a follow-up was conducted from 2019 to 2020. A total of 1655 subjects completed follow-up, of which 1517 completed questionnaire survey, body measurement, and biological sample collection, and 138 died. Therefore, 1517 participants were included in the final analysis (Fig. 1).
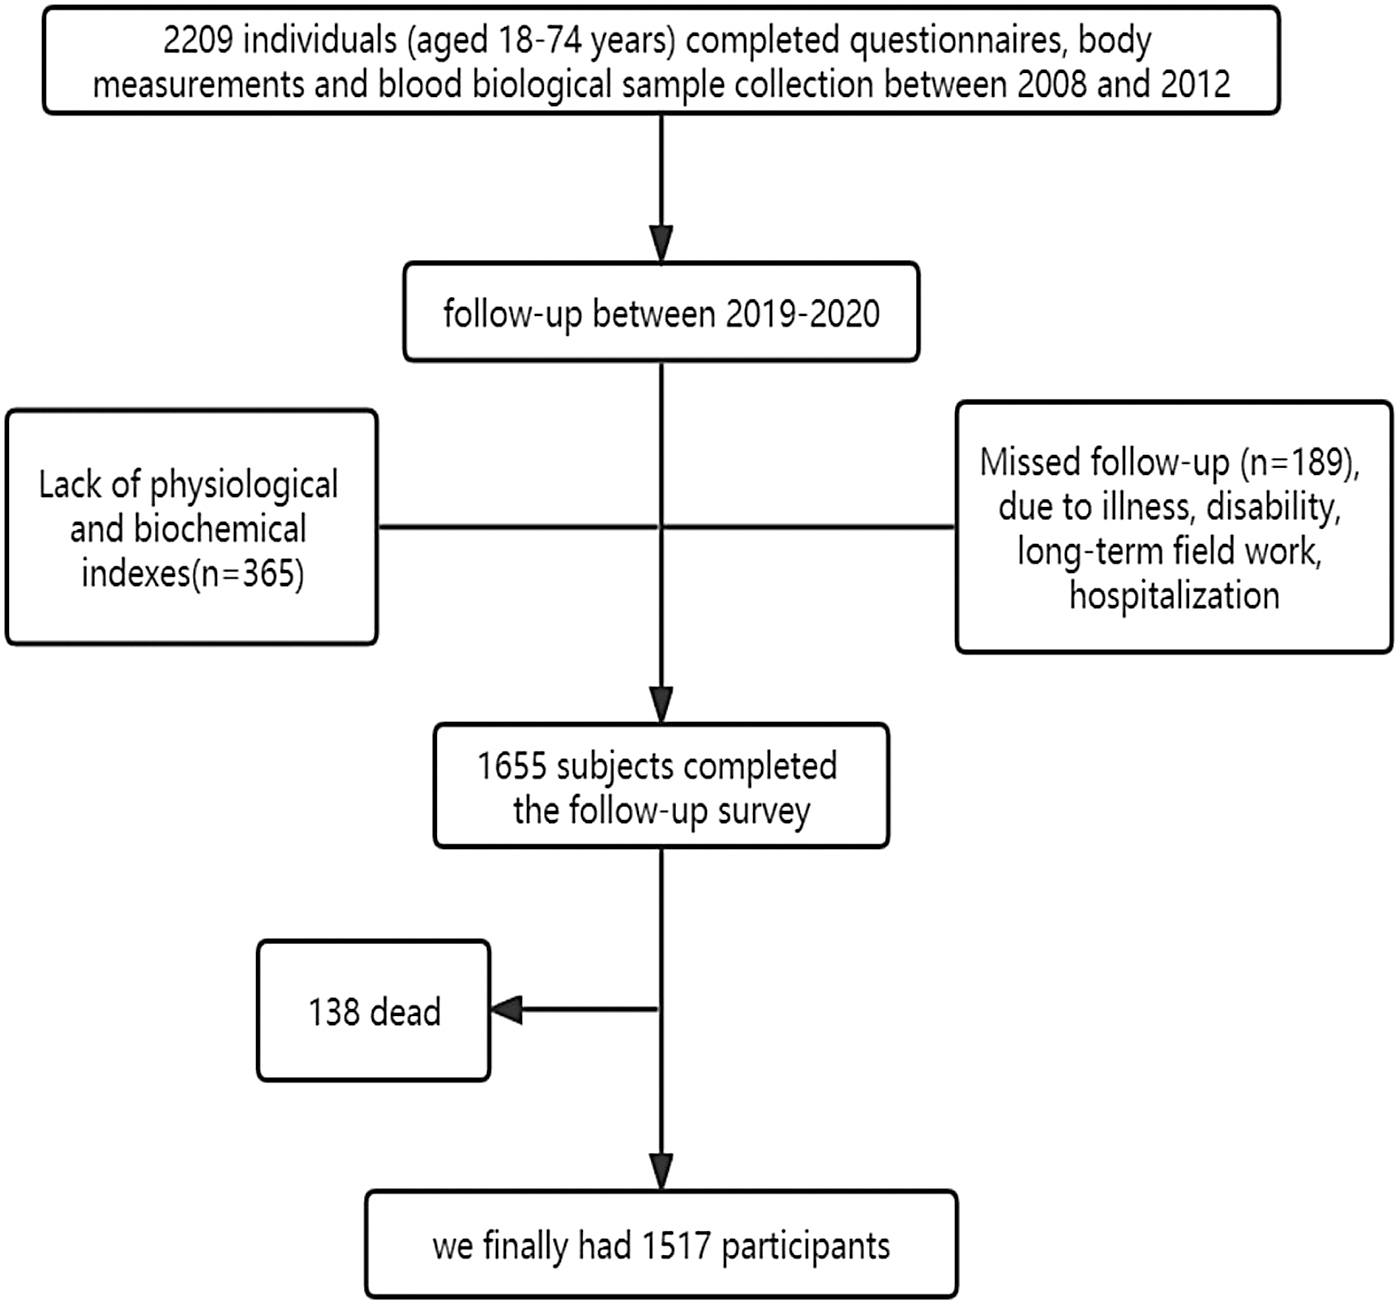
Study flow chart.
In-person interviews were conducted by well-trained investigators to obtain information on socioeconomic characteristics, including demographics (age, gender, educational attainment, and marital status), lifestyle behaviors (smoking, tea and alcohol drinking status, and physical exercise), and history of diseases.
Anthropometric measurements included height, weight, blood pressure (BP), WC, and hip circumference (HC). Height and body weight were measured in light indoor clothing without shoes. Brachial BP was measured after a 5-min rest with an automated BP monitor. BMI was calculated as follows: BMI = Weight (kg)/Height (m) 2 . WC and HC were, respectively, measured using multifrequency bioelectric impedance analysis (BIA, InBody370 system, XYZ). Blood samples were obtained in the morning after 8 hr of fasting. In the morning, physicians collected 5 mL of peripheral venous blood from participants into a nonanticoagulant tube and 2 mL into an EDTA-anticoagulant tube. Fasting plasma glucose (FPG) at baseline was detected using a OneTouch Ultra2 (Life Scan). Serum insulin at baseline was measured using the enzyme-linked immune chemiluminescence method.
Total cholesterol (TC), triglyceride (TG), and high-density lipoprotein cholesterol (HDL-C) at baseline were determined using the enzymatic method (CHOD-PAP, Roche Diagnostics GmbH), and LDL-C was calculated using the Friedewald formula. During the follow-up survey, TC, TG, HDL-C, LDL-C, and FPG levels were measured using biochemical autoanalyzers (Mindray BS-430, Shenzhen, China). Fasting insulin (FINS) concentration was measured using a chemiluminescence immunoassay analyzer (Mindray CL-2000i, Shenzhen, China).
17
The homeostatic model assessment (HOMA) index was calculated to assess insulin resistance (IR) and β cell function from FPG and FINS concentrations. These indices were calculated using the following formula:
This research was approved by the Ethics Review Board of Ningxia Medical University. Written informed consent was obtained from the participants after explaining the study objectives and methods.
Definition of obesity and metabolic health status
Whether to drink alcohol referred to the consumption of alcohol ≥1 time per week for ≥6 months. Tea drinking referred to the consumption of one cup of tea per week for at least 6 months. Whether to have a strong physical activity was defined as exercising at least three times weekly for at least 30 min each time.
MetS was defined as using Diagnostic criteria for MetS based on the most updated China Diabetes Society (CDS) criteria. Participants had to meet any one or more of the following three factors: (1) FPG ≥6.1 mM or 2-hr plasma glucose levels ≥7.8 mM after a 75-gram oral glucose tolerance test or have been diagnosed with diabetes; (2) BP ≥130/85 mmHg or have been diagnosed with hypertension; and (3) TG ≥1.7 mM or HDL-C < 1.04 mM. Central obesity was classified as WC ≥90 cm for males and ≥85 cm for females. 18
Participants were categorized into four groups based on the condition of central obesity and metabolic health status: metabolically healthy normal weight (MHNW), MHO, metabolically unhealthy normal weight (MUNW), and metabolically unhealthy obese (MUO). CVD was based on self-reported physician diagnosis of heart diseases and stroke. 19
Statistical analysis
Continuous variables were represented as mean ± standard deviation
We developed four multivariate models: model 1 was without adjustment, model 2 was adjusted for sex and age; model 3 was adjusted for sex, age, education level, marital status, smoking status, alcohol drinking status, tea-drinking status, physical exercise; and model 4 was adjusted for model 3 plus WC, HC, systolic BP, diastolic BP, TC, TG, HDL-C, LDL-C, and HOMA-β. Statistical analysis was performed using STATA 16.0 software (Stata Corp LLC, Texas).
Results
This cohort was conducted from baseline to follow-up. A total of 2209 subjects were followed up, with a final follow-up of 1655 individuals. Due to loss of follow-up, the follow-up group and the loss to follow-up group were compared (Supplementary Table S1). It was found that age, gender, education level, marital status, alcohol drinking, physical exercise, history of chronic patients, and LDL-C differed between the follow-up group and the loss to follow-up group, whereas the other variables showed no difference between the two groups.
A total of 1517 participants were followed up with a complete baseline survey and follow-up data, with an average follow-up time of 9.78 years and a follow-up rate of 74.92%. According to the baseline survey, the mean age of the participants was 48.49 ± 0.28 years, and 59.39% of the participants were female. Participants' baseline characteristics were recorded based on their metabolic obesity phenotype (Table 1). Under the WC criterion, the prevalence of MUO was 27.88%. Sex, smoking status, marital status, alcohol drinking status, tea-drinking status, and physical exercising status were not significant effect modifiers under the WC standard. However, sex had a significant effect on different metabolic conditions. The portion of different obesity metabolic phenotypes at baseline and follow-up and changes in baseline versus follow-up metabolic phenotypes were not statistically significant (Table 2, and Supplementary Fig. S1). There was a trend toward a shift from MHNW and MHO groups to MUNW and MUO groups over time (Fig. 2). Based on the WC criterion, the prevalence of MHO was 18.06% (Table 3).
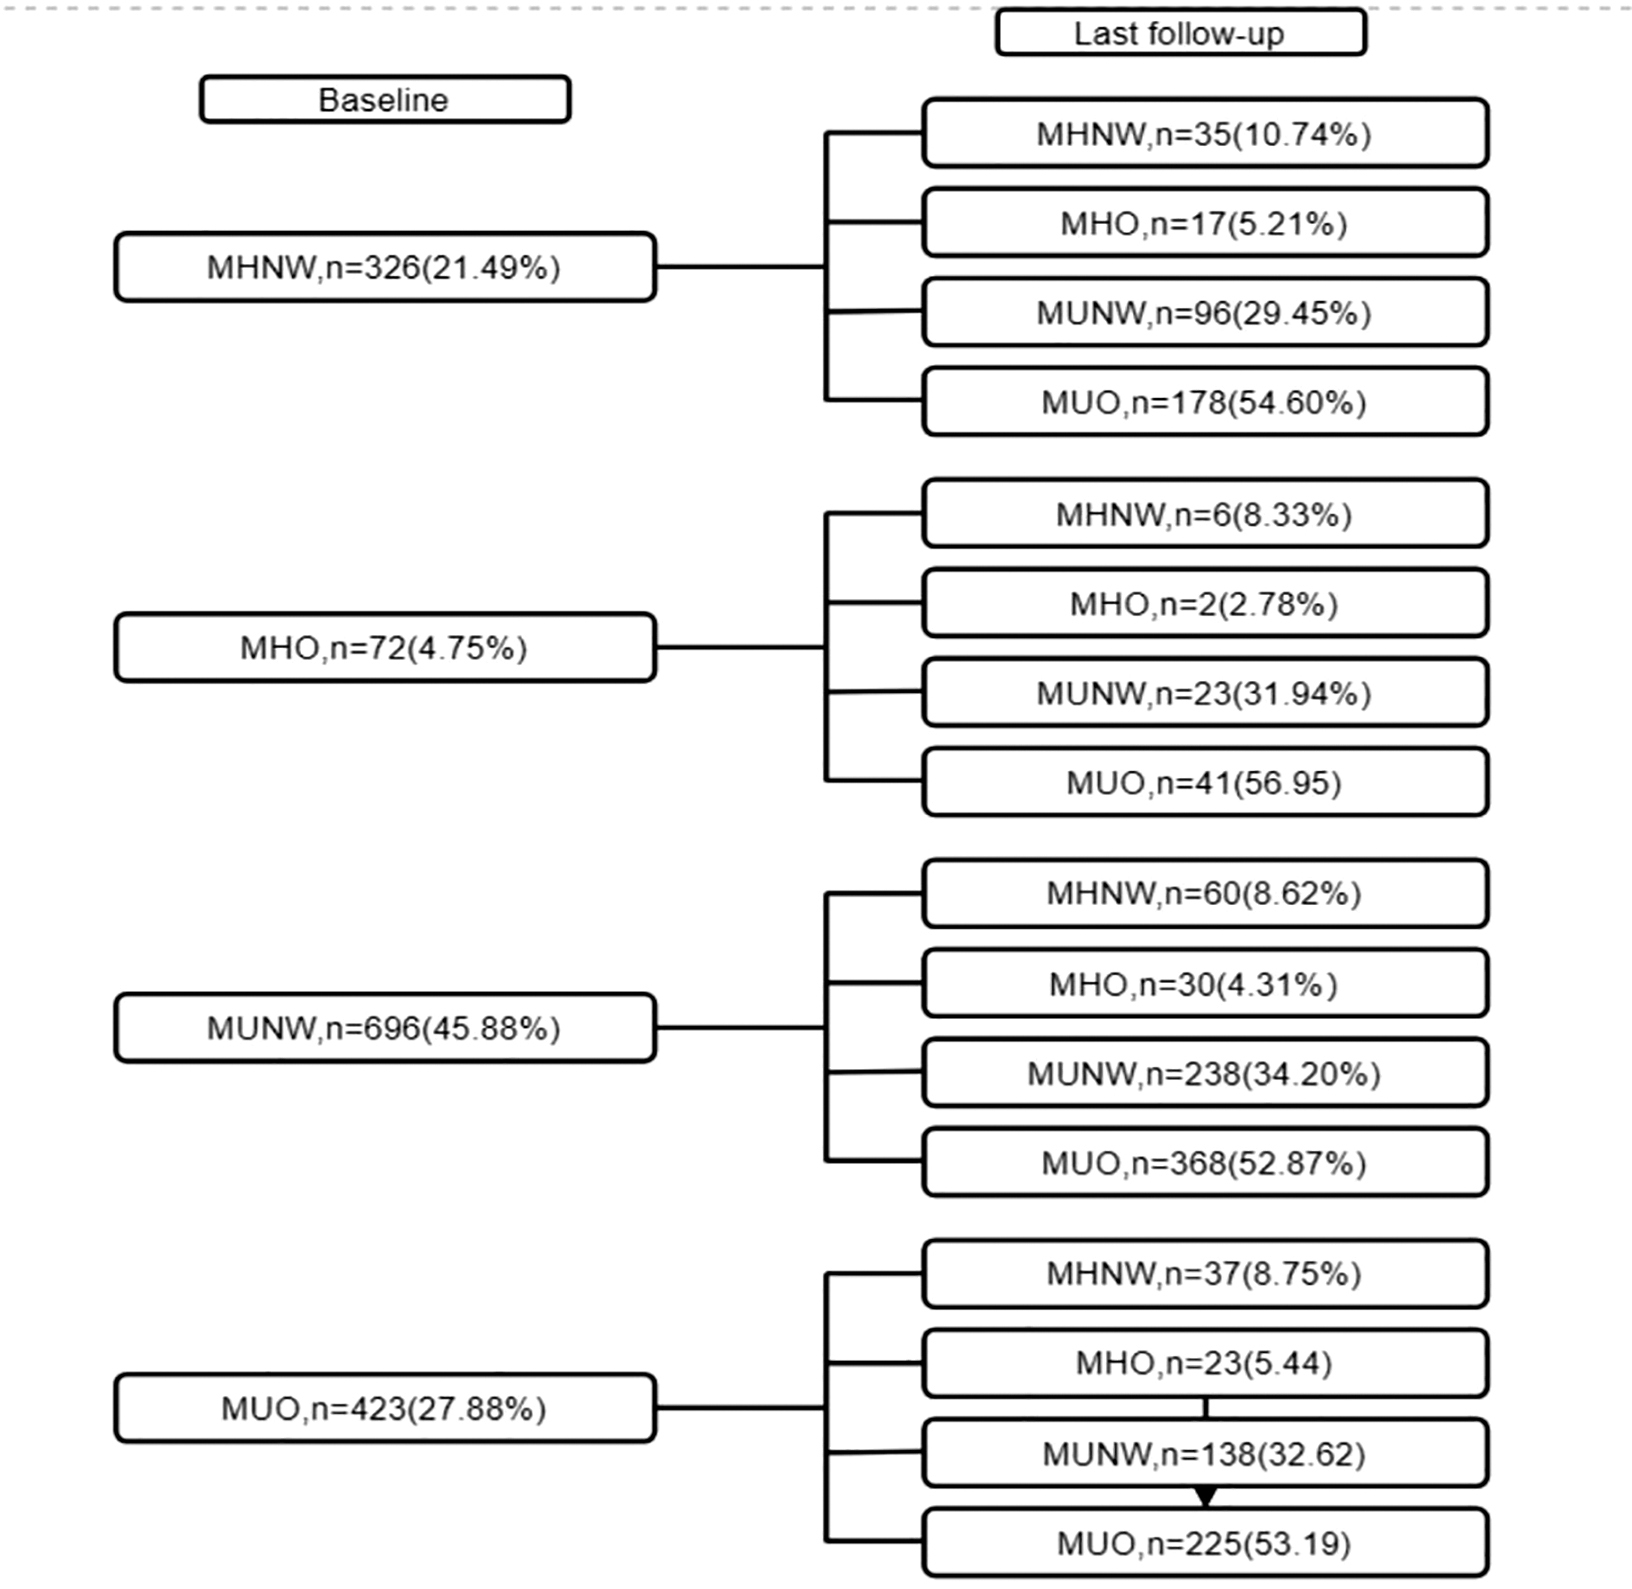
Transition of Metabolic Obesity Phenotypes from baseline to the follow-up. MHNW, metabolically healthy normal weight; MHO, metabolically healthy obesity; MUNW, metabolically unhealthy normal weight; MUO, metabolically unhealthy obese.
Baseline Characteristics of Participants in Different Metabolic Obesity Phenotypes
Values are presented as mean ± SD or number (%). P value obtained in the ANOVA or the chi-squared test.
ANOVA, analysis of variance; BMI, body mass index; DBP, diastolic blood pressure; FINS, fasting insulin; FPG, fasting blood-glucose; HC, hip circumstance; HDL-C, high-density lipoprotein cholesterol; LDL-C, low-density lipoprotein cholesterol; HOMA-IR, homeostatic model assessment of insulin resistance; HOMA-β, homeostatic model assessment of β cell function; MHNW, metabolically healthy normal weight; MHO, metabolically healthy obesity; MUNW, metabolically unhealthy normal weight; MUO, metabolically unhealthy obese; SBP, systolic blood pressure; SD, standard deviation; TC, total cholesterol; TG, triglyceride; WC, waist circumference.
Percentage Change in Metabolic Obesity Phenotypes Between Baseline and Follow-Up
P value obtained in the chi-squared test.
Incidence Rate of Cardiovascular Diseases and Adjusted Hazard Ratios for Cardiovascular Diseases by Metabolic Obesity Phenotypes at Baseline
Model 1: without adjusted; Model 2: adjusted for sex, age; Model 3: adjusted for Model 2 plus education level, marital status, smoking status, alcohol drinking status, tea drinking status, physical exercise; Model 4: adjusted for Model 3 plus BMI, HC, SBP, DBP, TC, TG, HDL-C, LDL-C, HOMA-β.
HR, hazard ratio.
There were 244 incident cases of CVD over 14830.49 person-years of follow-up [acute myocardial infarction (37 cases), angina pectoris (45 cases), other ischemic heart diseases (115 cases), and other types of minor stroke attacks, including cerebral infarction and cerebral hemorrhage (47 cases)]. The association between different forms of metabolic obesity and CVD risk was evaluated. Both MHO and MUO groups had a trend toward a higher CVD risk (adjusted HR = 1.49, 95% CI: 1.11–2.02 and adjusted HR = 1.25, 95% CI: 1.00–1.55, respectively) based on the WC criterion (Table 3).
After adjusting the model, lifestyle factors (including alcohol drinking, smoking, tea drinking, and physical exercising), gender, and age were not significant influencing factors. Based on the WC criterion, the MHO group had a higher risk of CVD (Table 3). As shown in Fig. 3, the 95% CI lines of MHO and MUO groups did not intersect with the invalid vertical line, and both were on the right of the invalid line, which was considered a risk factor for CVD and was statistically significant.

Incidence rate of CVDs and adjusted HRs for CVDs by Metabolic Obesity Phenotypes at baseline. Model 1: without adjusted; Model 2: adjusted for sex, age; Model 3: adjusted for Model 2 plus education level, marital status, smoking status, alcohol drinking status, tea drinking status, physical exercise; Model 4: adjusted for Model 3 plus BMI, HC, SBP, DBP, TC, TG, HDL-C, LDL-C, HOMA-β. BMI, body mass index; CVD, cardiovascular disease; DBP, diastolic blood pressure; FPG, fasting blood-glucose; FINS, fasting insulin; HC, hip circumstance; HDL-C, high-density lipoprotein cholesterol; HOMA-IR, homeostatic model assessment of insulin resistance; HOMA-β, homeostatic model assessment of β cell function; HR, hazard ratio; LDL-C, low-density lipoprotein cholesterol; SBP, systolic blood pressure; TC, total cholesterol; TG, triglyceride; WC, waist circumference.
Discussion
The present study investigated the combined effects of obesity and metabolic status on the occurrence of CVD with a mean follow-up time of 9.78 years. In this survey, the rate of lost follow-up was 8.56%. The main reason were the migration of the residential address and migrant workers. A comparative analysis of the baseline characteristics of the subjects between lost follow-up and the follow-up group found: among the variables determining the obesity phenotype, only LDL-C differed between two groups, and the difference between the other variables was not statistically significant. The results show that the missing data of people lost to follow-up will not affect the accuracy of this study, which is basically consistent with the real results. The findings showed that MHO and MUO were risk factors for CVD outcomes compared with MHNW, and the risk was higher and statistically significant.
Previous studies reported that MHO was not a risk factor for the occurrence of CVD, could not increase the risk of CVD, and was considered a benign disease, 20 –22 which is not consistent with our results. However, recent studies documented that different metabolic obesity phenotypes have different effects on the occurrence of CVD, 23,24 which corresponds with our conclusion. It is well known that the risk of CVD is associated with metabolic abnormalities, and there may be inflammation. Obesity can lead to the activation of a variety of immune cells, which leads to the occurrence of inflammation, thereby triggering changes in type 2 diabetes and CVD and related MetS.
In a cross-sectional survey, Liu et al. combined BMI and body fat mass ratios with metabolic status to define metabolic phenotypes, and the results showed that compared with the metabolically healthy nonobese phenotype, BMI-defined metabolically unhealthy nonobesity and MUO phenotypes had a higher risk of CVD (odds ratio, OR = 2.34, 95% CI: 1.89–2.89 and OR = 3.45, 95% CI: 2.50–4.75, respectively). 25 In the present study, the risk of CVD in MUNW and MUO phenotypes were also observed (HR = 0.99, 95% CI: 0.84–1.17 and HR = 1.25, 95% CI: 1.00–1.55, respectively). However, there are several possible explanations for the lower effect estimates. First, the follow-up interval was too long, thus both the influencing factors and the outcome were a dynamic change process. Second, the average age of the study population was 48.49 ± 0.28 years, which has not yet reached the age of high incidence of disease and may bias the results. Finally, the sample size was small, which limited the accuracy of these results.
Some studies have suggested that MHO may have a microinflammatory state, but it has not yet reached the level of obese patients with MetS. It can be considered that MHO is in an intermediate state of normal and obesity with MetS. 26 Previous studies have investigated whether MHO increases the risk of CVD. Itohetal found that MHO alone did not significantly increase the risk of CVD, 27 which is consistent with the study of Hosseinpanah et al. that CVD risk did not increase in the persistent MHO phenotype over a 15.9-year follow-up in both sexes. 25 A different study found that metabolically unhealthy phenotypes had a higher CVD risk, while the MHO phenotype had a slightly protective effect (b = −2.25, P < 0.001) when WC was used as the measure of obesity. 28 Although several studies have explored the association between metabolic obesity phenotype and the risk of CVD, the results are inconsistent. 29 –32 A possible reason for the discrepancy in the results may be the variation in the definition standards of obesity.
Although the judgment standards for defining different obesity phenotypes have not been unified at present, 33 BMI is often used as the judgment standard of obesity; however, BMI is affected by age and race and cannot reflect the distribution of fat, which may distort the risk of CVD. 34 Central obesity criteria were used in this study, and central obesity was classified as WC ≥90 cm for males and ≥85 cm for females. 35 Central obesity can better reflect the distribution of fat compared with BMI.
The present study revealed that MHO groups had higher point estimates of CVD than MUO groups, which shows a possibility that a metabolically unhealthy phenotype is at lower risk of CVD than a metabolically healthy phenotype. However, this conclusion should be interpreted cautiously as it is based on very small sample size, with less occurrence of outcome events. Moreover, although the risk between different obesity phenotypes and CVD was determined, the causal relationship is still uncertain, which may be due to the limited sample size and a limited number of outcome events. Therefore, future studies should recruit larger and more representative populations and collect more detailed data, such as medical history, family history, etc., which may be related to the occurrence of outcome events. Results obtained in this study provide a theoretical foundation for the prevention of CVD and the development of therapeutic interventions.
Strengths and limitations of this study
This study combined obesity and metabolism to assess the risk of CVD in rural Chinese populations, confirming that MHO and MUO people present a higher risk of CVD than MHNW, implying that the health problems of CVD cannot be ignored even in economically underdeveloped rural areas. The limitations of this study are the small sample size and the large time span of cohort follow-up.
Conclusion
In summary, the current study found that MHO and MUO are risk factors for the occurrence of CVD, with a trend toward increased risk of CVD.
Footnotes
Acknowledgments
The authors thank all the participants and all the staff working for the China Northwest Natural Population Cohort: Ningxia Project (CNC-NX).
Authors' Contributions
Y.Z. and Y.Z. designed the study and drafted the outline. C.Y., J.L. helped supervise the field activities and collected the data. X.L., C.Y. conducted the laboratory work. X.L., C.Y. and Y.D. organized and analyzed the data. X.L., C.Y. and Z.C. wrote the original draft, and reviewed and edited the article. Y.Z. and Y.Z. critically reviewed and revised the article. All authors read and approved the final version to be published.
Ethics Approval and Consent to Participate
This study was approved by the Ethics Review Board of Ningxia Medical University (Ethics ID 2018-012). Signed informed consent was obtained from all participants before the study began.
Author Disclosure Statement
No conflicting financial interests exist.
Funding Information
The study was supported by the National Natural Science Foundation of China (81860603), the National key R & D program of China (2017YFC0907204), and the Natural Science Foundation of Ningxia Hui Autonomous Region (2021AAC03167). The funders did not involve in study design, data collection, data analysis, data interpretation, or writing of this article.
Supplementary Material
Supplementary Table S1
Supplementary Figure S1
References
Supplementary Material
Please find the following supplemental material available below.
For Open Access articles published under a Creative Commons License, all supplemental material carries the same license as the article it is associated with.
For non-Open Access articles published, all supplemental material carries a non-exclusive license, and permission requests for re-use of supplemental material or any part of supplemental material shall be sent directly to the copyright owner as specified in the copyright notice associated with the article.