




Abstract
Background:
It has been well established that high-sensitivity C-reactive protein (hs-CRP) is strongly associated with obesity, insulin resistance, high blood pressure, and dyslipidemia. However, the effects of different lipid parameters on hs-CRP levels are less deliberated. The purpose of the study was to compare the relative contribution of triglycerides (TGs), low-density lipoprotein cholesterol (LDL-C), and high-density lipoprotein cholesterol (HDL-C) to the levels of hs-CRP.
Methods:
Three hundred seventy-eight subjects without known history of diabetes were recruited for the study. No concomitant antilipid or antidiabetes agents were allowed. Each subject received anthropometric measurements, fasting sampling for lipid profile and hs-CRP, and a 75-gram oral glucose tolerance test for the measurements of insulin resistance (surrogated by insulin sensitivity index ISI0,120).
Results:
Levels of hs-CRP levels were positively correlated with Log (TG) and negatively correlated with HDL-C in partial correlation after adjustments for confounding variables, but not with LDL-C. The hs-CRP levels in the three groups by tertiles of LDL-C were similar. Subsequently, we found that body mass index (first step), Log (ISI0,120) (second step), and Log (TG) (third step) independently predicted the variance of Log (hs-CRP) in stepwise multiple regression. However, both HDL-C and LDL-C failed to be entered into the models to explain Log (hs-CRP).
Conclusions:
Our data demonstrated that Log (TG) was a major lipid determinant of hs-CRP levels. The contribution of LDL-C to the levels of hs-CRP might be insignificant.
Introduction
Over the past two decades, the knowledge about atherosclerosis has greatly expanded, with inflammation now recognized as the contributing factor in culmination of atherogenesis. Inflammation process is evaluated clinically by measuring circulatory inflammatory indices, like cytokines, chemokines, and acute-phase reactants. Among them, C-reactive protein (CRP) is the most widely extrapolated inflammatory marker that has been implicated in the pathogenesis of cardiovascular events.
CRP is a 115 kDa pentameric protein that is synthesized by the hepatocytes in response to interleukin 6 (IL-6), IL-1, tumor necrosis factor-alpha and other cytokines. 1 –4 Its levels remain stable for a longer period with a half-life of ∼19 hr and no diurnal variation. 5 The development of high-sensitivity C-reactive protein (hs-CRP) assay has lower detection limits and has shown an association with obesity, dyslipidemia, hyperglycemia, insulin resistance, high blood pressure (BP), and cardiovascular disease. 1,5
The renowned landmark trial, JUPITER, has shed light on the primary prevention of cardiovascular disease. In this prospective, double-blind, placebo-controlled randomized clinical trial, statin treatment was significantly associated with reduction in CRP and low-density lipoprotein cholesterol (LDL-C) by 37% and 50%, respectively, with a compelling reduction of 44% incident cardiovascular events and 20% all-cause mortality. The result is consistent with previous studies identifying CRP as a stronger predictor of cardiovascular events when compared with the LDL-C. 6
It is well established that hs-CRP and dyslipidemia play a pivotal role in the pathogenesis of atherosclerosis. 7 Emerging evidence demonstrated that hs-CRP levels revealed positive correlation between triglycerides (TGs) and TG-to-high-density lipoprotein cholesterol (HDL-C) ratio, which is consistent in both nondiabetic and diabetic patients. 8 –10 It was suggested that this unfavorable lipid profile may promote foam cells formation in the arterial wall, and consequently increasing the inflammatory activity. 11
However, the individual effects of different lipid parameters on hs-CRP levels are less deliberated. Therefore, this study aims to examine the relative contribution of TG, LDL-C, and HDL-C to the levels of hs-CRP in nondiabetic subjects.
Materials and Methods
Subjects
This study is part of the the
We included subjects who were 20–78 years old, without known history of diabetes mellitus or thyroid disease. None of the subjects had acute illness in the past 6 months before the enrollment. We excluded subjects with fasting plasma glucose (PG) ≥126 mg/dL or fasting TGs ≥450 mg/dL. No concomitant lipid-lowering medications, glucose-modification drugs, and hormone replacement were allowed in the study. In total, 277 women and 101 men were included in the analysis.
Clinical examination
Anthropometric measurements were obtained at 8 a.m. after 8–10 hr overnight fast. Body weight (BW) was recorded to the nearest 0.1 kg. Body height (BH) was also recorded to the nearest millimeter. Body mass index (BMI) was calculated by dividing BW divided by BH (kg/m2). BP measurements were obtained by using an automated oscillometric BP recorder (Dinamap 1864SX; Critikon, Tampa, FL). 15 Blood samples were collected at fasting state for the measurements of PG, insulin, serum lipids, biochemistry, and hs-CRP. Participants were instructed to drink 75 gram glucose monohydrate (in 300 mL water) over 5 min. PG and insulin were obtained 120 min after glucose loading. Blood samples were immediately centrifuged and were stored at −20°C before processing of assays. Study participants were interviewed regarding demographic characteristics, lifestyle information, and medical history during the OGTT. 14
Measurements and calculations
PG was measured in a glucose analyzer (model 2300; YSI, Yellow Springs, OH) using glucose oxidase method. Plasma insulin was measured by automated Chemiluminescence System (ADVIA Centaur Immunoassay System; Siemens Healthcare Diagnostics, Deerfield, IL). Serum lipids and biochemistry were analyzed in an automatic blood chemistry analyzer (Roche-Hitachi 747, Roche Diagnostics, Basel, Switzerland) using commercial assay kits (Boehringer Mannheim GmbH, Mannheim, Germany). Serum HDL-C was assessed by using polyethylene glycol-modified enzymatic cholesterol assay after dextran sulfate precipitation. The coefficient of variation of total cholesterol (TC), TGs, and HDL-C assays were 3.8%, 3.5%, and 2.4%, respectively. The LDL-C levels were derived using the Friedewald equation. The concentrations of hs-CRP were determined using a high-sensitivity assay (turbidity immune assay, Toshiba, Tokyo) with a detection limit of 0.01 mg/dL.
We used homeostasis model assessment for insulin resistance (HOMA-IR) from Matthews et al. 16 and the insulin sensitivity index ISI0,120 reported by Gutt et al. 17 as surrogate measures of insulin sensitivity. Insulin secretion was estimated by using homeostasis model assessment of β-cell function (HOMA-β) and insulinogenic index (ΔI30/ΔG30). 16,18 Physical inactivity score was determined by using the following formula: (hours of sedentary activity)/(24 hr–hours of basal activity). 14
Statistical analysis
Data with normal distribution are presented as mean ± standard deviation. Skewed distribution of ALT, hs-CRP, fasting TG, fasting and 2 hr insulin, HOMA-IR, ISI0,120, HOMA-β, and ΔI30/ΔG30 were applied with logarithmic transformation (Log) to subordinate the skewness of these values. The area under curve of OGTT was determined using Tai's mathematical model. 19
The distribution of hs-CRP levels in the groups by tertiles of LDL-C, HDL-C, and TG were presented as geometric means with 95% confidence intervals, and the between-group differences were compared using one-way analysis of variance (ANOVA) with Duncan's post hoc test. Partial correlation was used to analyze the correlations of hs-CRP with different lipid variables in all study subjects adjusting for the confounding variables. Stepwise multiple regression analyses were implemented to examine the independent correlated factors of hs-CRP. Log (hs-CRP) was used as dependent variable, and sex, age, BMI, physical inactivity scores, systolic BP, diastolic BP, Log ALT, LDL-C, HDL-C, fasting PG, 2 hr PG, Log TG, and surrogate estimates of insulin sensitivity were entered into the stepwise regression models as independent variables.
The P-values of entry were ≤0.05 and the P-values of exist were ≥0.10 in the stepwise selection. All statistical analyses were performed with the SPSS program (Version 11.0; SPSS, Inc., Chicago, IL). A P value <0.05 defined statistical significance.
Result
Baseline characteristics of all 378 studied participants are shown in Table 1. Our study included 277 females and 101 males with a mean age of 54.6 ± 11.1 years. The mean BMI was 25.3 ± 3.9. The mean systolic and diastolic BP were 127 ± 21 mmHg and 72 ± 11 mmHg, respectively. The averages of lipid variables were 204 ± 35 mg/dL, 121 ± 31 mg/dL, 56 ± 15 mg/dL, and 132 ± 72 mg/dL, respectively for TC, LDL-C, HDL-C, and TG.
Descriptive Characteristics of the Study Participants
Data are expressed as mean ± SD. The ranges of TG, ISI0,120, and hs-CRP are also presented in parentheses.
2 h PG, 2 hr postloading plasma glucose; ALT, alanine aminotransferase; BH, body height; BMI, body mass index; BP, blood pressure; BW, body weight; HDL-C, high-density lipoprotein cholesterol; hs-CRP, high-sensitivity C-reactive protein; ISI0,120, insulin sensitivity index0, 120; LDL-C, low-density lipoprotein cholesterol; Log (hs-CRP), log transformation of hs-CRP; Log (ISI0,120), log transformation of ISI0,120; Log ALT, log transformation of ALT; Log TG, log transformation of fasting TG; PG, plasma glucose; SD, standard deviation; TC, total cholesterol; TG, triglyceride.
The distribution of hs-CRP was categorized according to different lipid parameters (Fig. 1). Positive correlation was observed between hs-CRP levels and TG levels, with higher hs-CRP levels demonstrated at higher levels of TGs (Fig. 1A). Conversely, the concentration of hs-CRP level decreased with increasing HDL-C level (Fig. 1B). There was no significant difference in hs-CRP levels among the different tertiles of LDL-C (Fig. 1C).
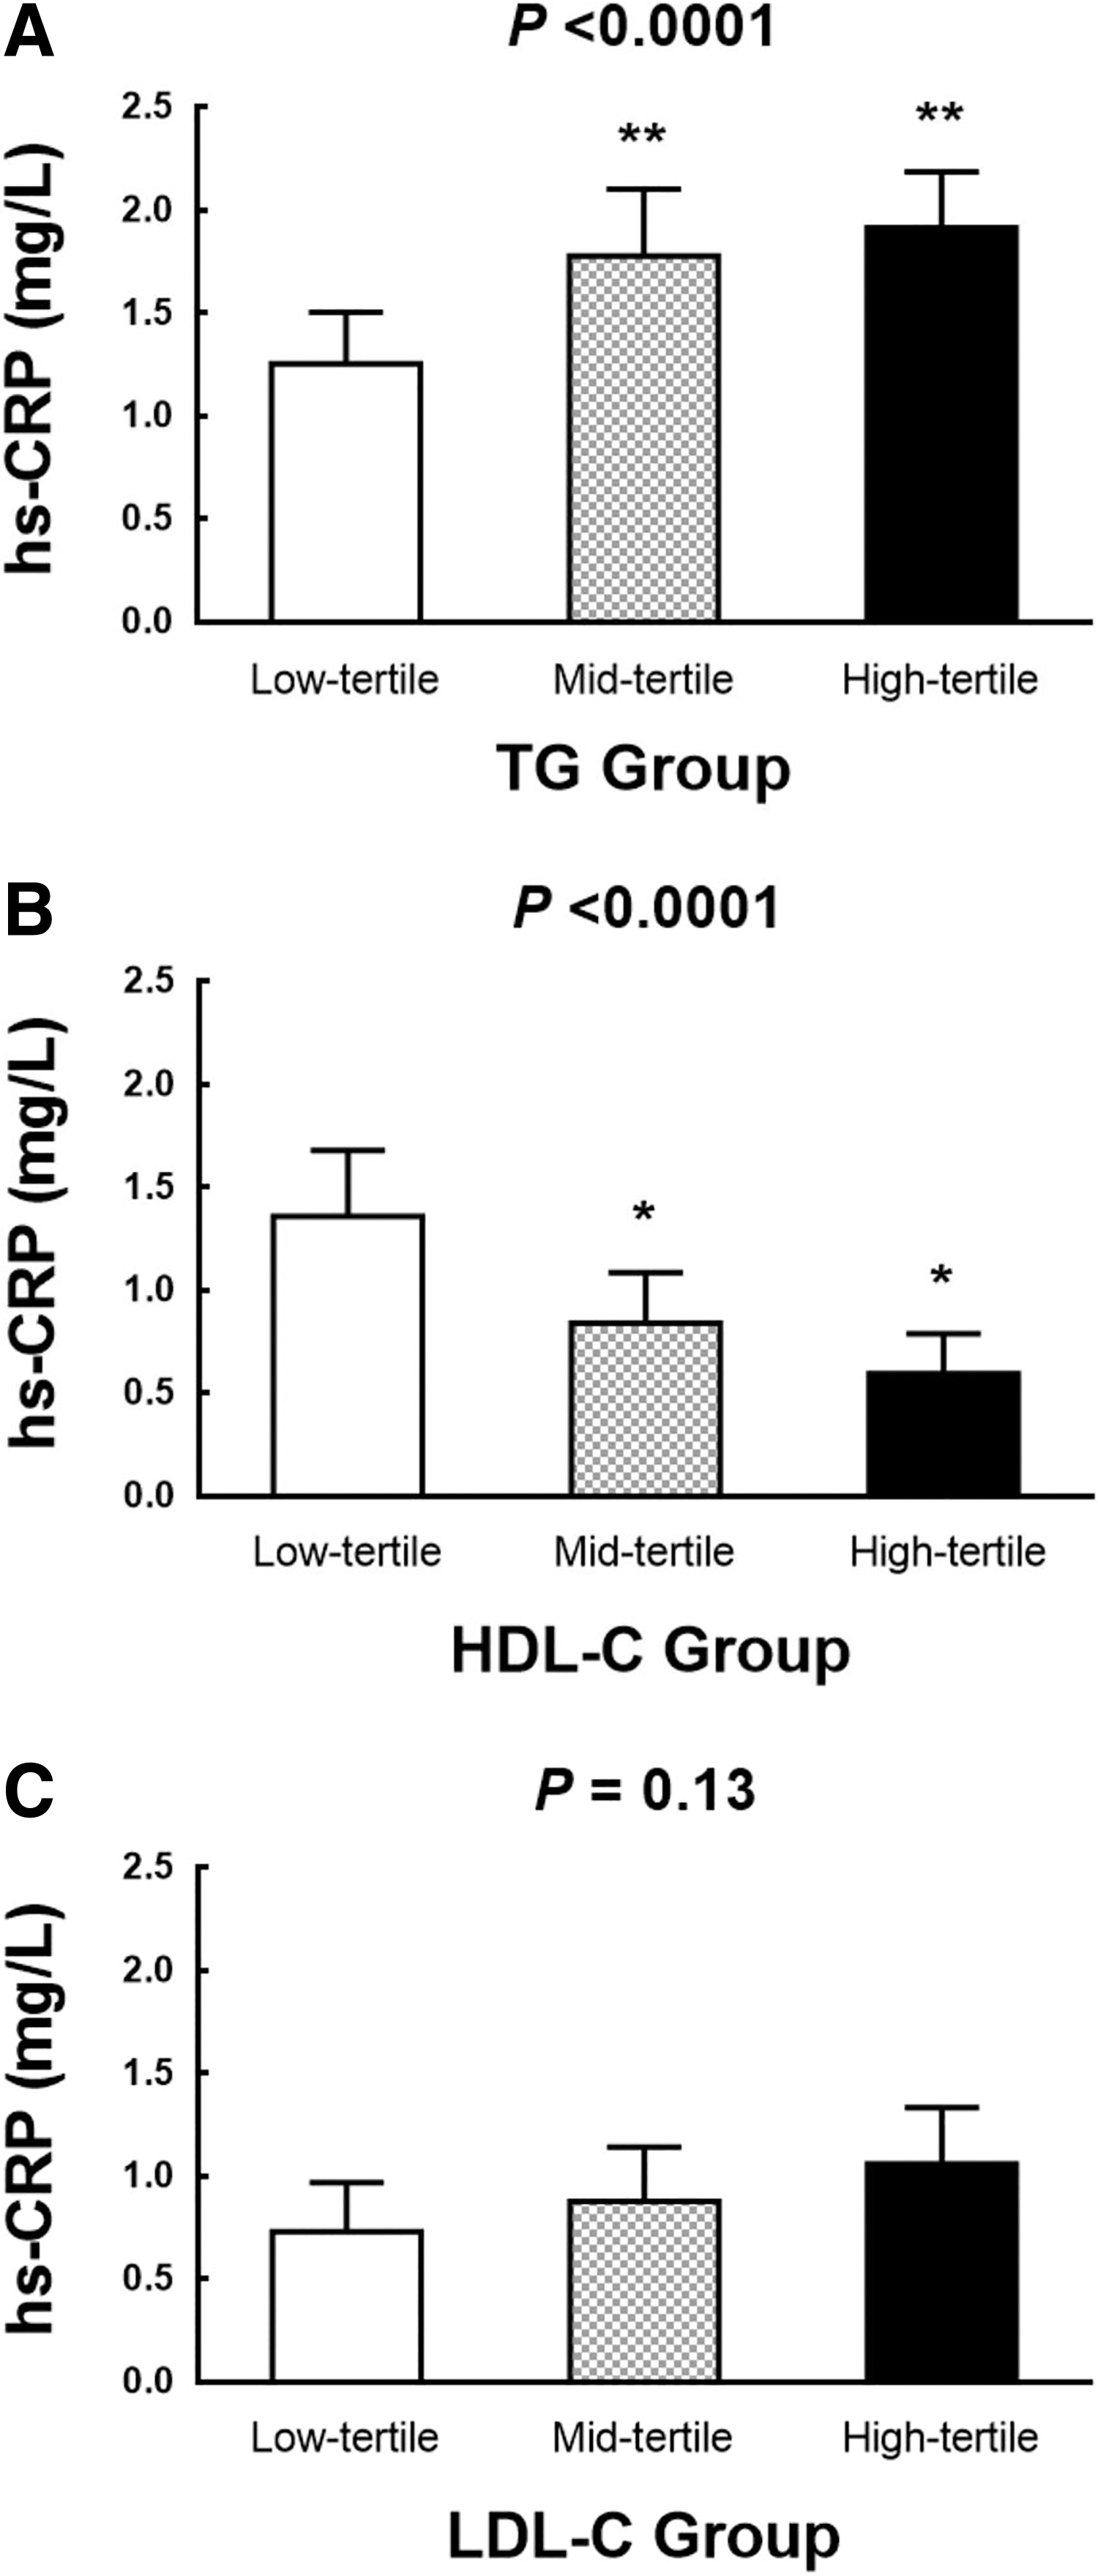
The distribution of hs-CRP level according to different lipid parameters. Data are given as the geometric mean with 95% CI, and univariate analyses were used to compare the association between hs-CRP level and three lipid parameters.
Using univariate analyses with the Log (hs-CRP) as the dependent variables (Table 2), most of the variables were found to have significant predictive value, other than age and LDL-C. These variables included sex (P = 0.02), BMI (P < 0.0001), physical inactivity scores (P = 0.04), systolic BP (P = 0.001), diastolic BP (P < 0.0001), Log ALT (P < 0.0001), HDL-C (P < 0.0001), Log TG (P < 0.0001), fasting PG (P < 0.0001), 2 hr PG (P < 0.0001), and Log (ISI0,120) (P < 0.0001) were significantly associated with hs-CRP level.
Results of the Univariate Regression Analyses with the Log Transformation of High-Sensitivity C-Reactive Protein as the Dependent Variable (n = 378)
P < 0.05.
Partial correlation analysis was conducted to examine the correlations of hs-CRP level with different lipid profile (Table 3). Log (TG) was positively correlated with Log (hs-CRP) adjusting for sex, age, physical inactivity scores, BMI, systolic BP, diastolic BP, Log ALT, Log (ISI0,120), fasting PG, and 2 hr PG (P = 0.04).
Partial Correlation a of Log Transformation of High-Sensitivity C-Reactive Protein with Lipid Profile in the Study Participants (n = 378)
Adjusted for sex, age, physical inactivity scores, BMI, systolic BP, diastolic BP, Log ALT, fasting PG, 2 h PG, and Log (ISI0,120).
P < 0.05 by partial correlation.
Subsequent stepwise multiple regression analyses were used to further analyze the associations between TG and hs-CRP in all subjects. Table 4 revealed stepwise selection in linear regression models with hs-CRP as the dependent variable. We found that BMI, Log (ISI0,120), and Log TG were independent predictor of hs-CRP level, while both HDL-C and LDL-C failed to be entered into the models.
Stepwise Multiple Regression Analysis a with the Log Transformation of High-Sensitivity C-Reactive Protein as the Dependent Variable (n = 378)
Independent variables: sex, age, BMI, physical inactivity scores, systolic BP, diastolic BP, Log ALT, LDL-C, HDL-C, Log TG, fasting PG, 2 h PG, and Log (ISI0,120).
Discussion
The result of this present study deriving from a Chinese cohort of apparently healthy subjects, demonstrated significant associations of hs-CRP level with different lipid profiles. In this study, elevated hs-CRP level was positively associated with TGs levels, but inversely correlated with HDL cholesterol levels. Furthermore, no significant correlation between hs-CRP level and LDL cholesterol was found in this study.
In accordance with other studies, hs-CRP level has been linked with TG and HDL cholesterol levels, in both diabetic and nondiabetic subjects. In a cross-sectional study of 45 young, nonobese, type 1 diabetic patients, hs-CRP levels were significantly associated with TG-to-HDL ratio, instead of glycemic control. 10 In a Augsburg cohort study, the Monitoring Trends and Determinants in Cardiovascular Disease, which recruited 936 apparently healthy middle-aged men, also showed consistent findings. 9 Furthermore, our study aligns with the research conducted by Ridker et al., indicating a lack of correlation between LDL-C and hsCRP, and supports the concept that the hs-CRP is a strong and independent risk factor for cardiovascular disease beyond LDL cholesterol. 6,20
Notably, our research specifically focused on Chinese participants, encompassing both men and women, which distinguished it from Ridker et al.'s study in 2002 that solely included female participants, as well as their study in 2023 that enrolled more than 80% individuals of White ethnicity. 6,20
Inflammatory state is associated with dramatic modifications in lipid and lipoprotein metabolism, which leads to altered HDL function, previously termed “dysfunctional HDL.” 21 In response to inflammation, elevated IL-6 stimulates hepatic synthesis of acute phase reactants such as CRP and serum amyloid A (SAA). SAA, in turn, can replace apolipoprotein A-I- and HDL-associated enzymes, serum paraoxonase 1 (PON1) in HDL particles. In addition, increased cholesteryl ester transfer protein-mediated TG transfer from TG-rich lipoproteins (TRLs), like VLDL to HDL, is observed during inflammation. In such TG-enriched HDL, TG typically substitute cholesteryl ester (CE) in the core of HDL particles, resulting in reduced CE/TG ratio and therefore less HDL particle stability. Consequently, the alteration of HDL composition and metabolism during acute-phase reaction contributes to a decrease in HDL-C levels in the circulation and an increased TG level. 22,23
Conversely, patients with insulin resistance were predisposed to release increase amount of free fatty acids from the insulin-resistant adipose tissue due to enhanced lipolysis via the activity of hormone-sensitive lipase. 24 The increase in circulating free fatty acids and elevated PG in insulin resistant state stimulates hepatic apolipoprotein (apo) C-III secretion. ApoC-III further contributes to the decrease in catabolism of TRLs by inhibition of lipoprotein lipase activity and hepatic uptake of VLDL and chylomicron remnant. Therefore, the dysregulation of apoC-III production in insulin resistance results in impaired clearance of TRLs from the circulation, which is the major cause of hypertriglyceridemia. 25,26 Insulin resistance is also associated with increased activity of hepatic TG lipase, which enhances the fractional catabolic rate of HDL, hence low serum HDL-C, and facilitates the generation of small dense LDL. 25
The excess intrahepatic lipid accumulation promotes lipid peroxidation and increased oxidative stress, ultimately leading to inflammation. Together, these metabolic alterations could explain the direct and indirect relationship between insulin resistance and hs-CRP level.
As confirmed in numerous studies, CRP has shown to be associated with high fasting insulin levels, a surrogate marker of insulin resistance. 27,28 In a study of 38 obese women categorized into insulin-resistant and insulin-sensitive groups, CRP level was found to be significantly higher in the insulin-resistant group, implicating that CRP levels are directly associated with insulin resistance, independent of obesity. 29 In a study that recruited 2388 Brazilians, an elevated hs-CRP level of ≥3 mg/dL was found to be significantly associated with metabolic syndrome, obesity, and hepatic steatosis. 30 A study by Klisic et al. also supported this observation, with their results demonstrating a 3 times higher hs-CRP level in overweight, healthy postmenopausal women in Montenegro. 22 Moreover, Heilbronn et al. also demonstrated a markedly reduced CRP level with weight loss. 31 The present study also showed consistent findings, by demonstrating a significant association of hs-CRP with BMI and insulin resistance after stepwise multiple regression analysis.
The Canakinumab Anti-inflammatory Thrombosis Outcomes Study 31 is known for its validation that inflammation attenuation leads to a decrease in major adverse cardiovascular events. The study enrolled 10,061 subjects with hs-CRP ≥2 mg/L and history of myocardial infarction, with 93% on lipid-lowering drugs. In those allocated to higher doses (150 or 300 mg) of canakinumab, an IL-1β monoclonal antibody, both a significant decrease in hs-CRP level up to 41% and a 15% reduction in major adverse cardiovascular events were reported. 32,33
Limitations
There are several limitations in this study. First, our study is a cross-sectional study, therefore causal relationship could not be drawn based on current results. Second, this is a single-center study, which limits the wide extrapolation of the conclusions to the general population. Third, our selection criteria for partisipants did not exclude smokers and individuals with hepatitis, potentially introducing selection bias. The absence of HbA1C examination may also lead to the inclusion of individuals with undiagnosed diabetes, which could affect the accuracy of the results. Moreover, the use of the Fredrickson equation for measuring LDL-C may lead to inaccuracies when TG levels exceed 400 mg/dL. Although two participants had TG levels above 400 (408 and 413, respectively), their exclusion did not significantly impact the observed association between hs-CRP levels and TG cholesterol levels.
Finally, the regression model of our study could only explain about 22% variance of the CRP levels. Although that insulin resistance was not determined using “clamp” techniques, HOMA-IR was proven as a reliable alternative method in assessment of insulin resistance. 17 Considering additional factors such as waist circumference, body fat mass, and history of smoking and drinking in the analysis may help obtain more reliable results.
Conclusions
In conclusion, the present study demonstrated that hs-CRP levels showed positive associations with TGs and inversely associated with HDL levels. The contribution of LDL-C to the levels of CRP may be insignificant.
Footnotes
Authors' Contributions
G.-Y.S. was responsible for conceptualization, methodology, and writing—original draft. N.X.N. contributed to data curation, formal analysis, and writing—review and editing. K.-H.L. was responsible for formal analysis and writing—review and editing. C.-M.H. assisted with study conceptualization, data interpretation, resources, writing—review and editing, and project administration. All authors have read and approved the final version of the article, and agreed with the order of presentation of the authors.
Author Disclosure Statement
No conflicting financial interests exist.
Funding Information
This study was supported by research grants from the National Science Council ROC (NSC92-2320-B-010-041), the Taipei Veterans General Hospital (VGH-93-206C, VGH-94-216) and MOST 110-2314-B-075-027-MY3 from Ministry of Science and Technology, Taiwan. C.-M.H. is also supported by the Shih-Yuan Foundation for the Development of Internal Medicine (grant nos. 92002 and 93008).