




Abstract
Background:
To prevent cardiovascular disease (CVD), it is important to determine the factors that are associated with its development. High serum low-density lipoprotein (LDL) cholesterol (LDL-C) levels are a modifiable prevention and treatment target known to contribute to the development of CVD, but the factors affecting blood cholesterol levels, including LDL-C, remain controversial.
Objective:
In this study, the factors (genetic, nutritional, and gut microbiota) thought to be effective on serum LDL-C levels were discussed from a holistic perspective, and the effects of the relationship between these factors on LDL-C levels were examined.
Methods:
The study was carried out with 609 adults (48% male) who applied to a private health institution between 2016 and 2022.
Results:
It was observed that serum LDL-C levels were positively correlated with body mass index (BMI) (P = 0.000) and different ApoE alleles had significant effects on LDL-C levels. It was observed that the highest LDL-C levels were in the ɛ4+ group, followed by ɛ3+ and ɛ2+ groups, respectively (P = 0.000). Results showed that dietary cholesterol and fiber consumption did not significantly affect serum LDL-C levels (P = 0.705 and P = 0.722, respectively). It was also observed that enterotypes and the butyrate synthesis potential of intestinal microbiota did not cause significant changes in serum LDL-C levels (P = 0.369 and P = 975, respectively).
Conclusion:
Serum LDL-C levels are affected by modifiable factors such as BMI and nonmodifiable factors such as APOE genotype. By identifying these factors and conducting further studies on them, new ways to improve serum LDL-C levels, which is an important factor in the development of CVD, can be identified. In addition, no significant effect of gene-nutrient or microbiota-nutrient interactions on serum LDL-C levels was detected. Further research is needed, especially on the relationship between intestinal microbiota and serum LDL levels.
Introduction
High concentrations of low-density lipoprotein cholesterol (LDL-C) can lead to “hypercholesterolemia,” which is a condition that increases the risk of cardiovascular diseases (CVD). 1 Genetic, epidemiological, and clinical studies have indicated that serum LDL-C levels are associated with the incidence of CVD-related death. There are many factors that cause high LDL-C levels, such as diet, genetic factors, use of various drugs, low physical activity, and numerous other diseases. 1
For many years, dietary guidelines have recommended limiting dietary cholesterol intake to regulate serum lipid levels and reduce CVD risk. On the other hand, nutrition guidelines published in recent years have not made clear recommendations for the restriction of dietary cholesterol to reduce the risk of CVD. 2 According to the consensus report developed by American College of Cardiology (ACC) experts on nonstatin therapies in the management of CVD in 2016, soluble/viscous dietary fiber reduces LDL-C levels and may reduce CVD risk in combination with a diet low in saturated fat and cholesterol. 3 It was also indicated that there is a significant relationship between high-fiber diet intake and reduced CVD risk. 4
Besides nutrition status, it is estimated that heredity affects serum LDL-C levels by 40%–50%. The ApoE gene, one of the most studied genes for its relationship with serum LDL-C levels, is responsible for apolipoprotein E synthesis in the human body. ApoE alleles have a strong effect on many diseases such as CVD, Parkinson's, dementia, and Alzheimer's. The most notable among these alleles, ɛ4, has been associated with hypercholesterolemia and atherosclerosis in different studies. 5 When we examine gene-diet interactions within the scope of this study, it is observed that the changes in serum lipid levels in response to dietary interventions may vary with the effect of various genetic factors. 2,6 In addition to the direct relationship between ApoE polymorphisms and blood lipids, some studies suggest that ApoE alleles can induce changes in serum LDL-C levels in response to dietary interventions. 2,7
Studies have also shown that gut microbiota play a regulatory role in the connection between dietary habits and CVD. However, interindividual and intraindividual diversity and variation of gut microbiota cause confusion in understanding how it fulfills these regulatory functions. 6 For this purpose, in 2011, the intestinal microbiota of individuals were divided into groups called “enterotypes” according to the bacterial species that dominate colonization. 7 Enterotypes have been associated with different diets. 7 A study observed that individuals with the Prevotella enterotype have lower serum LDL-C levels than other enterotypes, regardless of diet. It was also observed that the number of strict vegetarians was higher in the Prevotella-driven enterotype, and only in the Prevotella-driven enterotype, a vegetarian diet was associated with lower LDL-C levels, suggesting that the bacterial structure of this enterotype may lead to this association. 6
As mentioned above, a diet rich in dietary fiber has a lowering effect on serum cholesterol, especially LDL-C. Considering the role played by gut microbiota between this nutritional behavior and health outcome, studies indicate that butyrate may also have metabolic effects in this pathway. Butyrate has regulating effects on lipid metabolism in the liver and intestines. It has been reported that it plays a protective role against hypercholesterolemia by downregulating the expression of nine genes, including HMGCR, which is involved in cholesterol biosynthesis in the intestines, and prevents the formation of atherosclerosis. 8 Based on this, we examined whether the butyrate production capacity of microbiota had an effect on serum LDL-C levels.
In this study, it is aimed to determine the factors affecting LDL-C levels and the relationships between these factors to determine novel therapeutic targets for lowering LDL-C levels.
Materials and Methods
This study was designed as a retrospective observational study, and the recorded health data of individuals who applied to The Gentest Institute of Public Health Genomics and Personalized Medicine, a private health institution in Istanbul, Turkey, between 2016 and 2022 were examined.
Study subjects
When the data records were examined, a total of 1031 client records were found as of 21.02.2022. The inclusion criteria included having received service from the relevant institution between the specified dates, having provided the necessary health data, and being older than 18 years. Data scanned for use in the study were age, gender, height, weight, body mass index (BMI), daily energy, cholesterol and fiber intake, serum LDL-C levels before any intervention, ApoE rs7412 and rs429358 genotype results, gut microbiome enterotype, and intestinal butyrate synthesis potential information.
Individuals younger than 18 years and those who lack the above-mentioned data (except for enterotype and butyrate synthesis potential) were excluded from the study. Exclusion criteria were the current use of a statin group or any drug that influences blood lipids, being pregnant, declaring a history of familial hypercholesterolemia, and concurrent history of hypercholesterolemia in both the patients and their first-degree relatives. When all these arrangements were made, this study was conducted with a total of 609 individuals (Fig. 1). Written informed consent was obtained from all participants for being included in the study.
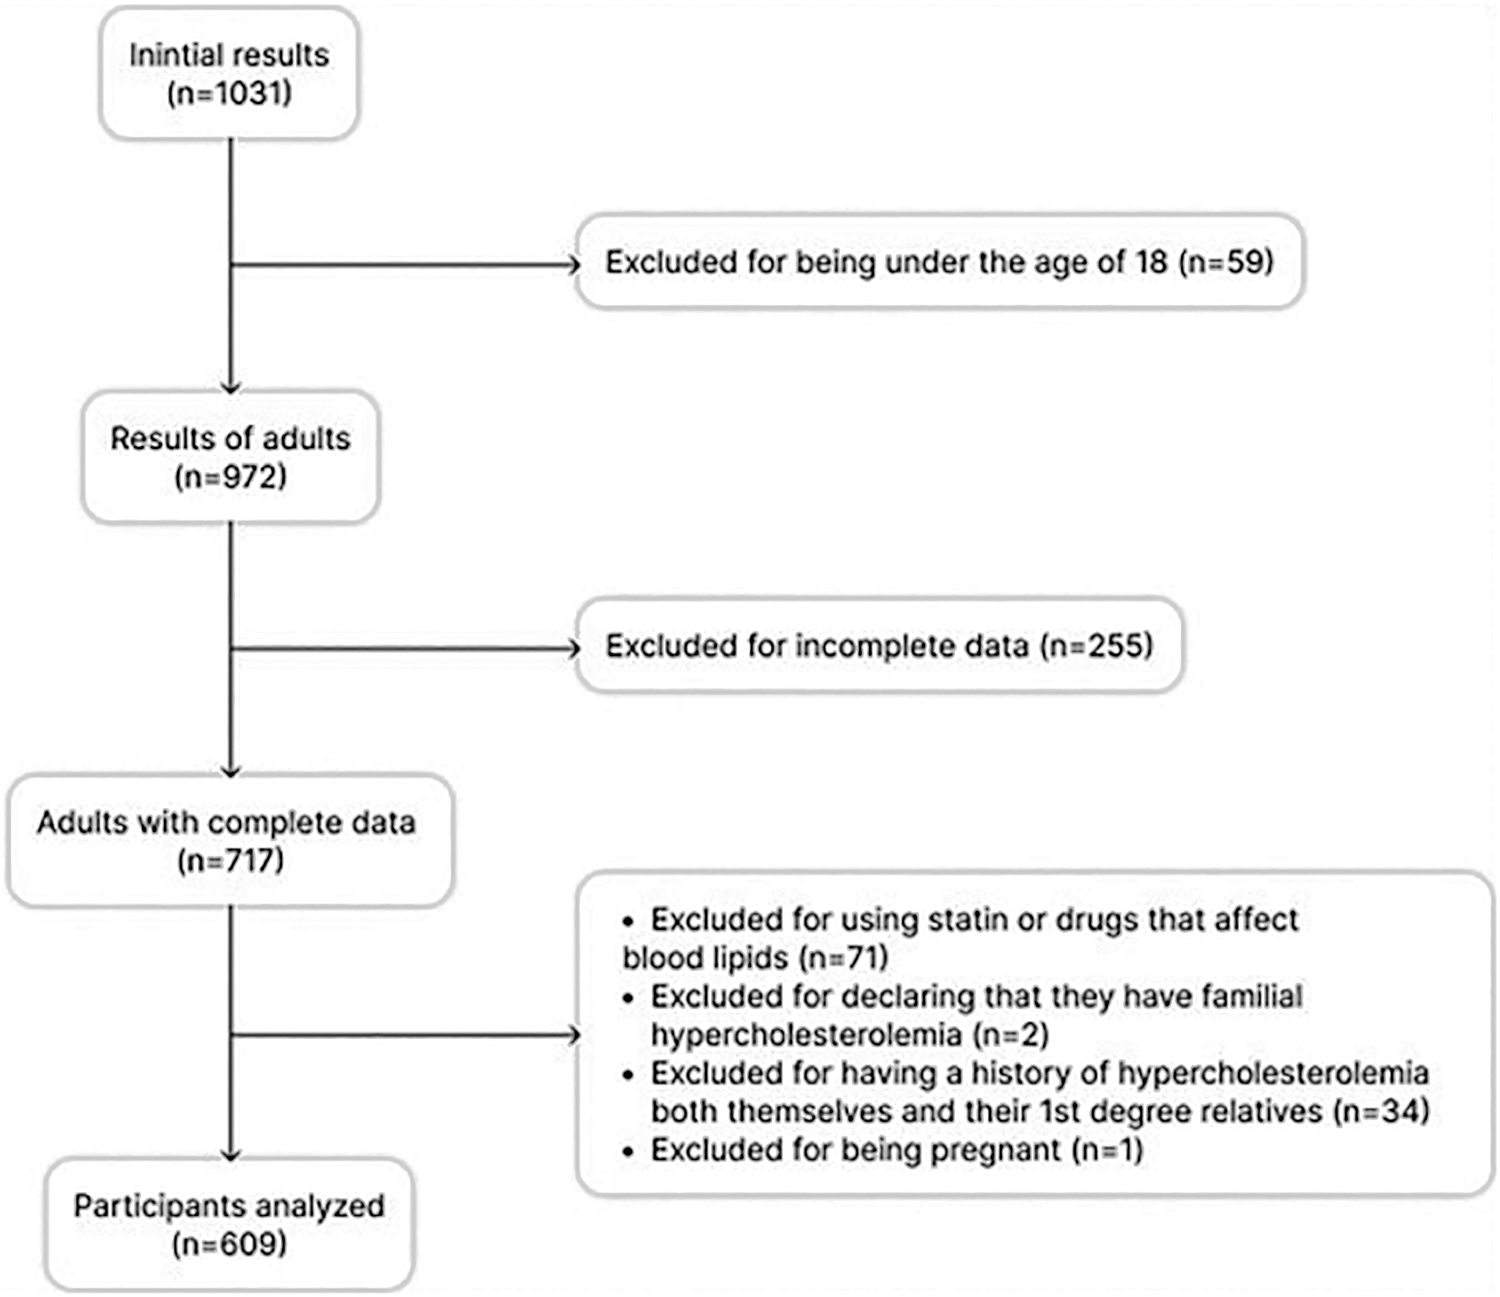
Flow diagram of study subjects.
Data collection
Demographic and anthropometric characteristics, which were collected and stored just before individuals started receiving services from the institution, were obtained from encrypted online data banks. The height and weight measurements of participants were taken and recorded by the health professionals before any intervention, in the institution.
To determine the daily average amount of energy, cholesterol, and fiber consumption of clients, dietitians in charge of clients in the institution applied a 114-item food frequency questionnaire covering the last 1 year. Clients were asked how often and in what quantities they consumed these 114 foods in the last year. Afterward, results of the questionnaire were then entered into the “BeBis” Programme, which calculates the amount of energy, micronutrients and macronutrients, in the given food. The results were calculated and recorded to give daily energy, micronutrients and macronutrient intake, of the individual.
The blood samples taken after an overnight fasting by the institution nurse were studied in a contracted private laboratory. The blood samples that were shipped for analysis were studied with the enzymatic colorimetric method and the result reports were sent to the institution. Serum LDL-C levels were taken from these reports.
Saliva or epithelial samples, which were taken from the inside of the cheek with a swab by the institution nurses for genetic analysis, were shipped to a private biomedical company in England for analysis with microchip technology. Approximately 2 mL of saliva sample was collected in the collection kit named Oragene DNA OG-500 and stored in the stabilizer liquid in it. Up to 100 μg of DNA was obtained from a 2 mL saliva sample. Infinium Global Screening Array v3 DNA-microarray and The iScan scanner by Illumina were used for genotyping. For each person, 650.000 single nucleotide polymorphisms (SNP) were analyzed. In the institution, necessary data were used for its effect on diseases, and the raw data of SNPs were saved online and encrypted. In this study, we evaluated two SNPs in ApoE gene due to their high impact potential on blood lipids.
Finally, stool samples taken from clients in the institution were shipped to England for microbiome analysis at the same biomedical company. Samples were analyzed by the 16S rRNA sequencing method. As a result, the synthesis potential of enterotype and butyrate in the intestines of individuals was reported and presented to the institution.
Gut microbiome of individuals were divided into three groups called “Enterotypes” according to the dominant bacterial species they contain. Enterotype 1 is dominated by bacteria of the Bacteroides genus up to 80%. This enterotype, which also includes the genera Parabacteroides, Paraprevotella, and Odoribacter, is the least diverse of the three enterotypes. Enterotype 2 is dominated by bacteria of the Prevotella genus. According to laboratory data, among Europeans, enterotype 2 is more common in people who consume a lot of simple carbohydrates, as well as in vegetarians. And the last one, enterotype 3, does not have a predominant genus. This type of microbiome is rich in butyrate-synthesizing bacteria, such as Ruminococcus, Eubacterium, Dorea, Anaerostipes, Blautia, unclassified Lachnospiraceae, and, to a lesser extent, Collinsella.
To determine the butyrate synthesis potential, the representation levels of Faecalibacterium, Roseburia, Eubacterium hallii, Butyricicoccus, Odoribacter, Anaerostipes, Flavonifractor, Butyricimonas, Butyrivibrio, and Coprococcus genera in the microbiome were evaluated. Based on this evaluation, bacterial representations were scored by comparing them with the average results of individuals who had this microbiota test, and then the butyrate synthesis potential of guts of individuals was scored between 1 (lowest synthesis potential) through 10 (highest synthesis potential). Evaluated bacterial representations were scored by comparing them with the average results of individuals who had this microbiota test.
Statistical analysis
SPSS version 27.0 was used for statistical analysis. In the study, all statistical significances were set at P value <0.05. While evaluating the study data, descriptive statistical indicators in continuous data, mean, standard deviation, minimum and maximum values, as well as frequency and percentage distributions for categorical data are given. Data of the study were analyzed with normal distribution tests such as Kolmogorov–Smirnov and Shapiro–Wilk Tests, and it was determined that normal distribution was provided.
Therefore, the analysis of variance (ANOVA) test was used in comparison of three or more groups, and the independent sample t-test was used in comparison of two groups. Since the relationship and group difference analyses will be conducted in this study, the power analysis results for these two methods were given and the least number of samples required for the study to be carried out was determined. Power analysis was done with G*POWER version 3.1. As a result of the power analysis, the validity of the study was determined if at least 115 samples were used for the relationship analysis and at least 176 samples for the group difference analysis. In this study, compatibility was achieved with a sample group of 609 people.
Results
The percentage distributions of demographic and anthropometric characteristics of participants are given in Table 1. A total of 609 individuals (47.8% male) enrolled in the study. The mean age of individuals was 48.4 ± 13.7 years, and the average BMI of female participants was 25.9 kg/m2.
Distribution of Participants by Their Demographic and Anthropometric Characteristics
BMI, body mass index.
According to the analysis, the average daily cholesterol consumption of participants was 388.8 ± 209.1 milligrams, the average fiber consumption was 30.9 ± 12.2 grams, and the average energy consumption was 2097.1 ± 731.8 kcal. In the study group, the genotypic frequencies of APOE polymorphisms were within the Hardy-Weinberg equilibrium (P = 0.2246). Majority of the population, both males and females, had “TT” genotype of rs429358 (76.4%), “CC” genotype of rs7412 (83.6%), and ɛ3 allele of APOE gene (79.6%).
The analysis of enterotypes and butyrate synthesis potential of gut microbiota was carried out on 81 people since not everyone who received service from the current health institution had a gut microbiota screening. Analysis showed that both in men and women, the most frequently observed enterotype was enterotype 1 and it was followed by Enterotype 3 and 2. Distributions of enterotype and butyrate synthesis levels of participants are given in Table 2.
Distribution of Single Nucleotide Polymorphisms, Alleles, Enterotypes, and Butyrate Synthesis Potential
Relationships of examined parameters with serum LDL-C levels
The relationship between serum LDL-C levels and BMI, daily consumption of energy, dietary cholesterol, and fiber is shown in Table 3. There was a positive and statistically significant relationship between serum LDL-C levels and BMI (P = 0.000). We observed no significant relationship between serum LDL-C levels and daily energy, dietary cholesterol, and fiber consumption (P = 0.401, P = 0.705, and P = 0.722 respectively).
Relationship Between Serum Low-Density Lipoprotein Cholesterol Levels and Body Mass Index, Daily Energy, Dietary Cholesterol, and Fiber Consumption
P < 0.05 considered statistically significant.
LDL-C, low-density lipoprotein cholesterol; r, Pearson correlation analysis.
The difference between serum LDL-C levels of participants in different ApoE allele groups is shown in Table 4. Considering the opposite effects of ɛ2 and ɛ4 alleles on health, the ɛ2/ɛ4 group (n = 42) was excluded from the subsequent analysis as in similar studies. 9 –11 It was observed that serum LDL-C levels showed a significant difference between allele groups (P = 0.000).
Difference Between Serum Low-Density Lipoprotein Cholesterol Levels of Participants with Different ApoE Allele Groups
P < 0.05 considered statistically significant.
SD, standard deviation.
No significant difference was observed between serum LDL-C levels of individuals with different enterotypes (P = 0.369). Also, there was no significant difference between serum LDL-C levels of individuals with different butyrate synthesis potentials (P = 0.975) (Table 5).
Serum Low-Density Lipoprotein Cholesterol Levels by Enterotype and Butyrate Synthesis Potentials
P < 0.05 considered statistically significant.
Exploratory analysis
In the following analysis, it is aimed to explore the combined effects of examined parameters on serum LDL-C levels. For this purpose, the association between serum LDL-C levels and daily cholesterol and fiber consumption was evaluated according to the ApoE allele and enterotype groups. It was observed that there was no significant relationship between serum LDL-C levels and daily cholesterol or fiber consumption, except for the weakly significant, negative relationship between dietary cholesterol consumption and serum LDL-C levels in the ɛ2+ group (P = 0.048). There was also no significant relationship between daily average cholesterol and fiber consumption and serum LDL-C levels in any enterotype group (P > 0.05) (Table 6).
Association Between Serum Low-Density Lipoprotein Cholesterol Levels and Daily Cholesterol and Fiber Consumption According to the ApoE Allele and Enterotype Groups
P < 0.05 considered statistically significant.
Discussion
Studies show that CVD and its death rates can be significantly reduced by lowering serum LDL-C levels. 12 It was observed that the mean serum LDL-C level of participants of this study (136.4 ± 37.7 milligrams/dL) was borderline high. 12
Abnormalities in lipid metabolism are quite common among individuals with obesity, and dyslipidemia is observed in ∼60%–70% of individuals with obesity and in 50%–60% of overweight individuals. Therefore, individuals with obesity are at high risk of CVD. 13 We observed a statistically significant and positive correlation between serum LDL-C levels and BMI values in this study (P = 0.000), in parallel with a number of studies. 14,15
No significant correlation was observed between energy intake and serum LDL-C levels of individuals included in this study (P = 0.401), which is consistent with some other studies. 16,17
In this study, dietary cholesterol consumption of participants was above the national recommendations (<300 milligrams) and there was no statistically significant relationship between dietary cholesterol consumption and serum LDL-C levels (P = 0.705). There are studies that are in agreement with these results. 18,19 The heterogeneity in the results of such studies makes it difficult to establish a direct relationship between dietary cholesterol and serum LDL-C levels. It was also stated that the effect of dietary cholesterol consumption on plasma LDL-C levels is less consequential when compared to saturated fatty acids. Therefore, it has been reported that the relationship between dietary cholesterol and CVD is minimal in the 2014 Lifestyle Guidelines and the 2015–2020 Dietary Guidelines for Americans published by the ACC/AHA. 20
It has been stated that 64.2% of the Turkish population is below the AI in fiber consumption. 21 According to Turkey Nutrition and Health Survey 2017, fiber consumption among the Turkish population is 22.4 ± 10.04 grams. 22 This study group had a fiber consumption above the recommendations and the population average. However, we did not observe a significant relationship between fiber consumption and serum LDL-C levels (P = 0.722), in consistency with Zhou et al. 23 In contrast, another study conducted on individuals with type 2 diabetes found a negative relationship between dietary fiber and LDL-C in both individuals with type 2 diabetes and healthy control groups (P = 0.038 and P = 0.049, respectively). 24
As for the genes, the frequency of the C allele on rs7412 is 0.92 globally, exactly the same as this sample (0.92 for the C allele). On rs429358, the frequency of the T allele is 0.93 globally. Our data show that the frequency of the T allele is 0.88 on rs429358, similar to the global numbers. 25
When the frequencies of alleles in the ApoE gene of participants were examined, it was observed that the majority (79.6%) of alleles were ɛ3, followed by ɛ4 (12.2%) and ɛ2 (8.3%) alleles.
In this study, we observed that the ɛ2+ group had the lowest and the ɛ4+ group had the highest serum LDL-C levels (P = 0.000), supporting the results of previous studies suggesting that serum LDL-C levels differ significantly between the ApoE allele groups, and that individuals carrying the ɛ4 allele had significantly higher serum LDL-C levels than those carrying the ɛ3 allele, 9 showing that serum LDL-C levels of individuals with different alleles were significantly different in individuals without CAD. 10
As for the studies conducted in Turkey, it was observed in a 2022 study that ɛ2 carriers (ɛ2+) had lower serum LDL-C levels compared to individuals who did not have the ɛ2 allele (ɛ2-) (P < 0.001). When the lipid profiles of ɛ4 carriers (ɛ4+) and individuals who do not have the ɛ4 allele (ɛ4-) were compared, no significant correlation was found between serum LDL-C levels (P = 0.157), while the LDL-C/HDL-C ratios of ɛ4 carriers were significantly higher than those who do not carry the ɛ4 allele (P = 0.017). 26
In the correlation analysis, a statistically weak, but significant correlation was found between dietary cholesterol intake and serum LDL-C levels only in the ɛ2+ group (P = 0.048). However, the unexpected result is that this relationship is negative (r = −0.264), which means, according to the results, as the dietary cholesterol consumption of individuals in the ɛ2+ group increases, there is a decrease in serum LDL-C levels. Although there are controversial results in the literature on the relationship between dietary cholesterol and blood lipids, some studies state that an increase in blood lipids is observed with an increase in dietary cholesterol consumption, 27 while others state that they cannot find a significant relationship between the two parameters. 18,19
To the best of our knowledge, there is no parallel result in the literature with this result, except it was observed in one study that individuals with normal LDL-C levels (<130 milligrams/dL) had higher dietary cholesterol consumption than individuals with abnormal LDL-C levels, but the difference was considered statistically insignificant since it was borderline (P = 0.050). 28 The number of people in the ɛ2+ group (n = 57) may have an effect in this unexpected result. As was done in the method part of a study, when individuals with the ɛ2/ɛ4 allele structure were included in the ɛ2+ group, the number of individuals increased to 99 and this relationship between serum LDL-C levels and dietary cholesterol was no longer valid. 29 It was observed that it was not significant (P = 0.586).
A Finnish study stated that serum cholesterol levels of different ApoE allele carriers differ in response to dietary cholesterol supplementation (P = 0.03). However, no similar association was found for serum LDL-C levels. 30 According to the results of this study, there was no significant relationship between serum LDL-C levels and daily dietary fiber consumption in any ApoE allele group. In a study examining gene-nutrient interactions affecting the serum lipid profiles of people with “normal weight obesity syndrome,” each 1 gram of fiber added to the diet decreased the rate of fat accumulation around the waist by 0.36% in ApoE ɛ3/ɛ3 homozygotes and ɛ4 carriers (respectively, P = 0.039 and P = 0.041), and no such effect was observed in ɛ2 carriers (P = 0.444). 31
In recent years, the effect of gut microbiota on CAD has started to draw attention. The different microbial communities in the intestines of individuals with CVD have prompted researchers to specifically investigate microbial communities that are associated with CAD. In a study by Hu et al., it was observed that the pathogenesis of CAD decreased in individuals with enterotypes 1 and 3, and increased in individuals with enterotype 2 (P = 0.04). Since enterotype 2 is usually associated with a vegetarian diet, this result may be considered unexpected. 32
In a study conducted by de Moraes et al., contrary to the result above, individuals with enterotype 2 had lower serum LDL-C levels than individuals with enterotype 1 and 3 (P = 0.036). 6 To the best of our knowledge, this study is the first to examine the enterotype distribution of individuals in Turkey. It was observed that the majority of the study group had enterotype 1 (54.3%), followed by enterotype 3 (24.7%) and enterotype 2 (21%). We did not observe a significant result of the difference analysis between the three enterotypes and LDL-C levels (P = 0.369). Similarly, in another study published in 2021, no significant correlation was observed between serum LDL-C levels of individuals with enterotype 1 and enterotype 2 (P = 0.653). 33
In addition, it is thought that enterotypes may have an effect on the metabolic responses of the human body to different diets. 34 For example, Kovatcheva-Datchary et al. showed that 3-day dietary fiber consumption in healthy individuals improved the glucose metabolism of individuals with a high Prevotella/Bacteroides ratio, while it did not have any effect in individuals with a low Prevotella/Bacteroides ratio. 35
In another study examining the effects of a diet rich in dietary fiber on weight control, it was observed that individuals with a high P/B ratio lost significantly more weight as a result of consuming a calorie-restricted, fiber-rich diet compared to individuals with a low P/B ratio. 36 We observed no significant relationship between dietary cholesterol and dietary fiber and serum LDL-C levels in any group in this study. However, considering the growing body of information in the literature, the effects of dietary interventions on serum LDL-C levels in different enterotypes seem to be an issue worth investigating.
The butyrate-producing capacity of gut microbiota is determined by evaluating the presence and amount of butyrate-producing bacteria in the gut. To evaluate that, the 16S rRNA gene sequencing method, which is also used in the evaluation of samples in this study, or some other sequencing methods are used. 37 Butyrate is generally synthesized by Clostridium, Eubacterium, and Fusobacterium genera and shows biological effects through various pathways. Studies suggest that butyrate supplementation has a lowering effect on serum cholesterol levels. 38 However, in this study, the issue was handled differently and the butyrate production capacity of gut microbiota was investigated. Since acetate and propionate are absorbed in the intestine, and butyrate is used as an energy source by the colon cells, its serum concentrations are quite low compared to acetate and propionate. 39
Considering that, it seems to be a more accurate way to determine the production levels in the intestine rather than to examine the serum levels to find more reliable information about butyrate. However, we observed no significant relationship between the butyrate synthesis potential of gut microbiota and serum LDL-C levels (P = 0.975).
To our knowledge, there is no study in the literature directly investigating the relationship between butyrate production capacity of gut microbiota and serum LDL-C levels; an animal study conducted by Wang et al. observed that pepper added to the diet had a positive effect on butyrate production in the intestinal microbiota of mice. It was observed that when the production of butyrate increased, the level of butyrate significantly increased in serum and feces, and it was followed by significant decreases in serum total cholesterol levels. In the study, it was stated that this lowering effect of pepper on serum cholesterol levels is provided by increased butyrate levels in the body. 11
Footnotes
Acknowledgments
The authors thank Assist. Prof. Funda Hatice Sezgin for statistical guidance and Dr. Serdar Savaş for giving permission to conduct this study at the Gentest Institute of Public Health Genomics and Personalized Medicine.
Authors' Contributions
Conception and design: C.E. and A.S.D.. Data acquisition, analysis, and/or interpretation: A.S.D.. Drafting the article: A.S.D.. Revising it critically for important intellectual content: C.E. and M.U.. Final approval of the version to be published: C.E. and M.U..
Ethical Approval
This study was performed in line with the principles of the Declaration of Helsinki. Approval was granted by the Bahçeşehir University Faculty of Medicine Ethics Committee (Date: May 11, 2022; Ethical Approval Number: 2022-08/01).
Author Disclosure Statement
No conflicting financial interests exist.
Funding Information
No funding was received for this article.