




Abstract
Background:
Our knowledge for the possible link between choline and betaine and the risk of type 2 diabetes (T2D) is very limited and contradictory. This study aimed to investigate the prospective association of dietary choline and betaine intakes with the risk of T2D in a group of Tehranian adults.
Methods:
In this prospective study, 6022 eligible subjects aged ≥18 years were chosen from the participants of the Tehran Lipid and Glucose Study in a secondary analysis. Diet was assessed based on a valid and reliable semiquantitative food frequency questionnaire. At baseline and follow-up examinations, biochemical and anthropometric variables were assessed. Multivariable Cox proportional hazard regression models was used to estimate the new onset of T2D concerning choline and betaine intake.
Results:
The mean age ± SD of 2707 men and 3315 women were, respectively, 41.4 ± 14.2 and 39.1 ± 13.1. During a median follow-up of 6.63 years, 528 cases of T2D incidence were diagnosed. Participants with a higher intake of choline had a higher intake of protein, fiber, and B12 and a lower intake of energy and carbohydrates. After controlling of confounders a significant positive association was observed between choline intake and the hazard ratio (HR) of T2D across quartiles of choline intake [HR (CI) in the fourth quartile: 1.25 (1.14–1.38), P trend = 0.01], but this significant finding was not reported for betaine intake. For every 100 milligram increase in choline consumption, the HR of T2D increased significantly in all age, sex, and BMI subgroups.
Conclusions:
Choline consumption increased the risk of T2D in total population and subgroups. No statistically significant association was found between dietary betaine intake and the risk of T2D in total population and subgroups.
Introduction
Type 2
Choline is an essential nutrient involved in the transferring of the methyl group, the regulation of nervous system function and lipid metabolism. 8 Choline is oxidized to betaine, a compound that participates in the reaction that converts homocysteine to methionine. 8 Choline is naturally present in some foods and is also synthesized endogenously in the human body. The endogenous synthesis of choline in the body is not enough to meet the total needs of the body, so receiving choline by diet is essential for human health. 9 Food sources of choline and betaine are varied, including foods that have a positive and negative effect on chronic diseases including red meat, eggs, fish, green vegetables, and whole grains. 8 The existence of such important roles for choline and betaine, as well as the observation of the epigenetic effects of choline, led researchers to question whether there is a significant relationship between choline and betaine intake and the risk of chronic disease in humans.
Several studies have reported an inverse relationship between dietary choline intake and inflammatory markers such as C reactive protein, interleukin-6, and tumor necrosis factor-α. 10 So choline can be effective in improving the inflammatory status; however; few studies have examined the association between choline and T2D risk, whose results were very contradictory. In the Virtanen et al. study, the risk of developing T2D was lower in men who consumed more choline. 11 Similarly, some studies have shown that the use of choline and betaine in the diet is associated with better insulin sensitivity, 12 whereas another study found a significant direct correlation between a choline metabolite trimethylamine-N-oxide (TMAO) and the risk of T2D. 13
Single-carbon cycle enzyme that requires betaine is expressed differently in various communities, and the levels of choline and betaine metabolites are different in men and women. 14 The need for dietary choline varies in different communities. 15 The sum of these findings highlights the importance of investigating the relationship between choline consumption and the risk of T2D in different communities. So this study was designed to investigate the possible association of dietary choline and betaine intake with the risk of T2D in a group of adult Tehranians.
Materials and Methods
Study population
Participants were selected from the Tehran lipid and glucose study (TLGS), and an extensive population-based cohort study was performed to find out risk factors for noncommunicable diseases in a representative sample of Tehran, the capital of Iran. 16,17 The first survey was carried out from 1999 to 2001 on 15,005 individuals aged ≥3 years, using the composite stratified cluster random sampling technique. The follow-up surveys of this cohort study was performed every 3 years; 2002–2005 (survey 2), 2005–2008 (survey 3), 2008–2011 (survey 4), and 2012–2015 (survey 5), and 2015–2018 (survey 6) to find out the onset of developed diseases. Of subjects participating in surveys 3 and 4, we randomly selected 8048 individuals (≥18 years) with completed dietary assessment for this secondary analysis.
We excluded subjects with under- or overreporting of energy intake (<800 or ≥4200 kcal/day) 18 (n = 780), then a total of 7268 adult men and women with available dietary, biochemical, and anthropometric data were followed until survey 6 (participants entering at surveys 3 and 4 were followed three and two times for the outcome measurements, respectively). Of these individuals, we precluded pregnant or lactating women and subjects diagnosed with T2D at baseline based on measurements of fasting plasma glucose or self-reported taking glucose-lowering drugs 19 (n = 598). Finally, after precluding participants missing any follow-up data (n = 498), 6022 participants remained and entered the analysis (Fig. 1).
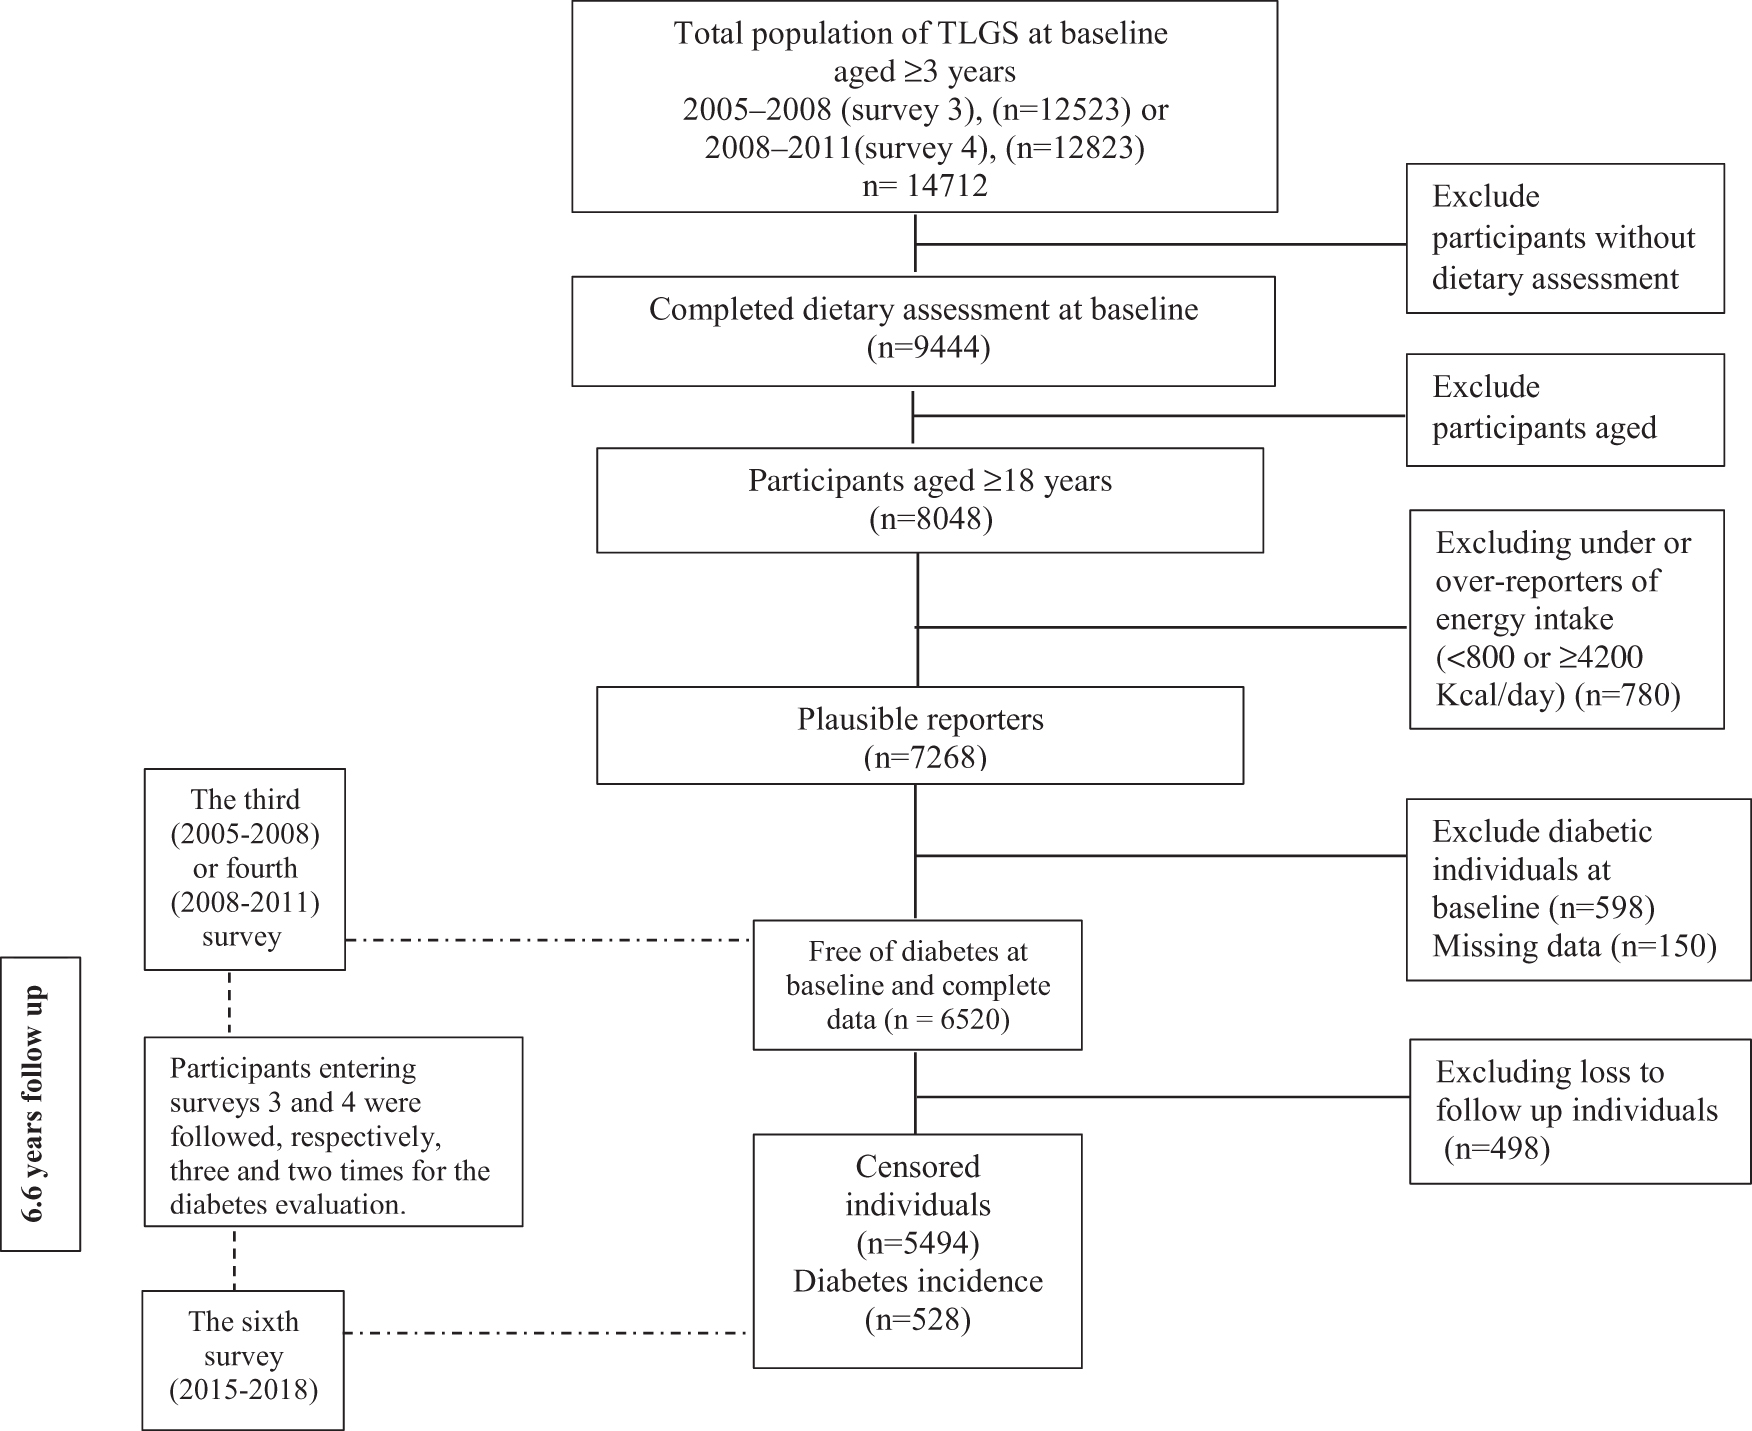
Outline of the study participants.
Ethical approval for this study was obtained from the ethics committee of the Research Institute for Endocrine Sciences, Shahid Beheshti University of Medical Sciences, Tehran, Iran (
Dietary assessment
Skilled nutritionists collected dietary data using a valid and reliable semiquantitative food frequency questionnaire (FFQ). They questioned usual dietary intakes based on standard portion sizes during the last year through face-to-face personal interviews. In the previous study, dietary data were collected monthly using twelve 24 hr dietary recalls and two 168-item semiquantitative FFQs to find out the relative validity and reliability of the FFQ. 20,21 For overall nutrient intakes, the mean energy-adjusted correlation coefficients between the 24-hr dietary recalls and FFQ2 were 0.44 and 0.37 in ≤35-year-olds and >35-year-olds, respectively. 21
The consumption frequency of each food item was changed to daily intakes; portion sizes were then changed to mass (grams/day) using household measures. Owing to the uncompleted Iranian food composition table (FCT), the United States Department of Agriculture (USDA) FCT was used to break down the nutrient composition of food items (e.g., bread, legume and nuts, white or red meat) not included in the Iranian FCT.
Dietary intake of choline and betaine was calculated using USDA database for common foods' choline content. 22
Physical activity measurements
An interviewer questioned physical activity levels using Persian-translated modifiable activity questionnaire. Previous study reported high reliability and moderate validity of this questionnaire. 23 Time and frequency of light, middle, high, and challenging intensity activities were collected as stated by routine activities of daily life over the past year. These data were changed into metabolic equivalent/minutes/week (MET/min/week). 24
Blood pressure and anthropometric measurements
Skilled staff measured bodyweight using a digital scale (Seca 707) with a precision of 100 grams. Subjects had minimum clothes and were barefoot. Height was measured by a tape measure with an accuracy of 0.5 cm in the standing position without shoes and straightened shoulders. Body mass index (BMI) was computed. Trained staff measured the waist circumference (WC) in the umbilical region after a normal exhalation without pressure on the body surface in the standing position and with the most miniature clothing. They reported measurements to the nearest 0.1 cm.
Qualified physicians evaluated systolic blood pressure and diastolic blood pressure (SBP, DBP) using a standard mercury sphygmomanometer. They asked participants to rest for 15 min, and then the physician measured blood pressure in the sitting position while setting the cuff on the right arm. They repeated this operation twice with an interval of 30 sec. The average of two measures in the analysis was taken.
Biochemical analysis
Blood samples were collected between 7:00 to 9:00 a.m., after 12–14 hr of overnight fasting. The samples were centrifuged 30–45 min after collection. The technician analyzed blood samples using Selectra 2 auto-analyzer; they carried out all biochemical analyses at the TLGS research laboratory on the day of blood collection. They quantified fasting blood glucose (FBG) concentration using enzymatic colorimetric method and glucose oxidase technique (Vital Scientific, Spankeren, the Netherlands). Individuals on glucose-lowering drugs were excluded from the study at the study's baseline. At follow-up times, they performed the standard 2-hr postchallenge blood glucose test using oral administration of 82.5 gram glucose monohydrate solution (equivalent to 75 gram anhydrous glucose) for all individuals who were not on glucose-lowering drugs.
High-density lipoprotein cholesterol (HDL-C) concentration was evaluated after precipitation of the apolipoprotein B-containing lipoproteins with phosphotungstic acid. Triglyceride (TG) level was assessed by enzymatic colorimetric tests using glycerol phosphate oxidase (Pars Azmoon, Inc., Tehran, Iran). For glucose, inter- and intra-assay coefficients of variations were both 2.2%. For TG, inter- and intra-assay coefficients of variations were 1.6% and 0.6%, respectively. 25
Outcome definition
Incidence of T2D was determined as FBG concentrations ≥126 milligram/dL or 2-hr plasma glucose concentrations ≥200 milligram/dL or self-reported taking glucose-lowering drugs (oral diabetes medication or insulin injections). 19
Considering the high frequency of missing in the 2-hr blood glucose variable and for the sake of more accuracy, participants whose FBG level is lower than 90.9 milligram/dL and who do not use blood-lowering drugs are considered as nondiabetic 26 and subjects whose FBG level is ≥90.9 milligram/dL and their 2-hr blood glucose variable is missing, are categorized among the participants with missing data.
Statistical analysis
We performed statistical analyses using the Statistical Package for Social Sciences (version 21.0; SPSS). A two-sided value of P < 0.05 was considered statistically significant. We categorized data into quartiles of choline and betaine intakes. Chi-square test for categorical variables and one-way analysis of variance for continuous variables were used to compare the mean and frequency of participants' baseline characteristics and dietary intakes across quartiles of choline and betaine intakes. P for trend across choline and betaine intake categories was performed by assigning continuous variables in a linear regression model. The normality of variables was checked. Multivariable Cox proportional hazard regression analyses were performed to estimate the hazards ratio (HR) and 95% confidence interval (CI) of incident T2D across quartiles of choline and betaine intakes. The first quartile was assumed as the reference.
The median of each quartile was utilized as a continuous variable to estimate the P value of trends across quartiles of choline and betaine intakes in the Cox proportional hazard regression models. The confounders were selected based on the literature; also, we apply each confounder in the univariable Cox regression model; and a two-tailed value of P < 0.20 was practiced for specifying admission in the model. Time to event was defined as the time between baseline and the event date (for event cases) or the last follow-up (for censored participants), whichever occurred first. The event date was defined as the mid-time between the follow-up visit date at which T2D was detected for the first time and the most recent follow-up visit before the diagnosis. Study participants were censored owing to death, loss to follow-up, or nonoccurrence of T2D before the end of follow-up.
The Cox regression models were adjusted for several potential confounders. The analyses were performed with sex and age adjustment (model 1) and model 2 was adjusted for education levels (>14 and ≤14 years), smoking (never smoked, past smoked, and current smoker), BMI (continuous), physical activity (continuous), family history of T2D (yes, no), energy intake (continuous), TG/HDL ratio, fiber gram per 1000 kcal/day (continuous), polyunsaturated fatty acid, dairy, meats, egg, vitamin B12, folate, and coffee were added to model 1. In addition, multivariable Cox proportional hazard regression analyses were performed to estimate the HR and 95% CI of incident T2D in subgroups of sex, age, and BMI per 100 milligram/day of choline and betaine intakes. The proportional hazards assumption was verified using the Schoenfeld residuals test and plot of log [−log (survival)] versus log (time) to see if they are parallel.
Result
The mean age ± SD of 2707 men and 3315 women were, respectively, 41.4 ± 14.2 and 39.1 ± 13.1. During a median follow-up of 6.63 years, 528 cases of T2D incidence were diagnosed. General characteristics of participants across quartile categories of choline intake at baseline are given in Table 1. Participants in higher quartiles of choline intake were likely to be more physically active, and less likely to be smokers. Participants with higher intakes of choline had higher intakes of protein, fiber, and B12 and lower intakes of energy and carbohydrates. In addition, compared with people with low choline intake, people with higher choline intake had lower TG level, SBP, and higher HDL-C level at baseline.
Baseline Characteristics of Adult Participants of the Tehran Lipid and Glucose Study (N = 6022)
Values are given as mean ± SD unless otherwise listed.
Q, quartiles of choline intake; BMI, body mass index; BP, blood pressure; HDL, high-density lipoprotein cholesterol; MUFA, monounsaturated fatty acids; PUFA, polyunsaturated fatty acids; SFA, saturated fat.
Food group intakes based on quartiles of choline and betaine are given in Table 2. Individuals in the fourth quartile of choline intake had higher intakes of whole grains, legumes, meat, egg, vegetables, fruits, nuts and vegetable oil, but had lower intakes of refined grains, dairy, and animal fat. Furthermore, individuals in the fourth quartile of betaine intake had less consumption of dairy, vegetables, fruits, nuts, vegetable oil, and animal oil, whereas they consumed more whole grains and refined grains than the first quartile.
Dietary Food Group Intake of Participants According to Quartiles of Choline and Betaine Intake (N = 6022)
Data are given as grams per day (mean ± SD) unless otherwise listed using analysis of variance test.
After controlling for a wide range of confounders a significant positive association was observed between choline intake and the HR of T2D across quartiles of choline intake [HR (CI) in fourth quartile: 1.25 (1.14–1.38), P-trend = 0.01], but this significant finding was not reported for betaine intake, so the significant association between betaine intake and the HR of T2D disappeared after adjustment for several potential confounders (Table 3).
Hazard Ratios (95% Confidence Interval) of Type 2 Diabetes Incidence Across Energy-Adjusted Quartiles of Choline and Betaine Intakes
Multivariable Cox proportional hazard regression analyses were performed to estimate the hazards ratio and 95% confidence interval of incident T2D across quartiles of choline and betaine intakes. The analyses were performed with sex and age adjustment (model 1). Model 2 was adjusted for education levels (>14 and ≤14 years), smoking (never smoked, past smoked, and current smoker), BMI (continuous), physical activity (continuous), family history of T2D (yes, no), energy intake (continuous), TG/HDL ratio, fiber gram per 1000 kcal/day (continuous), polyunsaturated fatty acid, dairy, meats, egg, vitamin B12, folate, and coffee plus model 1.
T2D, type 2 diabetes; TG, triglyceride.
In our study, for every 100 milligram increase in choline consumption, the HR of T2D increased in all age, sex, and BMI subgroups significantly. So that for every 100 milligram increase in choline intake by male subjects, individuals aged ≥50 years and subjects with BMI <25, the HR of T2D increased ∼35% separately; this estimate was ∼25% for women, subjects aged <50 years and subjects with BMI ≥25. Increasing betaine intake had no significant effect on the HR of T2D in any of the subgroups (Table 4).
Hazard Ratios (95% Confidence Interval) of Diabetes Incidence per 100 Milligrams of Choline or Betaine Across Subgroups of Age, Sex and Body Mass Index
Multivariable Cox proportional hazard regression analyses were performed to estimate the HR and 95% CI of incident T2D in subgroups of sex, age and BMI per 100 milligram/day of choline and betaine intakes.
CI, confidence interval; HR, hazard ratio.
Discussion
Our findings showed a significant positive association between choline intake and the risk of T2D incidence across quartiles of choline intake. Also in this cohort study, choline consumption increased the risk of T2D 28% per 100 milligram/day and the risk of T2D increased significantly in all subgroups of gender, age, or BMI status. We observed no statistically significant association between dietary betaine intake and the risk of T2D in total population and subgroups.
The mechanism that can justify this positive association between choline consumption and risk of T2D is that choline is a major substrate for the production of trimethylamine by gut microbiome. Trimethylamine is oxidized to TMAO by hepatic enzyme flavin-containing monooxygenases. 27 TMAO caused a decrease in the expression of bile salts, so the regulation of glucose metabolism that is carried out by means of bile salts is disturbed. 28,29 In addition, TMAO obstructed hepatic insulin signal transduction and causes inflammation of adipose tissue. 30 Despite such a strong rationale for this positive association between choline intake and T2D, evidence for such association has been inconsistent. A number of cross-sectional and cohort studies have shown an inverse relation between dietary choline intake and the risk of T2D, 11,12 whereas in others this association was either not observed 31,32 or choline intake was associated with an increased risk of T2D. 33,34
In addition to the difference in study design, there are other factors that can cause these contradictions in results. There is an interindividual variability in the TMAO response to choline intake and this difference may be attributed to the composition of the gut microbiota. In such a way a study showed that Ruminococcaceae and Lachnospiraceae produce more TMA in comparison with other lineages. 35 The reason for this diverse composition of gut microbiota in different countries can be owing to the differences of food patterns in each country.
In the study by Zhou et al., 33 the odds of T2D increased in participants with choline intake ≥331.7 milligram/day, but individuals who received less than this amount, the risk of T2D did not change, whereas in our study, receiving per 100 milligrams of choline per day could increase the risk of T2D by 28%. This finding raises this hypothesis that the common dietary pattern in Iran increases the sensitivity to choline in this society by changing the composition of gut microbiota, so lower amounts of choline can increase the risk of T2D in our study, compared with the previous study.
The different effect of choline forms on TMAO response has been confirmed in studies. 35 The diversity in the dietary sources of choline could be another explanation for the existence of such contradictions in the results. In a European population animal food sources contributed most to choline intake, 36 but in our study vegetable foods, including fruits, vegetables, grains and legumes are also important sources of choline.
In our study, the HR of T2D increased with increasing choline intake in all subgroups of gender, age, or BMI status. Our results are in contradiction with the results of Dibaba et al.'s study, 31 in which there was a gender difference regarding the effect of choline intake on the risk of T2D in such a way that only in female consuming more choline was associated with a higher risk of T2D. Female use of S-adenosylmethionine instead of cytidylyl diphosphate choline for the synthesis of phospholipids, so the need for choline is more in men than in women and men are more sensitive to choline deficiency. However, the results of Tessitore et al.'s study showed that the response of women and men to higher intakes of choline will probably be similar and follow the same pattern. 37
To our knowledge, this is the first prospective study to examine the relationship between choline consumption and the risk of T2D in whole population and their subgroups in the Middle East. Strengths of our study include detailed information on potential confounders, long follow-up period of the study. Outcomes were not self-reported and were collected based on medical records. The FFQ applied in our study was also validated to assess dietary intake of foods that are sources of choline and betaine. Limitations include the single assessment of dietary intakes at baseline. The applied FFQ was not validated for choline and betaine, so we were not able to determine how effectively it estimates actual choline intake.
Another limitation was the estimation of choline and betaine using the USDA database. Because geographical location, temperature, and processing of food may impact the choline and betaine content of foods, the USDA database may not reliably reflect their intakes in our population. In addition, there are limited data for choline and betaine content in some foods in the USDA, which may cause an underestimation of total intake of choline and betaine.
T2D is a multifactorial disease caused by genetic and environmental factors including diet, physical activity, smoking, and other possible risk factors. Also there are interactions between dietary factors, genetics, and other risk factors. 38 The weak statistical relationship between choline and T2D may be attributable to other possible known risk factors that may contribute to the occurrence of T2D. 6 It is recommended to replicate this study in different population to find out consistency of these results.
Conclusion
In this cohort study, choline consumption increased the risk of T2D, 2% per 10 milligram/day in all population. Also the risk of T2D increased significantly in all subgroups of gender, age, or BMI status. We observed no statistically significant association between dietary betaine intake and the risk of T2D in total population and subgroups.
Footnotes
Acknowledgments
The authors thank the participants and the TLGS personnel for their collaboration. The authors also thank Prof. Farzad Hadaegh and their colleagues for developing the definition of nondiabetic people in Iran.
Authors' Contributions
Conceptualization, F.H.-E., M.G. and G.K.; Formal analysis, F.H.-E., M.G. and G.K.; Methodology, G.K. and F.H.E.; Supervision, F.A. and P.M.; Writing original draft, G.K. and F.H.-E.; Writing—review and editing, F.A. and P.M.
Data Sharing Statement
The datasets used and/or analyzed during this study are available from the corresponding author on reasonable request.
“All authors are primarily engaged in education or medical research and are not directly supported by the government.”
Author Disclosure Statement
The authors declare that they have no competing interests.
Funding Information
This study was supported by Research Institute for Endocrine Sciences, Shahid Beheshti University of Medical Sciences, Tehran, Iran (Grant No. 30054).