




Abstract
Background and Purpose:
Vitamin D can both stimulate and inhibit adipogenesis, indicating that associations of the vitamin D level with some metabolic disorders may be nonlinear. This cross-sectional study aims to explore potential nonlinear associations of the 25-hydroxy vitamin D [25(OH)D] level with metabolic syndrome (MetS) and its components.
Methods:
Adults without previously diagnosed specific noncommunicable disease were selected from the National Health and Nutrition Examination Survey 2017–2018 (n = 870). Their demographic, physical, and laboratory data were obtained. The associations of serum 25(OH)D with MetS and its components were analyzed using logistic regression. Restricted cubic spline was applied to flexibly model the nonlinear association if the nonlinearity test was statistically significant.
Results:
The 25(OH)D level was inversely associated with risk of MetS [adjusted odds ratio (OR) = 0.986; 95% confidence interval (CI) = 0.978–0.993] and most MetS components, but not with the risk of raised triglycerides (adjusted OR = 0.996; 95% CI = 0.988–1.005). The association of serum 25(OH)D with central obesity risk was significantly nonlinear (P for the nonlinearity test: 0.037). The OR for risk of central obesity decreased rapidly with increase in serum 25(OH)D concentration until the concentration reached 50 nmol/L, and then, the intensity of decrease in OR slowed down.
Conclusions:
Vitamin D is inversely associated with MetS, but not all MetS components. A nonlinear association between the vitamin D level and risk of central obesity has been found for the first time among the adult population, which reflects the complex roles of vitamin D in lipid metabolism. Although vitamin D deficiency (<50 nmol/L) was defined to avoid abnormal calcium and phosphorus metabolism, preventing its deficiency may also be beneficial for reduction of central obesity risk.
Introduction
Metabolic syndrome (
Vitamin D is mainly stored in adipose tissue and deficiency of this fat-soluble vitamin is associated with many adverse health outcomes, such as rickets, schizophrenia, and Alzheimer's disease. 4 Although vitamin D deficiency has been observed in individuals with MetS, 5 the exact association of the vitamin D level with risk of MetS (and its components) is still unknown: some studies have shown that a low vitamin D level is significantly associated with risk of MetS, 6 –8 while other studies have shown that vitamin D is not associated with MetS 8,9 and vitamin D supplementation is not beneficial to amelioration of most MetS components. 5
The reason for the inconsistent findings may be the complex roles of vitamin D in lipid metabolism, that is, vitamin D can both stimulate and inhibit adipogenesis. 10 Taking into account the complex roles, it may be appropriate to consider that the net effects of different vitamin D statuses on some metabolic disorders are different; in other words, associations between the vitamin D level and some metabolic disorders may be nonlinear.
The National Health and Nutrition Examination Survey (NHANES) is a major program of the National Center for Health Statistics (NCHS), Centers for Disease Control and Prevention (CDC). This survey began in the early 1960s and has become a continuous program focused on a variety of health and nutrition measurements since 1999. 11 In the present study, cross-sectional data from the latest complete survey of the NHANES program (2017–2018) were analyzed to examine potential nonlinear associations of the vitamin D level with MetS and its components among an adult population without previously diagnosed specific NCDs.
Materials and Methods
Study participants
The sampling for NHANES 2017–2018 is available in a published article. 12 In brief, it applied a complex four-stage design so that the sample can represent the total, noninstitutionalized, civilian U.S. population.
Participants of the present study were selected from NHANES 2017–2018 if they (a) were between 18 and 80 years of age because participants aged 80 and over were not distinguished in the survey; (b) were female and not pregnant at the time of the examination; (c) were not previously diagnosed with hypertension, prediabetes, DM, or high blood cholesterol to rule out any potential impact of medical advice on the association between vitamin D and MetS components; and (d) had complete physical and laboratory data for diagnosis of MetS. Steps of the selection are shown in Fig. 1.
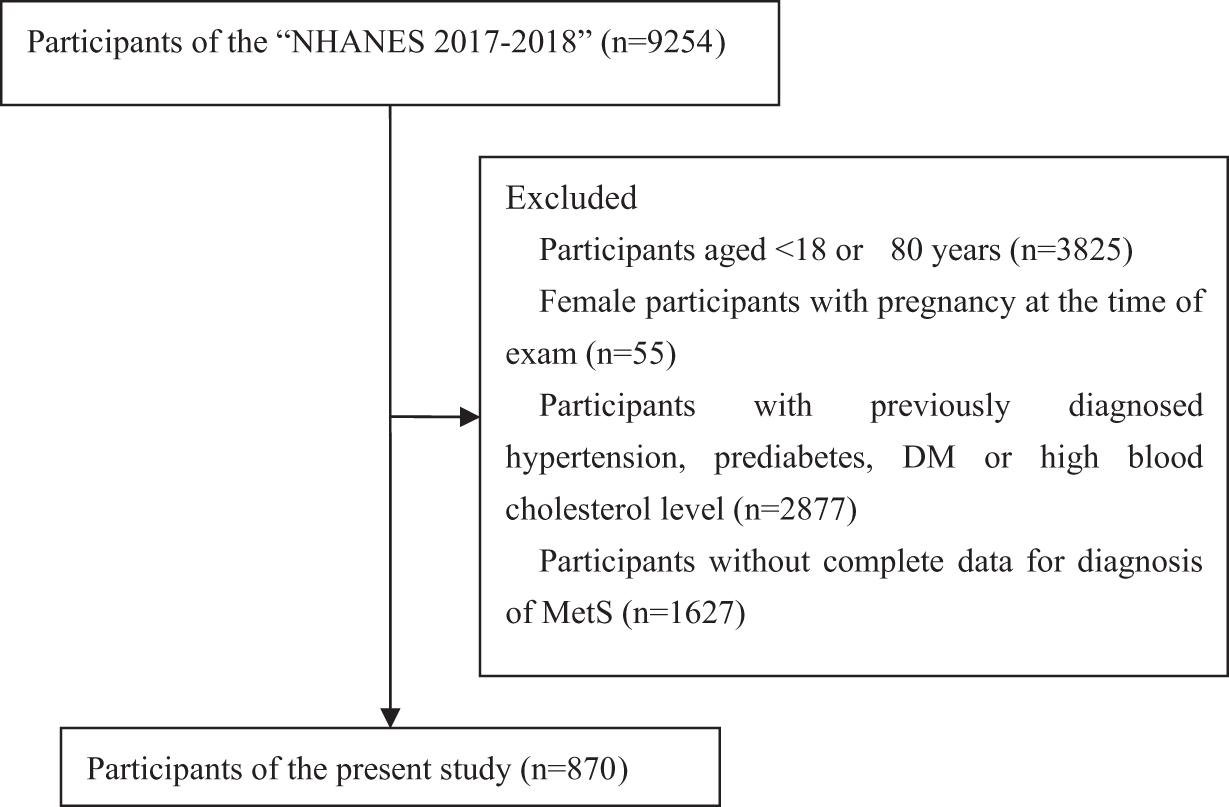
Selection of participants in the present study.
All procedures of NHANES 2017–2018 were approved by the NCHS Research Ethics Review Board and written informed consent was obtained from all study participants before the survey.
Demographic information and physical and laboratory measurements
The demographic, physical, and laboratory data and information on measurement methods, detection limits, and quality control are publicly available. 13 In brief, data included the following: information on gender, age, pregnancy and diagnoses of hypertension, prediabetes, DM, high blood cholesterol, weight, standing height, waist circumference, systolic and diastolic blood pressure, whole blood glycohemoglobin (HbA1c), fasting plasma/serum triglyceride (TG) and glucose, serum high-density lipoprotein cholesterol (HDL-C), and serum 25-hydroxy vitamin D2 and D3.
The body mass index (BMI) was calculated using weight and standing height, and the waist-to-height ratio (WHtR) was calculated using waist circumference and standing height.
Diagnostic criteria for vitamin D deficiency and MetS
The sum of serum 25-hydroxy vitamin D2 and D3 concentrations was considered as serum 25-hydroxy vitamin D [25(OH)D]. Serum 25(OH)D levels of <50, <75, and >250 nmol/L were applied to describe study participants with, respectively, deficient, insufficient, and overloaded vitamin D in the present study. 14
According to the International Diabetes Federation (IDF) consensus worldwide definition of MetS, 1 MetS was defined as central obesity plus at least two of the following four listed components: (a) raised triglycerides, which was defined as serum TG of ≥1.7 mmol/L (150 mg/dL); (b) reduced HDL-C, which was defined as serum HDL-C of <1.03 mmol/L (40 mg/dL) for males and <1.29 mmol/L (50 mg/dL) for females; (c) raised blood pressure, which was defined as systolic or diastolic blood pressure of ≥130 or ≥85 mmHg, respectively; and (d) raised fasting plasma glucose (FPG) or HbA1c, which was defined as FPG of ≥5.6 mmol/L (100 mg/dL) or HbA1c of ≥5.7% (the present study included HbA1c because both raised HbA1c and FPG were markers of abnormal glucose metabolism). 15
Central obesity was defined based on WHtR and the cutoff point was 0.60. 16 If BMI is >30 kg/m2, central obesity was also assumed. 1 The present study did not define central obesity based on waist circumference alone because it did not take differences in height into account. 16
Statistical analyses
The difference in weighted prevalence (weighted %) among subgroups was analyzed using the Rao–Scott chi-square test. Continuous variables are expressed as weighted mean with 95% confidence interval (CI) and standard error, and one-factor ANOVA was applied to analyze the difference among subgroups. Multivariate logistic regression was applied to analyze associations of the serum 25(OH)D level with MetS and its components.
Multivariate linear regression was applied to analyze associations of the serum 25(OH)D level with variables of MetS components (namely WHtR, serum TG, serum HDL-C, systolic and diastolic blood pressure, FPG, and whole blood HbA1c). Restricted cubic spline (RCS) with three knots at 5th, 50th, and 95th percentiles was applied to flexibly model associations of the serum 25(OH)D level with MetS, MetS components, and variables of MetS components if the nonlinearity test was statistically significant. 17
A value of P < 0.05 was considered to indicate statistical significance. All analyses were carried out using the Statistical Analysis System 9.4 (SAS Institute, Inc., Cary, NC, USA).
Results
A total of 870 participants were selected in the present study (Fig. 1). The crude prevalence of MetS was 18.5% (n = 161), and 73.8% (n = 642) of study participants had at least one MetS component (weighted % of the MetS component presence: 71.5%; 95% CI = 66.6%–76.4%). There was no significant difference in weighted prevalence of MetS among subgroups of gender, age, and ethnicity (all P values >0.05). Only 206 study participants had a normal serum 25(OH)D level, while 324 and 340 study participants suffered from vitamin D deficiency and insufficiency, respectively.
There was no study participant who had an overloaded vitamin D level and the highest 25(OH)D level was 191 nmol/L. The weighted prevalence of vitamin D deficiency and insufficiency was significantly different between two genders (P = 0.025) and among subgroups of age and ethnicity (both P < 0.001). The weighted prevalence of MetS, central obesity, and reduced HDL-C was significantly different among subgroups with different vitamin D status (all P values <0.01). The information on crude and weighted prevalence is presented in Table 1.
Weighted Prevalence Among Study Participants with Deficient, Insufficient, and Normal Vitamin D Levels
Mexican American and other Hispanic races.
Other non-Hispanic races, including non-Hispanic multiraces.
95% CI, 95% confidence interval; FPG, fasting plasma glucose; HbA1c, glycohemoglobin; HDL-C, high-density lipoprotein cholesterol; MetS, metabolic syndrome.
There was no significant difference in the weighted means of most variables of MetS components among subgroups with different vitamin D status (Table 2). The difference between crude and weighted means of variables of MetS components was slight, and the information on crude mean is presented in Supplementary Table S1.
Weighted Mean (95% Confidence Interval) of Variables of Metabolic Syndrome Components in Study Participants with Deficient, Insufficient, and Normal Vitamin D Levels
SE, standard error.
The overall associations of the serum 25(OH)D level with MetS, MetS components, and variables of MetS components are presented in Table 3. After adjusting for age and gender, most response variables were overall inversely associated with the serum 25(OH)D level, except for risk of raised TG, serum TG level, and diastolic blood pressure. Most associations were linear (P for the nonlinearity test >0.05). Associations of the serum 25(OH)D level with risk of central obesity (P = 0.037) and with the level of systolic blood pressure (P = 0.001) were significantly nonlinear, which indicated that RCS is suitable for modeling those associations.
Overall Associations of the Serum 25-Hydroxy Vitamin D Level (nmol/L) with Metabolic Syndrome, Metabolic Syndrome Components, and Variables of Metabolic Syndrome Components
The model was adjusted by age and gender.
Overall associations of the serum 25(OH)D level with MetS and its components were analyzed using logistic regression, and OR (95% CI) is presented; overall associations of the serum 25(OH)D level with variables of MetS components were analyzed using linear regression, and standardized beta is presented.
The nonlinearity test was applied for the multivariate-adjusted regression if there was a statistically significant association between the serum 25(OH)D level and the response variable. The nonlinearity test was not applied if there was no statistically significant association, and “—” indicates no nonlinearity test.
25(OH)D, 25-hydroxy vitamin D; OR, odds ratio.
The nonlinear associations are presented in Fig. 2. The odds ratio (OR) for risk of central obesity decreased rapidly with increase in serum 25(OH)D concentration until that concentration reached 50 nmol/L, and then, the intensity of decrease in OR slowed down until that concentration reached 151 nmol/L (OR = 0.381; 95% CI = 0.146–0.995). There was no significant association between risk of central obesity and serum 25(OH)D if the serum 25(OH)D concentration was ≥152 nmol/L, where the OR was 0.378, but the lower and upper limits of 95% CI were 0.143 and 1.002, respectively (Fig. 2A).

Nonlinear associations of the serum 25(OH)D level (nmol/L) with risk of central obesity and with systolic blood pressure (mmHg) modeled by restricted cubic spline. The reference value is the upper limit of vitamin D deficiency [50 nmol/L serum 25(OH)D]. Dashed curves indicate the 95% confidence interval. Age and gender were included as adjustment variables. (
The systolic blood pressure (mmHg) decreased rapidly with increase in serum 25(OH)D concentration until that concentration reached 82 nmol/L, where the systolic blood pressure was lowest [−2.258 mmHg (95% CI = −3.459 to −1.058), compared with the systolic blood pressure at 50 nmol/L serum 25(OH)D], and then, the systolic blood pressure slowly increased with increase in serum 25(OH)D concentration until that concentration reached 96 nmol/L, where systolic blood pressure was still 2.038 mmHg lower than systolic blood pressure at 50 nmol/L serum 25(OH)D (95% CI = −4.008 to −0.068).
There was no significant association between systolic blood pressure and serum 25(OH)D if the serum 25(OH)D concentration was ≥97 nmol/L, where systolic blood pressure was 2.012 mmHg lower than systolic blood pressure at 50 nmol/L serum 25(OH)D, but the lower and upper limits of 95% CI were −4.046 and 0.022 mmHg, respectively (Fig. 2B).
Discussion
The population with MetS shows an increased risk of T2DM and CVDs. Unfortunately, MetS and its components are more difficult to recognize than these NCDs because there may be no clear discomfort in the early stage of metabolic disorder. The primary purpose of the present study was to explore the potential nonlinear association of the vitamin D level with metabolic disorders, but not to report on the representative prevalence of MetS among the adult population. Based on this objective, our study participants were selected from NHANES 2017–2018.
Both crude and weighted MetS prevalence rates in the present study were far lower than prevalence among the general adult population 2,7 because the present study excluded those adults who were previously diagnosed with hypertension, prediabetes, DM, or high blood cholesterol. Although our study participants appeared to be healthier than the general adult population, their crude and weighted MetS prevalence rates were both over 15% and their crude and weighted prevalence rates of MetS component presence were both over 70%. These results indicate that the disease burden caused by undetected MetS may be unbearable among the adult population in the future.
The present results were consistent with the study using previous NHANES data, which showed that vitamin D status was significantly inversely associated with MetS among U.S. adults, 7 although there was slight difference in diagnostic criteria for some MetS components. However, the associations of vitamin D with MetS components appeared to be not always inverse (Table 3). As a frequent component of MetS, central obesity is a marker of lipid metabolism disorder, 18 and previous studies have shown both inverse and nonsignificant associations between the vitamin D level and risk of central obesity. 19 –23
The nonlinear association of central obesity with the vitamin D level, found by our study, may reflect the complex roles of vitamin D in lipid metabolism: on the one hand, vitamin D inhibits adipogenesis through increased expression of leptin and suppression of DKK1 and SFRP2, 24,25 but on the other hand, vitamin D stimulates adipogenesis through increased expression of FABP, LPL, and PPARγ. 26,27
The OR for risk of central obesity decreased rapidly with increase in serum 25(OH)D level in the range of 25(OH)D of <50 nmol/L (the cutoff point for vitamin D deficiency), which indicated that preventing vitamin D deficiency may also be beneficial for reduction of central obesity and MetS risks, although the deficiency was defined to prevent diseases caused by abnormal calcium and phosphorus metabolism, such as rickets and osteomalacia. 14
This nonlinear association was found for the first time among the adult population, at least among those adults without previously diagnosed hypertension, prediabetes, DM, or high blood cholesterol. Interestingly, our previous study also found a nonlinear association between central obesity and the vitamin D level among metropolitan adolescents in China (aged 10–18 years); however, the OR for risk of central obesity was different from the present study, especially in the range of vitamin D deficiency [serum 25(OH)D <50 nmol/L]. 28
The different results may reflect the difference in net effect of the same vitamin D concentration between adolescents and adults, and both studies indicated that the nonlinear association of the vitamin D level with some metabolic disorders should be considered to understand those previous inconsistent findings.
The present results also showed a nonlinear association between the vitamin D level and systolic blood pressure, which may be a reason why both positive and inverse correlations between those two variables were found in the adult population. 29,30 Although there was a study showing that hypertension may be triggered by metabolic disorders, and metabolic disorders are closely associated with low vitamin D status in some cases, 7,31 the cause–effect relationship between systolic blood pressure and the vitamin D level is hard to expound and their relationship may be mediated through some other factors, for example, central obesity. 32
Taking into account the fact that blood pressure monitoring is more convenient than testing serum 25-hydroxy vitamin D2 and D3 concentrations, and nearly 70% (weighted prevalence) of study participants suffered from vitamin D deficiency or insufficiency, the present results indicate that adults with abnormal systolic blood pressure should pay more attention to their vitamin D status.
Although the exact reason was unclear, our results showed that there was no significant association between serum 25(OH)D and TG, which was consistent with some studies 5,33 ; however, other studies showed a significantly inverse association between them among the adult population. 7,34 Our results added to the controversy in this field, and future interventional studies with larger samples deserve to be considered.
Similar to findings focused on the association between vitamin D and TG, inconsistent results of the association between vitamin D and blood glucose/HbA1c have also been reported. 5,35,36 Our adjusted results were consistent with studies that found an inverse association, 35,36 and the inverse association of 25(OH)D with both FBG and HbA1c was the reason why the inverse association of 25(OH)D with risk of raised FPG or HbA1c existed (Table 3).
The prevalence of raised FPG or HbA1c was highest among all MetS components (Table 1), and prevalence of raised FPG was still the highest (crude % = 44.7%; weighted % = 45.4%; 95% CI = 40.3%–50.5%) when HbA1c data were excluded. Both IDF and National Cholesterol Education Program Adult Treatment Panel III applied FPG of ≥5.6 mmol/L as the diagnostic criterion for raised FPG 1,7 and this cutoff point was equal to the FPG criterion for diagnosis of prediabetes. 15 HbA1c is also measured for diagnosis of prediabetes and it has several advantages compared with FPG, such as greater preanalytical stability and fewer day-to-day perturbations. 15
We considered that the greater cost and limited testing availability in developing regions (but not other reasons) resulted in exclusion of HbA1c for diagnosis of MetS. Therefore, our diagnostic criterion for MetS included the HbA1c level and the cutoff point was the HbA1c criterion for diagnosis of prediabetes (≥5.7%). Based on our diagnostic criteria, ∼50% of study participants suffered from undetected raised FPG or HbA1c (in other words, undetected glucose metabolism disorder), whether data were weighted or not (Table 1).
Unfortunately, the prevalence should be higher if the NHANES 2017–2018 included 2-hr PG oral glucose tolerance test. Taking into account the fact that cardiac dysfunction can be triggered in the stage of prediabetes, 37 our results indicated that glucose metabolism disorder may be the most serious risk factor for MetS-associated NCDs among the adult population.
There were some limitations in the present study. First, the cross-sectional data show that the cause and effect relationship between serum 25(OH)D and MetS/MetS components cannot be examined. Second, although exclusion of adults with previously diagnosed specific NCDs avoided the potential impacts of medical advice on the associations between response variables and serum 25(OH)D, the exclusion indicated that the prevalence of MetS and its components in our study participants must be lower than in the general adult population.
Conclusions
The present study found that vitamin D is inversely associated with MetS risk, but not all MetS components, among an adult population without previously diagnosed specific NCDs (hypertension, prediabetes, DM, and high blood cholesterol). A nonlinear association between the serum 25(OH)D level and risk of central obesity was found for the first time among that adult population, which may not only reflect the complex roles of vitamin D in lipid metabolism but also provide a new viewpoint to understand previous findings showing inconsistent associations between the vitamin D level and some metabolic disorders.
The OR for risk of central obesity decreased rapidly with increase in serum 25(OH)D level in the range of serum 25(OH)D <50 nmol/L (the cutoff point for vitamin D deficiency formulated to prevent abnormal calcium and phosphorus metabolism), which indicated that preventing vitamin D deficiency may also be beneficial for reduction of central obesity risk.
Footnotes
Acknowledgment
Ms. Beibei Liu from NINH, China CDC, provided assistance in the statistical analysis.
Authors' Contributions
Y.-X.G. conceived and designed the study. Y.-X.G. and C.K. analyzed and interpreted the data, drafted the article, and approved the final version of the article for submission.
Author Disclosure Statement
No conflicts of interest exist.
Funding Information
No funding was received for this article.
Supplementary Material
Supplementary Table S1
References
Supplementary Material
Please find the following supplemental material available below.
For Open Access articles published under a Creative Commons License, all supplemental material carries the same license as the article it is associated with.
For non-Open Access articles published, all supplemental material carries a non-exclusive license, and permission requests for re-use of supplemental material or any part of supplemental material shall be sent directly to the copyright owner as specified in the copyright notice associated with the article.
