




Abstract
Background:
Chronic kidney disease (CKD) has emerged as a significant global public health challenge, and the estimated glomerular filtration rate (eGFR) is widely used due to its convenience, low cost, and broad clinical applicability. Concurrently, insulin resistance (IR) serves as a crucial marker of metabolic disturbance, and alternative indicators have garnered increasing attention in CKD research in recent years.
Objective:
This study aims to investigate the relationship between IR-related indices (TyG index, TyG-BMI index, and TyG-WC index) and serum creatinine levels, as well as the eGFR, with the intention of uncovering their potential roles in the assessment of renal function.
Methods:
We analyzed nationally representative cross-sectional data from a cohort of individuals aged 45 and above in China, comprising 11,608 participants. Participants were categorized into different groups based on quartiles of the TyG index, and multiple factors, including gender, age, lifestyle, and co-morbidities, were adjusted for using linear regression models.
Results:
By linear regression, TyG, TyG-BMI, and TyG-WC indices were significantly positively correlated with serum creatinine and significantly negatively correlated with eGFR. Results showed similar trends when TyG, TyG-BMI, and TyG-WC indices were used as categorical variables. In the fully adjusted model, the highest quartile of serum creatinine was higher than the first quartile for TyG, TyG-BMI, and TyG-WC indices, with β values of 2.673, 3.67, and 1.937 mg/dL, respectively; the highest quartile of eGFR was lower than the first quartile, with β values of −2.4, −2.955, and −1.823 mL/min/1.73 m2. P values were statistically significant.
Conclusions:
This study indicates a consistent correlation between the TyG index and its related indices with serum creatinine levels and eGFR among the middle aged and elderly population in China. These findings suggest the potential utility of these indices in early screening and management of the risk of chronic kidney disease.
Introduction
Chronic kidney disease (CKD) has emerged as a significant global public health challenge impacting human well-being worldwide. 1,2 According to the Global Burden of Disease Study 2017 report, the global prevalence of CKD reached 697.5 million individuals in the year 2017, constituting ∼9.1% of the global population. It is projected that by the year 2040, CKD is expected to become one of the top five leading causes of death globally. 3 Against this backdrop, the glomerular filtration rate (GFR), as the most reliable comprehensive indicator of kidney function, plays a crucial role in clinical practice, research, and public health. 4
It is noteworthy that in August 2021, the National Institute for Health and Care Excellence (NICE) in the United Kingdom issued guidelines for the assessment and management of CKD. These guidelines emphasize the importance of measuring both serum creatinine levels and estimated GFR (eGFR) when evaluating kidney function in a laboratory setting. While isotopic clearance methods provide higher accuracy in measuring GFR, their complexity and cost render them less frequently used for primary diagnostic purposes. Consequently, GFR estimation formulas based on serum creatinine are more practical and commonly used in clinical settings. 5,6
In recent years, research has progressively unveiled the intricate link between insulin resistance (IR) and CKD. IR refers to an individual's inability to efficiently augment glucose uptake and utilization, which has emerged as one of the contributing risk factors for CKD progression. 7 Despite the gold standard status of the hyperinsulinemic-euglycemic clamp technique for assessing IR, its widespread application in large-scale epidemiological studies is limited due to its high cost and invasive nature. 8 On the contrary, in recent years, the Triglyceride-Glucose (TyG) index and its combinations with Triglyceride-Glucose body mass index (TyG-BMI) and Triglyceride-Glucose waist circumference (TyG-WC) have gained widespread use for the assessment of IR. 9 –11 An increasing body of research suggests that these alternative IR indices not only demonstrate strong performance in assessing IR but also exhibit certain advantages in evaluating the occurrence and progression of diseases such as coronary artery calcification, 12 nonalcoholic fatty liver disease, 9 hypertension, 13 diabetes, 14 diabetic nephropathy, 15 liver fibrosis, 16 and CKD. 17,18
This study aims to investigate the relationship between TyG index, TyG-BMI, TyG-WC, serum creatinine levels, and eGFR in a sample of Chinese middle-aged and elderly individuals. By delving into the potential role of these indices in kidney function, the study aims to offer new perspectives and insights for the early diagnosis and prevention of CKD. Through a nationally representative sample, we aspire to underscore the significance of these indices in CKD research, providing robust support for future clinical practice and the formulation of public health policies.
Materials and Methods
Study population
The data for this study were derived from the China Health and Retirement Longitudinal Study (CHARLS), which is funded by the National Natural Science Foundation of China. CHARLS aims to collect high-quality microlevel data representing Chinese individuals and households aged 45 and above. The project seeks to comprehensively analyze the challenges posed by population aging in China, facilitate interdisciplinary research, and provide a more scientifically informed basis for policy formulation. CHARLS conducts follow-up surveys every 2–3 years, with blood samples collected only in 2011 and 2015.
To enhance the effectiveness of the cross-sectional study, we selected data from the first wave (2011) and third wave (2015) of CHARLS. After rigorous screening, a total of 11,608 participants were included in our analysis (Fig. 1).
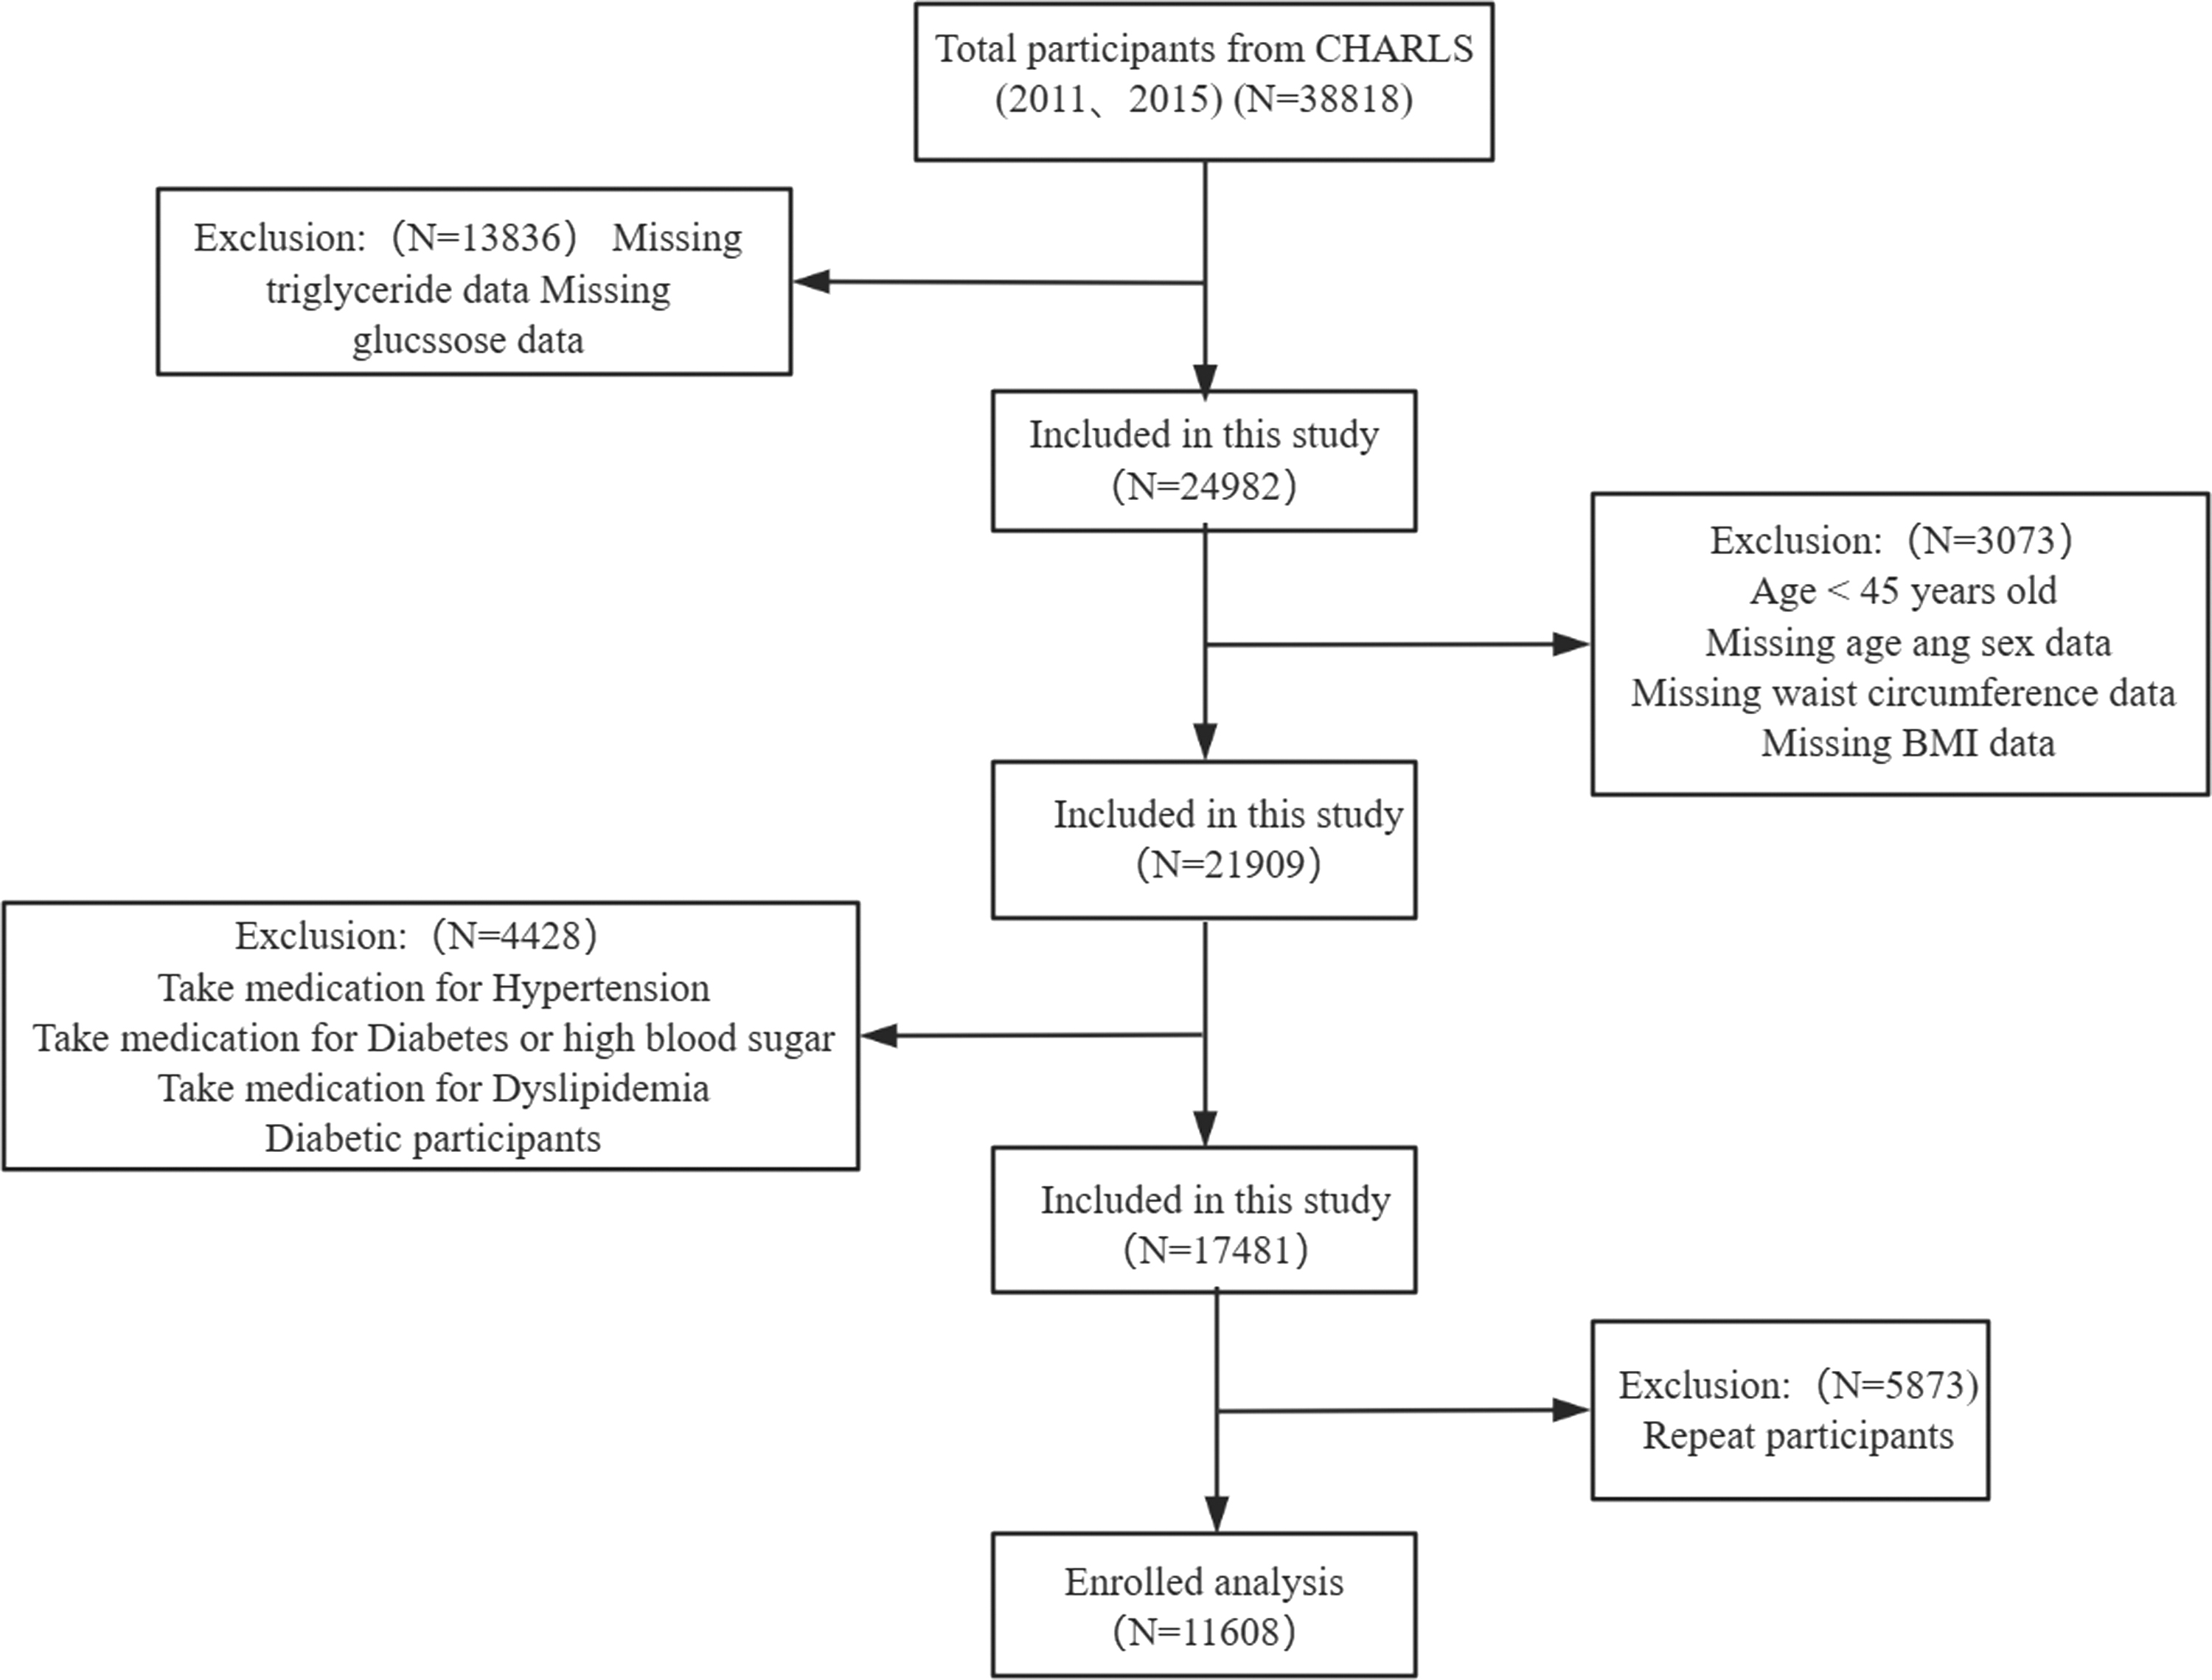
Flow chart of the screening process for the selection of eligible participants. BMI, body mass index.
Before they participated in the study, all participants provided informed consent by signing a consent form. The ethical approval for data collection in CHARLS was obtained from the Biomedical Ethics Review Committee of Peking University (IRB00001052-11015). Only individuals who provided written informed consent were included in the study.
Data collection and definitions
Population data were collected using standardized questionnaires, including information on age, gender, smoking status, alcohol consumption, and personal medical history (hypertension, diabetes, and dyslipidemia). Trained staff performed physical measurements, including height, weight, WC, systolic blood pressure (SBP), and diastolic blood pressure (DBP). Blood pressure measurements were conducted using the HEM7200 electronic monitor (Omron (Dalian) Co., Ltd., Dalian, China), with three measurements taken for each participant and the average recorded. Fasting venous blood samples were collected from participants and stored at −80°C for subsequent biochemical analyses, including serum creatinine, blood glucose, triglycerides, high-density lipoprotein (HDL), low-density lipoprotein (LDL), and total cholesterol (TG). Diabetes was defined as self-reported diabetes, use of antidiabetic medications, or fasting blood glucose ≥7.0 mM. Hypertension was defined as blood pressure exceeding 140/90 mmHg (average of three measurements) or self-reported hypertension.
All data collected by CHARLS were stored at the National School of Development, Peking University, China Center for Economic Research, and made available to global researchers on the CHARLS project website (charls.ccer.edu.cn).
Calculation of eGFR was performed using the 2021 nonrace equation developed by the Chronic Kidney Disease Epidemiology Collaboration (CKD-EPI), which utilizes serum creatinine levels, gender, and age. 19 BMI was calculated using the formula weight (in kilograms) divided by the square of height (in meters) (kg/m2). The calculation formula for the TyG index is TyG = Ln [(TG × FBG)/2], where TG and fasting blood glucose are measured in milligrams per deciliter. The TyG-BMI index is calculated as TyG × BMI, and the TyG-WC index is calculated as TyG × waist circumference (in centimeters).
Covariates
In addition to considering sociodemographic characteristics, we accounted for health-related factors based on existing knowledge. These factors included age, gender, BMI, smoking status, alcohol consumption, physical activity, and the presence of conditions such as hypertension and dyslipidemia. 12,20 –23 In addition, the use of medication for hypertension was included as a covariate in our analysis.
Statistical analysis
Quantitative variables were presented as mean ± standard deviation (SD), and categorical variables were expressed as numbers (percentages). The comparisons between different quartiles of TyG indices were performed using the chi-squared test or Kruskal–Wallis H test.
The association between TyG indices and serum creatinine levels, as well as eGFR, was evaluated using multivariate linear regression models. Three models were used: Model I, which was unadjusted; Model II, adjusted for gender and age; and Model III, adjusted for gender, age, BMI, hypertension, dyslipidemia, smoking status, alcohol consumption, physical activity, and medication for hypertension.
Furthermore, we used restricted cubic spline (RCS) curves based on Model III to explore potential nonlinear relationships between TyG indices and serum creatinine levels, as well as eGFR. In addition, subgroup analyses were conducted based on gender, age, BMI, smoking status, alcohol consumption, and physical activity to assess whether these factors modified the impact of TyG indices on serum creatinine levels and eGFR.
All data analyzed were using the statistical package R and Empower (R). A two-tailed P < 0.05 was considered to be statistically significant.
Results
Participant baseline characteristics based on TyG index quartiles
A total of 11,608 participants were included in this study. Participants were divided into four groups based on TyG index quartiles: Q1 ≤ 8.17, 8.17 < Q2 ≤ 8.52, 8.52 < Q3 ≤ 8.91, Q4 > 8.91. Table 1 presents the baseline characteristics of the participants. Individuals with higher TyG index values tended to belong to the obese population with higher BMI and waist circumference compared to those in the lowest quartile. Moreover, significant differences in biochemical parameters were observed among the groups. Participants with higher TyG index values had significantly elevated levels of SBP, DBP, GLU, CREA, CHO, TG, and LDL, while conventional HDL cholesterol showed a negative correlation with the TyG index. Notably, the proportion of individuals with hypertension and dyslipidemia was significantly higher in the high TyG index group (both P < 0.001).
Demographic and Clinical Characteristics According to Triglyceride Glucose Index Level
SBP, systolic blood pressure; DBP, diastolic blood pressure; BMI, body mass index; WC, waist circumference; eGFR, estimated glomerular filtration rate; TyG index, triglyceride glucose index; TyG-BMI, triglyceride glucose-body mass index; TyG-WC, triglyceride glucose-waist circumference; HDL, high-density lipoprotein; LDL, low-density lipoprotein.
Relationship between TyG index and related parameters with creatinine
RCS analysis demonstrated a stable positive correlation between the TyG index and related parameters with creatinine, as shown in Fig. 2. Table 2 presents the β values and 95% confidence intervals (CIs) for the TyG index, TyG-BMI, and TyG-WC with creatinine under different models.
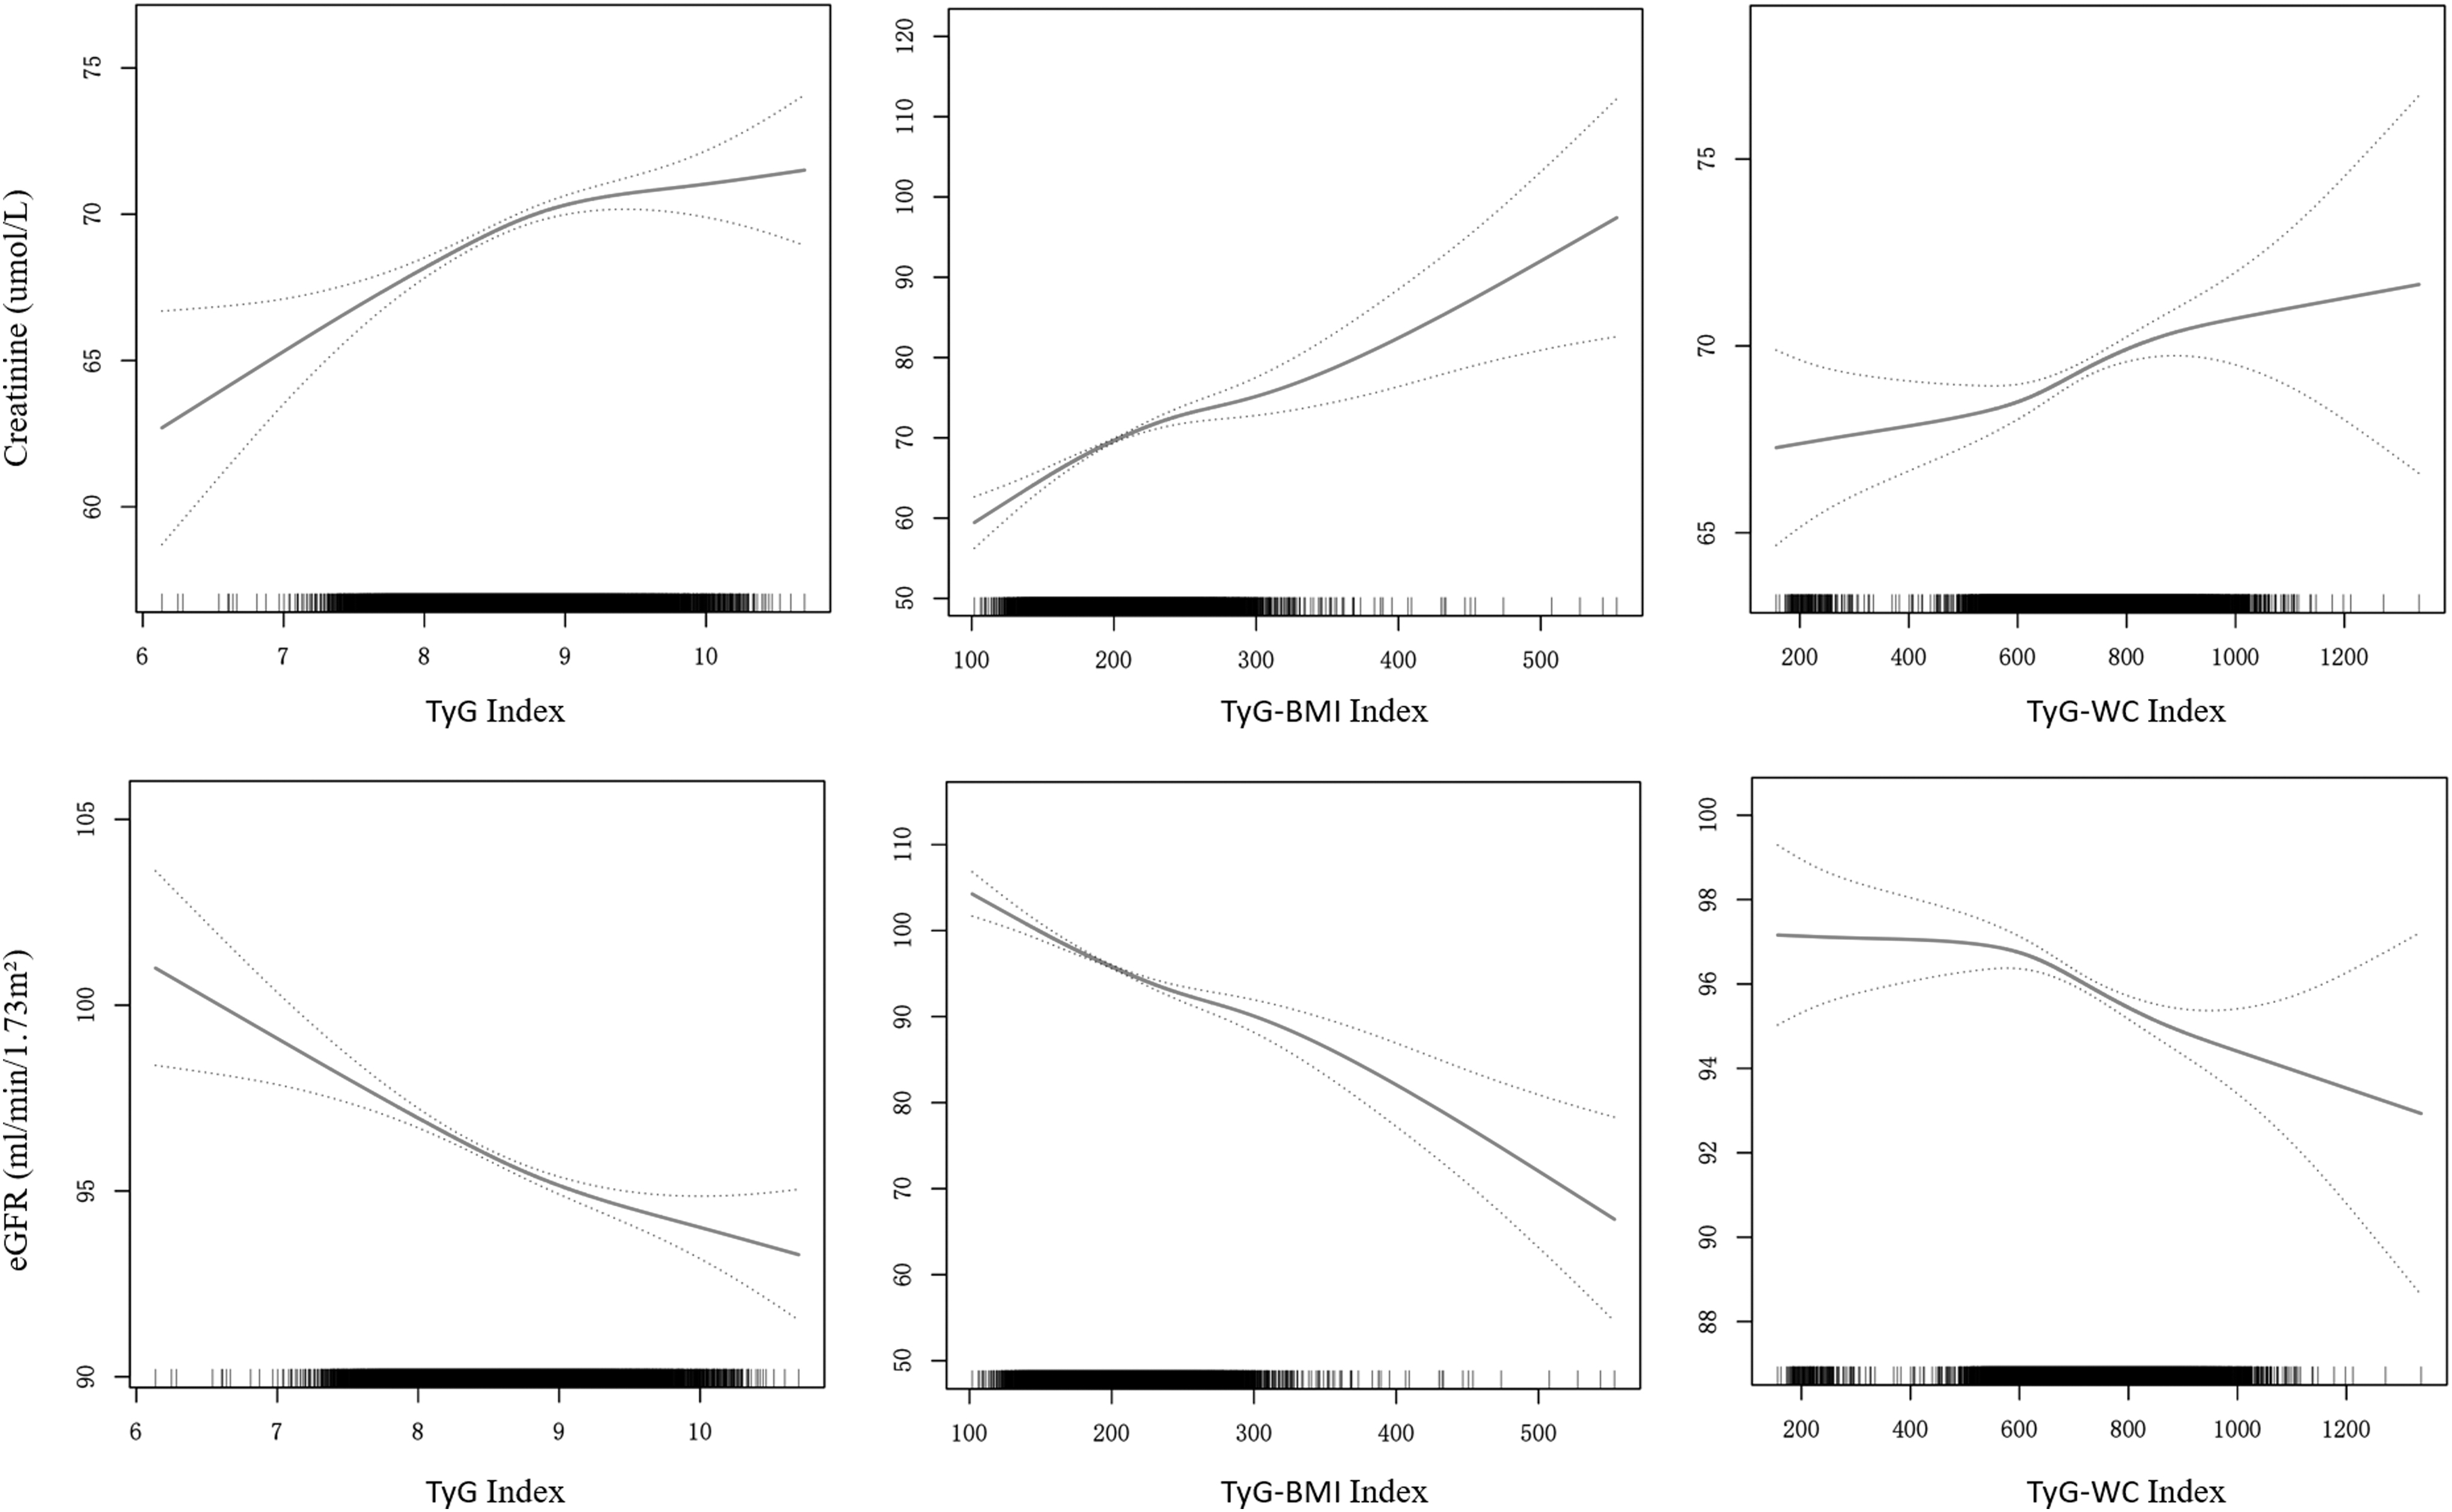
Restricted cubic spline fitting was performed for TyG, TyG-BMI, and TyG-WC index and creatinine and eGFR levels. The curve fitting process was based on an adjusted model II incorporating the following covariates: Age, Sex, BMI, Hypertension, BMI, Hypertension treatment, Exercise, Smoking, and Drinking. eGFR, estimated glomerular filtration rate; TyG index, triglyceride glucose index; TyG-BMI, triglyceride glucose-body mass index; TyG-WC, triglyceride glucose-waist circumference.
Multivariate Regression Analysis of Triglyceride Glucose, Triglyceride Glucose-Body Mass Index, and Triglyceride Glucose-Waist Circumference Index with Creatinine
Nonadjusted for: None.
Model I adjust for: Age, Sex.
Model II adjust for: Age, Sex, BMI, Hypertension, BMI, Hypertension treatment, Exercise, Smoking, Drinking.
The linear regression model indicated that, after controlling for factors such as gender, age, BMI, hypertension, dyslipidemia, antihypertensive medication, smoking, alcohol consumption, and physical activity, each unit increase in TyG index was associated with a change of 1.827 mg/dL in creatinine levels (95% CI: 1.302–2.352 mg/dL, P < 0.001). The results demonstrated that the TyG index remained independently positively correlated with creatinine across different adjustment models (unadjusted, β = 1.073, 95% CI: 0.5–1.646; adjustment 1, β = 2.226, 95% CI: 1.725–2.727; adjustment 2, β = 1.827, 95% CI: 1.302–2.352, P < 0.001). Subgroup analysis revealed that, compared to the first quartile of TyG index, the adjusted β values for the second, third, and highest quartiles were 1.311 (95% CI: 0.522–2.1 mg/dL, P < 0.01), 2.269 (95% CI: 1.466–3.072 mg/dL, P < 0.001), and 2.673 (95% CI: 1.853–3.493 mg/dL, P < 0.001), respectively.
After model adjustments, an independent positive correlation was observed between the TyG-BMI index and creatinine (adjustment 1, β = 0.029, 95% CI: 0.021–0.036; adjustment 2, β = 0.072, 95% CI: 0.051–0.094, P < 0.001). Following adjustments, significant differences in creatinine levels were observed between the other three quartiles (Q2, Q3, Q4) of the TyG-BMI index and the reference Q1 group (P < 0.001 for all).
An independent positive correlation was observed between the TyG-WC index and creatinine (unadjusted, β = 0.006, 95% CI: 0.003–0.008; adjustment 1, β = 0.008, 95% CI: −0.006 to 0.01; adjustment 2, β = 0.005, 95% CI: 0.002–0.008, P < 0.001). In the adjustment 1 model, significant differences in creatinine levels were observed between the other three quartiles (Q2, Q3, Q4) of the TyG-WC index and the reference Q1 group (P < 0.05 for all). In the adjustment 2 models, significant differences in creatinine levels were also observed between the Q3 and Q4 groups compared to the Q1 group (P < 0.01 for both).
Relationship between TyG index and related parameters with eGFR
After adjusting for gender, age, BMI, hypertension, dyslipidemia, antihypertensive medication use, smoking, alcohol consumption, and physical activity, TyG index, TyG-BMI, and TyG-WC were all significantly negatively correlated with eGFR (Table 3 and Fig. 2). With each unit increase in TyG index, TyG-BMI, and TyG-WC, eGFR decreased by −1.66 mL/min/1.73 m2 (95% CI: −2.08 to −1.24 mL/min/1.73 m2, P < 0.001), −0.067 mL/min/1.73 m2 (95% CI: −0.085 to −0.05 mL/min/1.73 m2, P < 0.001), and −0.005 mL/min/1.73 m2 (95% CI: −0.007 to −0.002 mL/min/1.73 m2, P < 0.001), respectively.
Multivariate Regression Analysis of Triglyceride Glucose, Triglyceride Glucose-Body Mass Index, and Triglyceride Glucose-Waist Circumference Index with Estimated Glomerular Filtration Rate
Nonadjusted for: None.
Model I adjust for: Age, Sex.
Model II adjust for: Age, Sex, BMI, Hypertension, BMI, Hypertension treatment, Exercise, Smoking, Drinking.
Subgroup analysis indicated that, compared to the first quartile of the TyG index, the adjusted β values for the second, third, and highest quartiles were −1.072 (95% CI: −1.701 to −0.043 mL/min/1.73 m2, P < 0.01), −1.844 (95% CI: −2.483 to −1.204 mL/min/1.73 m2, P < 0.001), and −2.4 (95% CI: −3.053 to −1.746 mL/min/1.73 m2, P < 0.001), respectively. In the case of the TyG-BMI index, all three other quartiles (Q2, Q3, Q4) showed significant negative correlations in the adjusted models compared to the Q1 group (P < 0.01 for all). Similarly, for the TyG-WC index, the adjusted models revealed significant negative correlations with eGFR, and all other quartiles (Q2, Q3, Q4) showed significant differences compared to the Q1 group (P < 0.05 for all).
Subgroup analysis
We conducted subgroup analyses based on gender, age, BMI, smoking, alcohol consumption, and physical activity to evaluate the correlations between TyG index, TyG-BMI, TyG-WC, and serum creatinine, as well as eGFR across different subgroups (Table 4). The results indicated significant positive correlations between the TyG index, TyG-BMI, and serum creatinine in various subgroups. Concurrently, the TyG index, TyG-BMI, and eGFR displayed significant negative correlations across different subgroups. TyG-WC also exhibited a significant positive correlation with serum creatinine across various subgroups, except for the subgroup with a BMI less than 18.5, where the relationship was the opposite. Although the P value was >0.1, it lacked statistical significance.
Subgroup Analysis of Associations Between Triglyceride Glucose, Triglyceride Glucose-Body Mass Index, Triglyceride Glucose-Waist Circumference Index and Creatinine and Estimated Glomerular Filtration Rate
Analysis was adjusted for Age, Sex, BMI, Hypertension, BMI, Hypertension treatment, Exercise, Smoking, and Drinking. (Model II) when they were not the strata variables.
The above finding demonstrates the evident associations between the TyG index, TyG-BMI, TyG-WC, and both serum creatinine and eGFR. Through analyses encompassing multiple models and subgroups, we confirmed the stability and independence of these associations, thereby reinforcing the potential role of these indices in the assessment of renal function.
Discussion
This nationwide representative cross-sectional study aimed to explore the interrelationships between TyG, TyG-BMI, TyG-WC, serum creatinine, and eGFR levels. Our study findings revealed significant positive correlations between TyG, TyG-BMI, TyG-WC, and serum creatinine levels in the Chinese population aged 45 and above. Furthermore, after adjusting for factors such as gender, age, lifestyle, and co-morbidities, we observed a distinct negative correlation between these indices and eGFR levels. These associations were statistically significant.
Indeed, the kidneys play a multifaceted and crucial role within the human body. They are responsible for a range of vital functions, including the metabolism and excretion of substances, maintaining fluid volume and blood pressure balance, synthesizing erythropoietin to stimulate red blood cell production, and regulating acid-base balance, as well as the homeostasis of bone and minerals. 24 Assessing the overall function of the kidneys is a complex task. Among the various functions of the kidneys, glomerular filtration is a significant aspect. GFR is considered the most reliable indicator for the comprehensive assessment of these functions, as reductions in other functions are generally correlated with a decrease in GFR. 25
However, measuring GFR is a time-consuming, labor-intensive, and expensive process that is not commonly used, making it unsuitable as a primary clinical diagnostic tool. To enhance the prediction and management of kidney diseases, the Kidney Disease: Improving Global Outcomes (KDIGO) organization has recommended the use of eGFR as a relevant indicator for assessing kidney function in their CKD guidelines. The advantage of eGFR lies in its cost-effectiveness, simplicity of operation, and widespread applicability on a global scale. 26
Furthermore, eGFR estimated using various creatinine-based equations has been validated in CKD-related research. It is currently used in clinical practice to assess changes in kidney function and predict the time to end-stage renal failure. 27 –29 Therefore, despite the limitations of GFR measurement methods, eGFR remains a crucial indicator for assessing kidney function in clinical practice due to its simplicity and widespread applicability. It plays a significant role in predicting and monitoring the progression of kidney disease.
For a long time, serum creatinine has been widely used to assess kidney function. However, the use of serum creatinine relies on several key assumptions, including the assumption that creatinine is freely filtered by the glomeruli of the kidneys and that its production and excretion remain relatively constant under certain conditions. 30 However, these assumptions may not always hold in practical applications. For example, certain medications such as cimetidine and trimethoprim may lead to falsely elevated serum creatinine levels, thereby potentially distorting an accurate reflection of the true GFR. 31 –33 Therefore, the relationship between serum creatinine levels and GFR is characterized by a general correlation.
Nevertheless, despite this, compared to other markers of renal function, utilizing serum creatinine for GFR assessment still retains certain advantages, one of which is its widespread availability and cost-effectiveness on a global scale. 34 Currently, several manufacturers have introduced portable point-of-care devices designed for measuring creatinine levels. These portable devices enable on-site creatinine level measurements even in resource-limited settings. 35 In 2021, a collaborative effort between the National Kidney Foundation (NKF) and the American Society of Nephrology (ASN) resulted in a reevaluation of the use of eGFR. For adults with a kidney function above 85%, they recommended the use of the CKD-EPI creatinine-based equation (CKD-EPIcr) for eGFR estimation, which does not take into account race, aiming to provide a more accurate assessment of kidney function. 36
IR is physiologically defined as a reduced responsiveness of insulin-targeted tissues to elevated physiological levels of insulin, leading to the pancreas being unable to secrete sufficient insulin to maintain blood glucose balance. 37 This phenomenon is considered a pathogenic driving factor in many modern diseases, including metabolic syndrome, obesity, diabetes, hypertension, and coronary heart disease. 38,39 Reports indicate that the number of patients with chronic diseases globally, associated with IR, is rapidly increasing. 40,41 Although the hyperinsulinemic-euglycemic clamp technique is considered the gold standard for assessing IR, its high cost and invasive nature make it less suitable for large-scale epidemiological studies. 42
For these reasons, homeostatic modeling to assess insulin resistance (HOMA-IR) has been used as an alternative tool to define IR. However, both HOMA-IR calculations use fasting glucose and fasting insulin, which are costly and limited in measurement in clinical applications. 43 In recent years, several novel and readily available alternative indices have been proposed, including the TG/HDL-C ratio, the visceral adiposity index, and the TyG index.
Since the proposal of TyG index by South American authors, many studies in Asia have been related to the value of TyG index in assessing IR through a large amount of data. 44 Previous studies have shown that the TyG index is even superior to traditional IR indices in assessing IR conditions and has advantages in assessing the onset and progression of many diseases. 2 Currently, the TyG index has become an easily accessible and attractive option for assessing IR status. In clinical practice, the TyG index based on fasting glucose and fasting triglyceride levels has emerged as a novel, rational, and reliable indicator of IR with promising applications. 45,46
Furthermore, obesity plays a significant role in the pathophysiology of IR. Therefore, the TyG index is often combined with other obesity indicators, such as BMI, WC, and waist-to-hip ratio, to collectively assess the severity of IR. Several studies have evaluated the effectiveness of TyG and its related parameters, such as TyG-BMI or TyG-WC, in predicting IR, further substantiating the potential of these indices. 47 –49 BMI only indicates general obesity and does not differentiate body mass, whereas WC is an indicator of central obesity, and there is growing evidence that central obesity plays a greater role in the development of IR. 49
Our study primarily aimed to investigate the relationship between the TyG index and its related parameters with serum creatinine and eGFR levels. However, we did not delve further into exploring the connection between the TyG index and related parameters with CKD. This limitation arises from conducting a cross-sectional study using a secondary database, which cannot ensure that individual participants' eGFR remained consistently below 60 mL/min/1.73 m2 for more than 3 months. This discrepancy does not align with the criteria set by the Kidney Disease Improving Global Outcomes (KDIGO) for diagnosing CKD.
In our subgroup analysis comparing individuals who consume alcohol with those who do not, we observed that as TyG and TyG-BMI indices increased, the decrease in eGFR was relatively smaller. This finding is consistent with previous research, which has indicated that moderate alcohol consumption may not be detrimental to the kidneys and is not associated with CKD. 50 The prospective study conducted by Chang et al. also highlighted a significant association between male gender and an increased risk of eGFR decline. 51 In addition, a cross-sectional study conducted by Shi et al. among hypertensive patients in China revealed a significant correlation between the TyG index and increased risk of CKD. This suggests that the TyG index could serve as a predictive factor for CKD risk in hypertensive patients. 52 Another cohort study conducted by Xu et al. in Lanzhou, China, demonstrated that the highest quartile of TyG index was associated with a 1.815-fold increased risk of CKD compared to the lowest quartile. This further reinforces the link between kidney function and CKD risk. 53
Furthermore, Liu et al.'s study demonstrated a strong association between elevated METS-IR and decreased eGFR, while Wang's observations revealed that participants in the highest quartile had a 3.032-fold higher risk of experiencing a mild eGFR decline compared to those in the lowest quartile. 54,55 Our study findings are consistent with the aforementioned research, indicating that as TyG and related indices increase, serum creatinine levels also increase, and eGFR gradually declines. This further corroborates the declining trend in kidney function among the corresponding population.
Although the exact mechanisms linking the TyG index to CKD remain elusive, a plethora of studies have demonstrated a strong interrelation between CKD and IR. In instances of CKD induced by metabolic disorders, IR often assumes a pivotal role, initiating a state of elevated blood glucose levels and subsequently giving rise to mild inflammation and fibrosis. The emergence of IR further complicates glucose utilization within adipocytes, leading to perturbations in lipid profiles and alterations in fasting blood glucose levels. 56,57 The TyG index, composed of lipid and glycemic factors, is closely associated with IR.
Strengths and Limitations
In summary, this study made important progress in several ways. First, this study included data from a large sample of middle-aged and older adults from many regions of China, making the findings relatively reliable. Second, the correlations between TyG, TyG-BMI, and TyG-WC with serum creatinine, as well as eGFR, were further clarified by stepwise adjusting the model to reduce the potential effects of confounders. These findings have broad applicability and can be used to perform preliminary renal function assessment in most Chinese populations. Third, we performed subgroup analyses based on conditions such as gender and age to verify the stability of the model.
It is important to note that this study has certain limitations. First, due to its cross-sectional design, the study can only reveal correlations between TyG, TyG-BMI, TyG-WC, serum creatinine, and eGFR levels. Further prospective research is required to establish the actual causal relationships. Second, the data relied on questionnaires, and some information may lack precision. Moreover, the study findings are specific to the Chinese population and may not be generalizable to other regions. Finally, only antihypertensive medications were included, excluding the impact of other drugs that might influence serum creatinine levels, lipid profiles, and glucose metabolism, potentially leading to data incompleteness. In conclusion, we encourage future research to incorporate these potential factors for a more comprehensive exploration of the subject matter.
Conclusion
In a nationally representative sample of Chinese middle-aged and elderly individuals, this study concludes that there is a consistent correlation between TyG, TyG-BMI, TyG-WC indices, and serum creatinine and eGFR levels. Furthermore, these indices exhibit promising potential in predicting eGFR decline in the Chinese middle-aged and elderly population. While further in-depth research is needed to validate these findings, TyG and its related indices hold promise as valuable monitoring tools for use in early screening, primary prevention, as well as diagnostic and therapeutic management strategies to address chronic kidney disease.
Footnotes
Acknowledgment
The authors thank the communities and data collection teams for their support in carrying out the study.
Authors' Contributions
Q.W., D.L., and J.H. designed and directed the study. L.Z. and L.J. participated in data collection. L.L. and Z.X. participated in data analysis. All authors read and approved the final article.
Author Disclosure Statement
No conflicting financial interests exist.
Funding Information
No funding was received for this article.