




Abstract
Objective:
We aimed to evaluate the performance of predicting metabolic syndrome (MS) using body composition indices obtained by quantitative computed tomography (QCT).
Methods:
In this cross-sectional study, data were collected from 4745 adults who underwent QCT examinations at a Chongqing teaching hospital between July 2020 and March 2022. Visceral adipose tissue (VAT), subcutaneous adipose tissue (SAT), total abdominal fat (TAT), abdominal muscle tissue (AMT), and liver fat content (LFC) were measured at the L2–L3 disc level using specialized software, and the skeletal muscle index (SMI) were calculated. The correlations between body composition indicators were analyzed using the Pearson correlation analysis. Receiver operating characteristic (ROC) curve analysis and area under the curve (AUC) were used to assess these indicators' predictive potential for MS.
Results:
VAT and TAT exhibited the best predictive ability for MS, with AUCs of 0.797 [95% confidence interval (CI): 0.779–0.815] and 0.794 (95% CI: 0.775–0.812) in males, and 0.811 (95% CI: 0.785–0.836) and 0.802 (95% CI: 0.774–0.830) in females. The AUCs for VAT and TAT were the same but significantly higher than body mass index and other body composition measures. SAT also demonstrated good predictive power in females [AUC = 0.725 (95%CI: 0.692–0.759)] but fair power in males [AUC = 0.6673 (95%CI: 0.650–0.696)]. LFC showed average predictive ability, AMT showed average predictive ability in males but poor ability in females, and SMI had no predictive ability. Correlation analysis revealed a strong correlation between VAT and TAT (males: r = 0.95, females: r = 0.89). SAT was strongly correlated with TAT only in females (r = 0.89). In the male group, the optimal thresholds for VAT and TAT were 207.6 and 318.7 cm2, respectively; in the female group, the optimal thresholds for VAT and TAT were 128.0 and 269.4 cm2, respectively.
Conclusions:
VAT and TAT are the best predictors of MS. SAT and LFC can also be acceptable to make predictions, whereas AMT can only make predictions of MS in males.
Introduction
Metabolic syndrome (MS) is a set of cardiovascular disease risk factors, 1,2 which mainly includes abdominal obesity, elevated blood pressure, elevated blood glucose, elevated triglyceride (TG) levels, and low high-density lipoprotein cholesterol (HDL-C) levels. 3 Despite variations in definitions, MS increases the risk of cardiovascular disease by ∼1.5- to 2-fold, 4 and the incidence of diabetes increases by at least 5-fold. 3 In addition, MS is also associated with other health problems such as chronic kidney disease, 5 fatty liver, 6 and cancer. 7,8 In recent years, data from a national population-based nutrition and health survey showed that the standardized prevalence of MS reached 31.1%. 9 MS has become a serious public health challenge. Therefore, early detection of MS patients is crucial for the prevention of cardiovascular disease and the promotion of population health.
Visceral fat is known to play a central role in promoting the development of MS, 7,10 and studies have shown that visceral fat accumulation is more likely to occur in Asian populations. 11 Another hallmark of MS is the deposition of fat in non-adipose organs, such as the liver. A meta-analysis indicated a strong association between liver fat content (LFC) and MS. 12 Although studies have demonstrated that visceral fat and hepatic steatosis are key factors in MS, current definitions of MS do not encompass visceral and hepatic fat, and it is unclear whether other metrics in the definitions include the effects of visceral and hepatic fat.
In addition, studies have shown that muscle mass is independently associated with MS. 13 And skeletal muscle mass increasing may have a protective impact against MS development. 14 However, studies related to the effect of subcutaneous adipose tissue (SAT) on metabolic status have had mixed results. Some studies suggested that SAT increases cardiometabolic risk. 15 –17 In a German study, increased visceral adipose tissue (VAT) and SAT, and high LFC led to increased metabolic risk. 18 However, in another study, VAT was associated with an increased risk of cardiometabolic risk factors in Chinese adults, whereas SAT was not. 19 Therefore, measuring body composition indices is essential for evaluating patients with MS. Specifically, identifying patients with the greatest metabolic risk before symptoms and implementing appropriate interventions will lead to better health care outcomes.
Computed tomography (CT) and magnetic resonance imaging (MRI) can accurately detect visceral fat distribution; 20 however, measurements are less comparable between them due to differences in methods and instrumentation. The bioelectrical impedance analysis (BIA) method has been widely used to estimate body composition. 21 Although it has been shown that visceral fat based on BIA measurements can help predict MS, 22,23 the influence of gender, body mass index (BMI), or age can cause variations between VAT measured by BIA and CT/MRI. 21,24 Therefore, using BIA-measured VAT to assess MS risk may have some limitations.
The use of quantitative computed tomography (QCT) can accurately and comprehensively quantify the mass and distribution of subcutaneous fat, visceral fat, and muscle. Compared with traditional semi-quantitative CT, QCT allows for comparison between different CT scanners, which is conducive to multicenter large sample studies. 25 Studies have reported that visceral fat, based on QCT measurements, is strongly associated with metabolic unhealthiness in Chinese adults. 26 Many studies in different populations have shown that QCT body composition indexes can effectively predict MS. Studies have shown that VAT can identify one or more metabolic risk factors; 27 Pickhardt et al. showed that total abdominal fat (TAT), VAT, and SAT have good efficacy for MS predicting in both men and women. 28
Therefore, the purposes of this study were to assess the efficacy of the abdominal fat, liver fat, and muscle mass in the identification of MS based on body composition measurements of QCT, to complement and validate existing studies, and to provide a reference for early identification and intervention of MS.
Materials and Methods
Study population
In the present study, participants were selected among those who had undergone QCT examinations from July 2020 to March 2022 at the Second Affiliated Hospital of Chongqing Medical University. Inclusion criteria were as follows: (1) age older than 18 years; (2) complete health status indicators, including anthropometric measurements of height, weight, waist circumference (WC), and blood pressure, and biochemical measurements of fasting blood glucose (FBG), TG, total cholesterol, and HDL-C; (3) subjects with informed consent. A total of 4745 subjects were enrolled in the study after the exclusion of 1528 subjects with missing data or outliers from the initial 6273 subjects who underwent a physical examination.
The research was approved as Clinical Trial 2020 (261) by the ethics committee of the Second Affiliated Hospital of Chongqing Medical University. Informed consent was obtained from all participants before their participation.
Body composition indicator measurement
TAT, VAT, abdominal muscle tissue (AMT), and LFC were measured using a 64-detector row CT scanner (Siemens, SOMATOMgo. Top, Germany). The L2/3 level was chosen for CT scanning because studies have shown that VAT at this level correlates best with the overall fat area. 29 The scan data were transferred to the Mindways QCT software (QCT PRO V6.1) and were measured by a trained and qualified radiologist. The same level of SAT was calculated by subtracting VAT from the TAT. The final measurement value of LFC was determined by calculating the mean value from the four regions of interest drawn on the liver parenchyma. Specific details of the measurement methods have been described in previous literature. 30 In addition, the skeletal muscle index (SMI) was calculated by dividing the cross-sectional area of the psoas muscle (in square centimeters) at the level of the third lumbar vertebra by the square of the subject's height (in meters). 31
Diagnostic criteria for MS
According to the Chinese Guidelines for the Prevention and Control of Type 2 Diabetes 2020 Edition (CDS 2020), individuals who satisfied three or more of the specified criteria were classified as having MS. 32 (1) abdominal obesity: WC ≥90 cm for males and ≥85 cm for females; (2) hyperglycemia: FBG ≥6.1 mmol/L or blood glucose ≥7.8 mmol/L for 2 hr after glucose load and/or those who have been diagnosed and treated for diabetes; (3) hypertension: blood pressure ≥130/85 mmHg and/or those who have been confirmed and treaded for hypertension; (4) fasting TG ≥1.70 mmol/L; (5) fasting HDL-C < 1.04 mmol/L.
Statistical analyses
Data were double-entered using EpiData, version 20.0, and statistical analyses were performed using IBM SPSS statistical software, version 25.0 (IBM Corporation, Armonk, New York, NY, USA), and MedCalc software, version 20.0 (Ostend, Belgium). The Kolmogorov–Smirnov test was used to assess the normal distribution of the variables. Continuous variables are defined as the mean ± standard deviation for normally distributed data. The Student's t-test was used to compare the groups. Pearson's correlation analysis was used to examine the relationship between the variables. Receiver operating characteristic (ROC) curve analysis was used to evaluate the predictive ability of QCT-based body composition indexes for MS patients. The results are presented as the area under the curve (AUC) and 95% confidence intervals (CI). Furthermore, Youden's J statistic, which was based on the equation Jmax = Sensitivity + Specificity – 1, was utilized to determine the ideal cutoff value for body composition indices. 33 At P values <0.05, differences were deemed statistically significant.
Results
Basic characteristics of the study population
This study involved 4745 people in total (2650 males and 2095 females). 20.02% of people had MS (26.23% of males and 12.17% of females). Age, weight, WC, BMI, blood pressure, serum lipid indexes (except HDL-C), and body composition parameters were substantially higher in the MS group compared with the non-MS group (Table 1) for all genders. All P values were <0.05.
Characterization of Different Indices by Gender and Metabolic Syndrome
AMT, abdominal muscle tissue; BMI, body mass index; DBP, diastolic blood pressure; FPG, fasting plasma glucose; HC, hip circumference; HDL-C, high-density lipoprotein cholesterol; LDL-C, low-density lipoprotein cholesterol; LFC, liver fat content; MS, metabolic syndrome; QCT, quantitative computed tomography; SAT, subcutaneous adipose tissue; SBP, systolic blood pressure; SMI, skeletal muscle index; TAT, total abdominal fat; TC, total cholesterol; TG, triglycerides; VAT, visceral adipose tissue; WC, waist circumference.
ROC curve analysis
The results of the ROC curve analysis of the QCT-based body composition indices for predicting MS are shown in Figs. 1 and 2. We found that in the male group, VAT and TAT had the largest AUCs of 0.797 (95% CI: 0.779–0.815, P < 0.001) and 0.794 (95% CI: 0.775–0.812, P < 0.001), and the optimal cutoffs for VAT and TAT were 207.6 and 318.7 cm2, respectively. The sensitivity and specificity for VAT were 76.83% and 67.83%, while for TAT they were 67.48% and 77.49%, respectively. In comparison, the predictive ability of LFC, SAT, and AMT was average (0.6 < AUC <0.7), while that of SMI was poor (AUC <0.6); details of these findings are presented in Table 2.
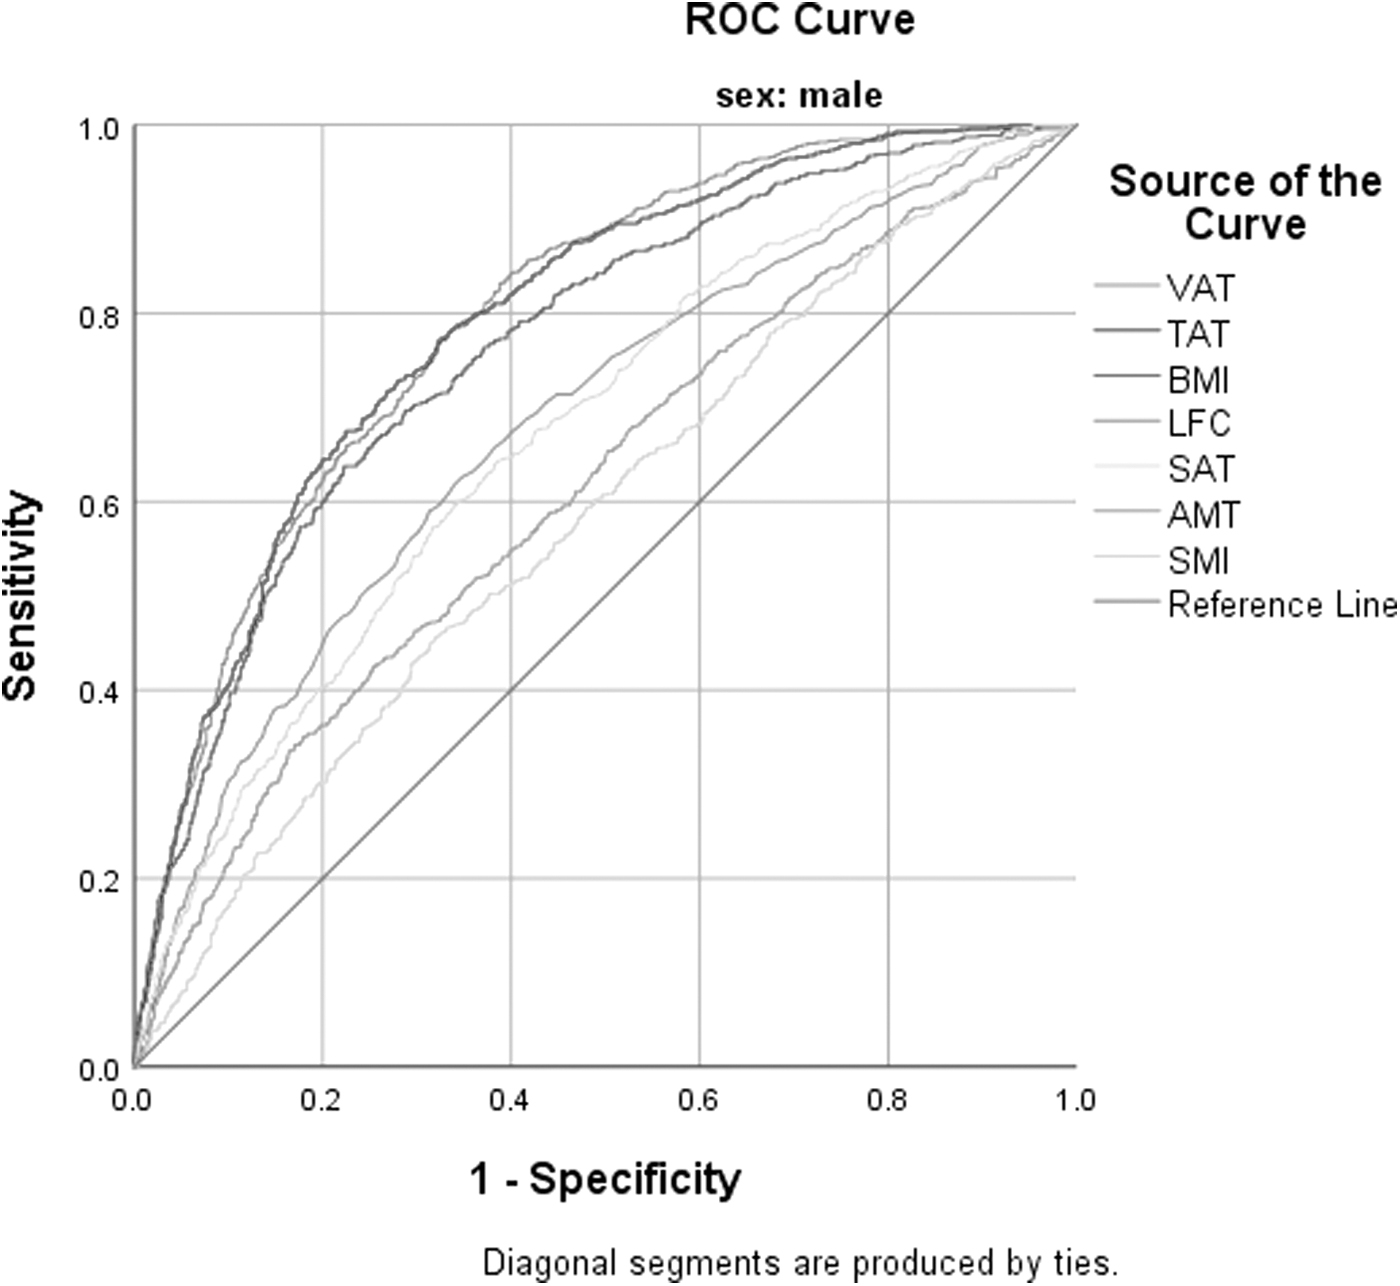
ROC curves for each index for identifying MS in males. AMT, abdominal muscle tissue; BMI, body mass index; LFC, liver fat content; MS, metabolic syndrome; ROC, receiver operating characteristic; SAT, subcutaneous adipose tissue; SMI, skeletal muscle mass index; TAT, total abdominal fat; VAT, visceral adipose tissue.
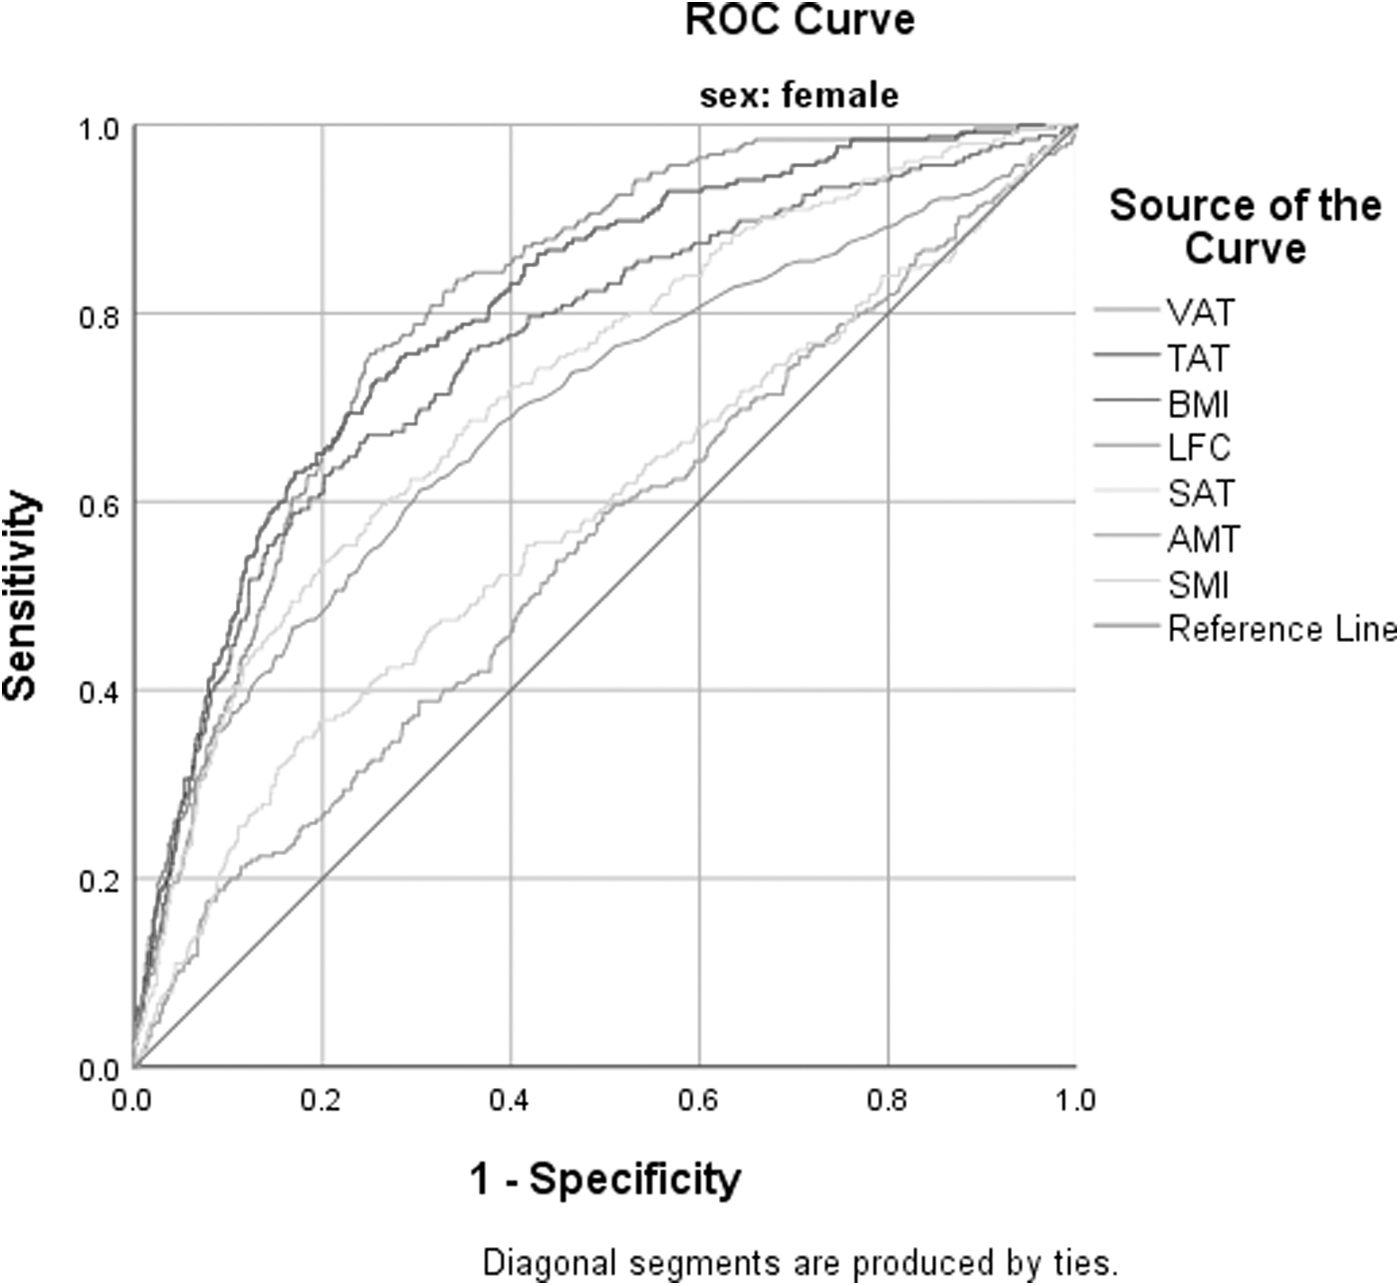
ROC curves for each index for identifying MS in females.
Area Under the Receiver Operating Characteristic Curve, Optimal Threshold, Sensitivity, Specificity, and Youden's Index for Different Metrics
AUC, area under the curve.
In the female group, VAT and TAT again had the largest AUCs of 0.811 (95% CI: 0.785–0.836) and 0.802 (95% CI: 0.774–0.830), with optimal cutoff values of 128.0 and 269.4 cm2 for VAT and TAT, respectively. Sensitivity and specificity for VAT were 75.69% and 75.0%, and for TAT they were 72.55% and 74.73%, respectively. SAT also had good predictive ability for MS in women, with an AUC of 0.725 (95% CI: 0.692–0.759). In comparison, the predictive power of LFC was average (0.6 < AUC <0.7), whereas AMT and SMI had poor predictive power (AUC <0.6), details of which are shown in Table 2.
Furthermore, no statistical differences were observed between the AUCs of VAT and TAT in either males or females, and the AUC values of VAT were significantly greater than those of BMI as well as other body composition measures.
Correlation between body composition indexes
As shown in Table 3. In the male group, VAT showed a strong correlation with TAT (r = 0.95), a moderate correlation with SAT (r = 0.52) and LFC (r = 0.39), but no correlation with AMT and SMI. TAT demonstrated a strong correlation with SAT (r = 0.76), a moderate correlation with LFC (r = 0.39), but no correlation with AMT and SMI. In the female group, VAT was strongly correlated with TAT (r = 0.89), moderately correlated with SAT (r = 0.58) and LFC (r = 0.3), weakly correlated with AMT (r = −0.11) but not correlated with SMI. TAT was strongly correlated with SAT (r = 0.89), weakly correlated with LFC (r = 0.28), but not correlated with AMT and SMI.
Pearson's Correlation Coefficients for Visceral Adipose Tissue, Total Adipose Tissue, and Other Body Composition Measures in Male and Female Groups
P < 0.01.
P < 0.5.
Discussion
In this study, we examined the ability of QCT-based body composition parameters including the abdominal fat, liver fat, and abdominal muscle to predict MS. Our results suggest that QCT body composition measurements are valuable for the prediction of MS, where VAT and TAT are the best predictors of MS.
Fat is not only involved in energy storage but also regulates the body's endocrine and metabolic functions. Studies have shown that the accumulation of visceral fat is closely connected to MS. 34,35 Although WC is commonly used to measure central obesity, it does not distinguish between subcutaneous and VAT. 36 A Korean study showed that VAT measured by computed tomography was a better predictor of MS than WC and BMI. 37 Another study also showed that VAT and SAT can effectively predict individuals at risk for MS. 38 Our results support the important predictive value of VAT and TAT for MS, but SAT has average predictive value in males and good predictive value in females. Consistent with the results of our study, Zhang et al. also showed that SAT had good predictive efficacy for MS in females (AUC = 0.81), whereas it had average predictive efficacy in males (AUC = 0.69). 25
The difference in the predicted effect of SAT between genders may be because women are more likely than men to hoard subcutaneous fat rather than visceral fat. 39 Moreover, our correlation analyses of body composition indices also showed that VAT and TAT correlated more strongly with SAT in females than in males, reflecting to some extent the fact that SAT is better at predicting MS in females than in males. Pickhardt et al. showed that TAT, VAT, and SAT had good identification efficacy for MS in both men and women (men: AUC = 0.891, 0.857, 0.808, women: AUC = 0.922, 0.902, 0.874). 28
The differences in the predictive effectiveness of SAT between the referenced study and ours may be not only due to the inconsistency in the sample size and age composition of the study population but also due to the different diagnostic criteria for the MS and the level of CT scans used in the above study, with the International Diabetes Federation (IDF) criteria and selected L1 level for fat quantification. However, other researchers have found that SAT is not associated with cardiovascular risk factors 19 or that a correlation exists but is not as strong as the correlation of VAT with cardiovascular risk factors. 17 It has even been shown that SAT is a protective factor for metabolic health status in obese individuals. 26 Therefore, the relationship between subcutaneous fat and metabolic status among different populations deserves further investigation.
In addition, the critical values of VAT in our study were 207.65 cm2 in males and 128.05 cm2 in females, whereas the critical values in the study of Zhang et al. were slightly higher (males: cutoff = 212.71 cm2, females: cutoff = 136.80 cm2) compared with our result. 25 The variation in these values may be attributed to differences in the study populations and the use of BMI ≥25 kg/m2 as a diagnostic criterion for abdominal obesity as defined by the MS in their study. The cutoff values for VAT were significantly lower in another study (142 cm2 in men and 115 cm2 in women), 27 but their study differed from the MS diagnostic criteria we used, and ours appeared to be more stringent, resulting in discrepancies in the results. In conclusion, our data further support previous studies on the ability of visceral fat to identify MS and indicate that the specific cutoff points of visceral fat measured by QCT in different ethnic and gender groups have important clinical and economic value for risk assessment of MS.
Metabolic fatty liver disease shares many risk factors and hazards with MS, and nonalcoholic fatty liver disease is considered a hepatic manifestation of MS. 40,41 A study revealed that QCT-derived LFC can help identify MS (AUC = 0.738, 95% CI: 0.718–0.759). 28 However, our results showed that the AUC of LFC to identify MS was slightly lower than that of the above-mentioned study. The difference in the results may be due to the inconsistency of the criteria for diagnosis of MS, as the above study was based on the IDF criteria, and the variation in results may also be due to the inconsistency of the ethnicity and age composition of the study population.
Similar to our study, the study by Yuyang Zhang et al. also showed that the predictive value of quantitative liver fat indicators were lower than that of VAT and TAT. 25 Furthermore, our study showed that LFC was moderately correlated with VAT and TAT, and a previous study also showed that hepatic steatosis was moderately correlated with visceral fat (Normal group: r = 0.42, Obese group: r = 0.57), 42 suggesting that LFC may have a relatively low predictive value for MS compared with VAT and TAT. In another study, hepatic steatosis was found to be indicative of MS and could be used as a screening tool for MS in community work, but that study used ultrasound to assess steatosis, whereas we used QCT to measure hepatic fat content. Therefore, future studies need to reveal the processes and effects of ectopic fat accumulation on metabolic risk in various populations.
It has been suggested that increased skeletal muscle mass is associated with MS. 28 Some findings suggest that the insulin-resistant effects of skeletal muscle may contribute to MS. 43 The simple explanation for this is that obese individuals may have more muscle and are therefore more likely to suffer from MS. In our study, muscle mass had limited predictive value for MS. Consistent with our results, the study by Lv et al. also demonstrated the low predictive power of SMI for MS (AUC ≈0.53). 26 Moreover, our analyses showed no correlation between muscle mass and abdominal fat, suggesting that muscle mass may not play a role in predicting MS. Whereas another longitudinal study has shown that low skeletal muscle density and SMI are linked to the development and course of MS. 44
In other studies, it has been shown that increased skeletal muscle has a potential preventative effect on the development of MS. 14 Mechanisms of the protective effects on muscle mass may be due to myokine secretion, glucose utilization, and ectopic fat accumulation. 45,46 So further research are needed to better comprehend the mechanisms by which fat and muscle affect metabolic risk.
This study provides further evidence of the potential utility of body composition indices obtained using QCT technology. It explores the usefulness of automated tests for fat, muscle, and liver fat for MS screening and prediction. These findings have significant implications for both public health and clinical practice. In addition, the use of CT scans for other investigations could be added, as these body composition indices can be obtained simultaneously without the need for additional scans, providing benefits to individuals while reducing the burden on the health care system.
However, the limitations of this study have to be recognized. First, the study population was from the hospital physical examination population, which may limit its application in other populations. Second, the existence of several different diagnostic criteria for MS means that using only the CDS (2020) criterion may produce different results. Furthermore, we did not assess postprandial blood glucose, which may lead to underdiagnosis in some diabetic patients. Therefore, further studies should collect more comprehensive data from different populations and compare different definitions of MS.
Conclusions
Among the QCT-based body composition indices, VAT and TAT are the best predictors of MS. LFC and SAT have average predictive ability, whereas AMT have average predictive ability only in males for MS. SMI have no predictive ability for MS. But further studies are needed to validate the performance of QCT body composition indexes in predicting MS.
Footnotes
Acknowledgment
The authors thank all the researchers for their valuable contributions, with special thanks to Tan Lingli and Duan Weiqian for their help with the study, and all the participants for their support.
Authors' Contributions
All authors listed have greatly contributed to the article. C.L. performed the literature review, data analysis, and article writing. B.X. reviewed and revised the first draft. M.C. organized the raw data. Y.Z. oversaw the writing process and made final revisions.
Data Availability Statement
The original data supporting the findings of this article are available by contacting the authors.
Author Disclosure Statement
No conflicting financial interests exist.
Funding Information
This research was funded by the Intelligent Medicine Research Project of Chongqing Medical University (Grant No: ZHYX202024).