




Abstract
Aims:
To explore whether the triglyceride to high-density lipoprotein cholesterol ratio (TG/HDL-C) was independently associated with the risk of incident type 2 diabetes mellitus (T2DM) in a large Japanese cohort.
Methods:
A secondary analysis was performed using open-access data from a retrospective cohort study. A total of 12,716 eligible participants who had standard medical examinations at the Murakami Memorial Hospital were included in this study. New-onset T2DM was the main outcome during follow-up. The risk of T2DM based on the TG/HDL-C ratio was evaluated using Cox regression analysis and Kaplan–Meier analysis. Subgroup analysis was performed to understand further the significance of the TG/HDL-C ratio in particular populations. To assess the potential of the TG/HDL-C ratio for predicting T2DM, a receiver operating characteristic (ROC) analysis was performed.
Results:
One hundred fifty new-onset T2DM cases were observed during a median follow-up of 5.39 years. The incidence of T2DM increased with a rise in the TG/HDL-C ratio based on the Kaplan–Meier curves (P < 0.0001). After controlling for potential confounding variables, the TG/HDL-C ratio was positively related to incidence of T2DM (hazard ratio = 1.08, 95% confidence interval: 1.01–1.15, P = 0.0239). In subgroup analysis, those with a body mass index of ≥18.5 and <24 kg/m2 showed a significantly positive relationship. The area under the ROC curve for the TG/HDL-C ratio as a T2DM predictor was 0.684. The optimal TG/HDL-C ratio cutoff value for T2DM was 1.609, with a sensitivity of 54.7% and a specificity of 73.6%.
Conclusion:
The authors' results showed a significant relationship between the TG/HDL-C ratio and the incidence of T2DM in the Japanese population.
Introduction
Type 2
T2DM is largely attributed to insulin resistance (IR), which is defined as an insufficient physiological response to insulin. 2,3 There are some direct and indirect techniques for assessing IR at present. DeFronzo44 developed the hyperinsulinemic-euglycemic clamp test, which is considered the gold standard for assessing IR. However, due to its time-consuming, costly, and invasive nature, it is not suitable for use in large-scale epidemiological studies or routine clinical evaluations. Thus, identifying simple biomarkers associated with IR could be crucial in detecting individuals at risk of developing T2DM. Earlier studies 5,6 have shown that a high ratio of triglycerides to high-density lipoprotein cholesterol (TGs/HDL-C) increases the risk of IR and metabolic syndrome.
Multiple investigations have revealed the TG/HDL-C ratio to be positively associated with IR, and the TG/HDL-C ratio exhibited a superior ability to predict IR than either HDL-C or TG alone. 7 –9 Similarly, several studies have shown that higher TG and lower HDL-C levels are independently related to the development of T2DM. 10 –13 Recently, Chen et al. 14 proved that the TG/HDL-C ratio was closely related to the incidence of T2DM among Chinese individuals.
Some researchers, however, have highlighted interethnic differences in IR and lipid profiles. 15,16 The results of previous studies investigating the relationship between the TG/HDL-C ratio and the incidence of T2DM have been contradictory. 15,17 According to a small-scale study, 18 the TG/HDL-C ratio was not a reliable indicator of IR among African Americans. Furthermore, recent studies 19 –21 have mostly focused on Chinese populations. The objective of this study was to determine whether the TG/HDL-C ratio was independently associated with incident T2DM in a large Japanese cohort.
Materials and Methods
Data source
This study used data from the Dryad database (https://datadryad.org/). The providers have waived all copyright and ownership of the data on the website in terms of allowing free download. Data can be obtained from the cited article: Ectopic fat obesity presents the greatest risk for incident T2DM: a population-based longitudinal study 22 (dataset: 10.5061/dryad.8q0p192). The variables in the database file are as follows: sex, age, body weight, body mass index (BMI), fatty liver, smoking status, alcohol consumption, exercise habits, systolic blood pressure (SBP), diastolic blood pressure (DBP), alanine aminotransferase (ALT), aspartate aminotransferase (AST), gamma-glutamyltransferase (GGT), total cholesterol (TC), TG, HDL-C, fasting plasma glucose (FPG), hemoglobin A1C (HbA1C), year of follow-up, and T2DM events during the follow-up.
Secondary analysis of the data is permitted without violating the author's rights since all copyrights and associated ownership have been waived by the author. As stated in the initial report, the Murakami Memorial Hospital Ethics Committee approved the ethics of the study, and all subjects provided informed consent.
Study design and participants
The data for this analysis were derived from the NAfld in the Gifu Area, Longitudinal Analysis study. This was a long-term study conducted at the Murakami Memorial Hospital's Medical Health Checkup Center (Gifu, Japan). In total, 20,944 participants were recruited during a period from 2004 to 2015. Patients with missing essential data, medication usage, excessive alcohol consumption, known liver disease, and a diagnosis of T2DM or FPG ≥6.1 mmol/L at baseline assessment were excluded. As a result, 15,464 participants were involved in the original study. 22 In the current study, the authors eliminated the participants with missing baseline HDL-C values (n = 11). Next, 2741 participants with fatty liver disease were excluded. After removing these participants, this study included 12,716 eligible participants.
Data collection and measurements
Physical examination measures, blood tests, and a standardized self-administered questionnaire on medical history and lifestyle variables, such as drinking and smoking habits, were included in the baseline data. Fasting blood samples were collected to test GGT, AST, ALT, HDL-C, TC, TG, HbA1C, and FPG. The target independent variable was the ratio of TG/HDL-C measured at baseline. As previously indicated, 22 the mean weekly alcohol intake was determined by asking the subjects what types and amounts of alcohol they consumed throughout the past month. Alcohol consumption was divided into four groups: heavy alcohol drinking (>280 g/w); moderate drinking (140–280 g/w); light drinking (40–140 g/w); and no or minimal drinking (<40 g/w). Based on the individuals' smoking history, 22 smoking status was categorized into three groups: current smoking, past smoking, and never smoked.
Participating in a sport at least once a week was considered regular physical exercise. 23 As previously mentioned, routine medical examinations were conducted at Murakami Memorial Hospital for all subjects, with 60% being evaluated once or twice annually. 22 T2DM was defined as HbA1C ≥6.5%, FPG ≥126 mg/dL, 24 or self-reported T2DM. New-onset T2DM was the main outcome during follow-up. Since this is a retrospective cohort study, biases arising from selection and observation have been minimized.
Statistical analysis
First, the authors examined the baseline distribution of the TG/HDL-C ratio tertiles. Categorical variables were presented as frequencies and percentages, and continuous variables as mean ± standard deviation, median, and quaternary ranges (25th–75th percentiles). To analyze the differences among the TG/HDL-C ratio tertile groups, the chi-squared test, one-way analysis of variance, and Kruskal–Wallis H test were performed. Kaplan–Meier curves with the log-rank test were used to analyze the differences in the development of T2DM over the study period among different groups. To explore the predictive value of the TG/HDL-C ratio on diabetes risk, univariate and multivariate Cox proportional hazards regression models were used. T2DM risk was assessed using the adjusted hazard ratio (HR) with a 95% confidence interval (CI).
In accordance with the Strengthening the Reporting of Observational Studies in Epidemiology statement, 25 the authors displayed the findings of unadjusted, minimally adjusted, and fully adjusted analyses simultaneously. The covariance was adjusted if the matching HR changed by at least 10% after the covariance was added to the model. 26 Based on age, sex, SBP, DBP, BMI, exercise, alcohol use, and smoking status, interaction and stratified analyses were carried out. To determine the optimal cutoff point and the area under the curve (AUC) of the TG/HDL-C ratio in the prediction of T2DM, a receiver operating characteristic (ROC) analysis was conducted.
In the authors' study, all analyses were conducted using the statistical software package R (www.R-project.org, The R Foundation) and EmpowerStats www.empowerstats.com; X&Y Solutions, Inc., Boston, MA). All tests were two-sided, and P < 0.05 was considered statistically significant.
Results
Baseline characteristics of the study participants
The study enrolled 12,716 participants (48.51% men and 51.49% women). The average age of the study population was 43.47 ± 9.01 years old. One hundred fifty participants developed T2DM at a median follow-up of 5.39 years.
Table 1 presents the TG/HDL-C ratio tertiles and baseline characteristics of the participants. In the high TG/HDL-C ratio group, the authors found that participants had higher age, BMI, blood pressure, levels of GGT, ALT, AST, TC, FPG, HbA1C, and higher rates of current smoking and drinking. Participants in the low TG/HDL-C ratio group exercised more often.
Baseline Characteristics of Participants
Data are expressed as n (%) or mean ± SD or medians (interquartile range: 25th to 75th percentiles).
ALT, alanine aminotransferase; AST, aspartate aminotransferase; BMI, body mass index; DBP, diastolic blood pressure; FPG, fasting plasma glucose; GGT, gamma-glutamyltransferase; HbA1C, hemoglobin A1C; HDL-C, high-density lipoprotein, cholesterol; SBP, systolic blood pressure; SD, standard deviation; T2DM, type 2 diabetes mellitus; TC, total cholesterol; TG, triglyceride.
It was found that the TG/HDL-C ratio categories stratified the cumulative hazards of the T2DM incident risk as a result of the Kaplan–Meier analysis. T2DM incident risk differed significantly across the TG/HDL-C ratio tertiles (log-rank test, P < 0.0001; Fig. 1). As TG/HDL-C levels increased, the cumulative incidence of T2DM gradually increased, with the highest incidence being found in the high tertile group.
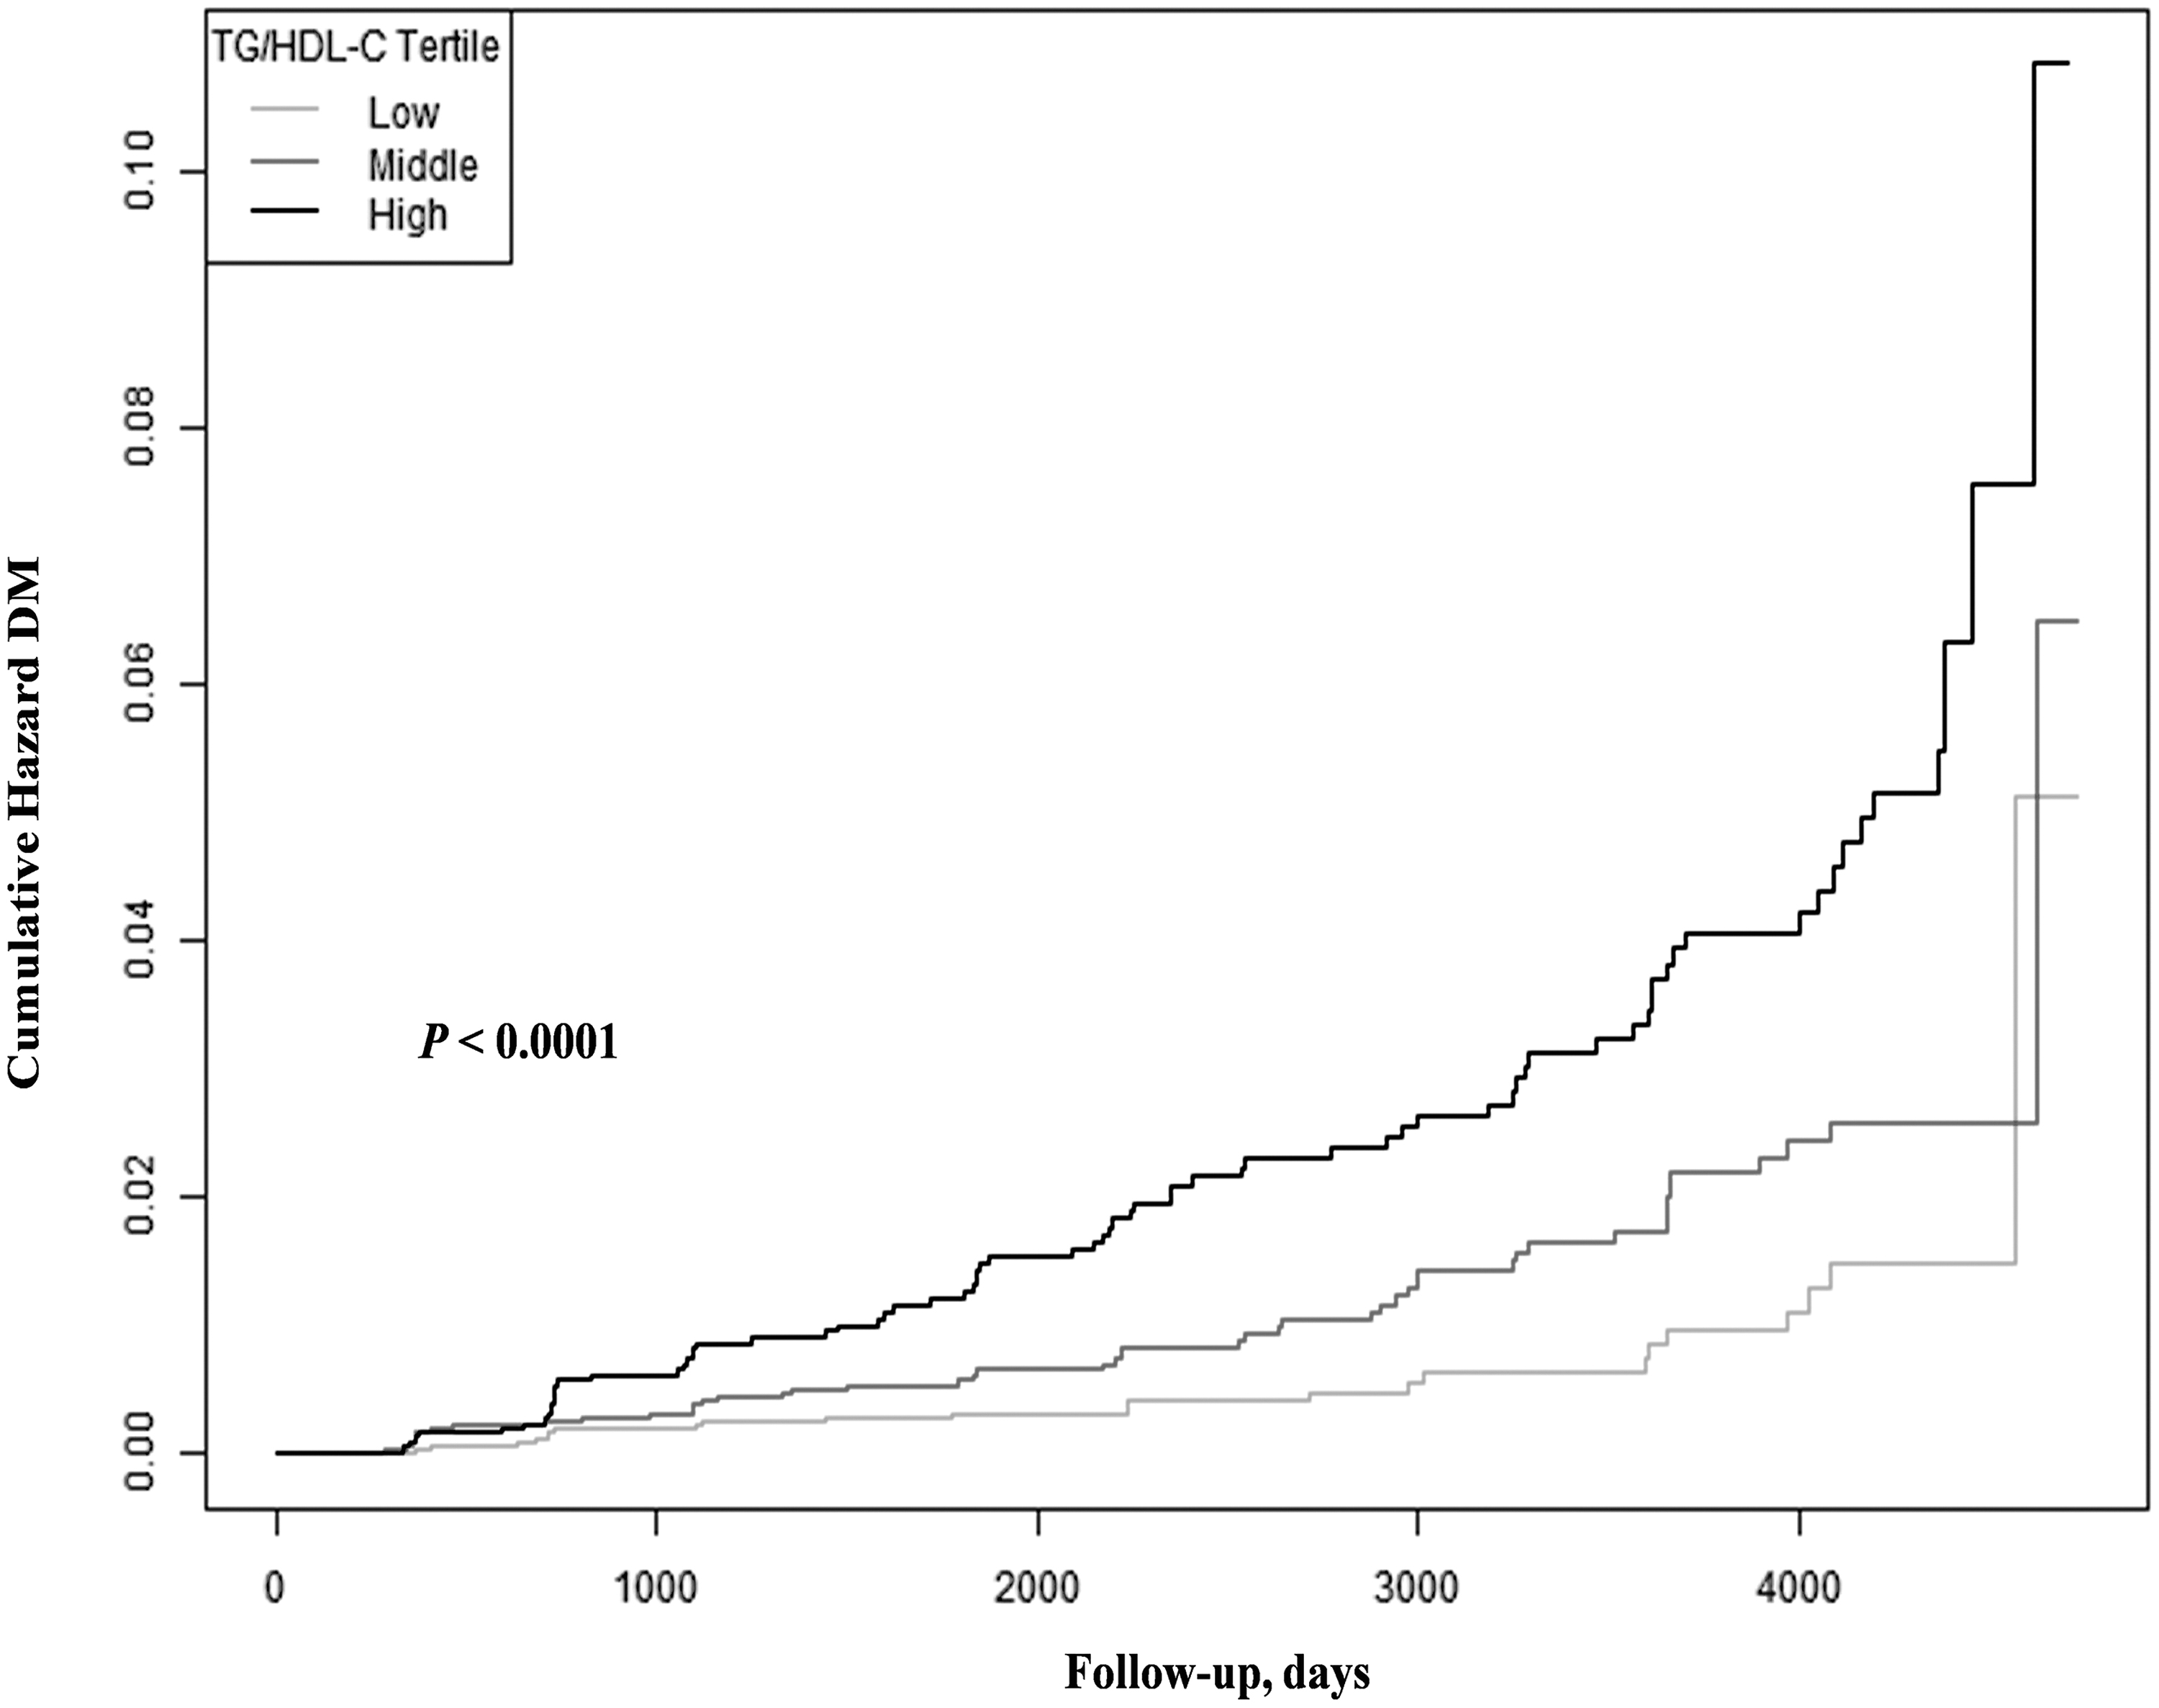
Cumulative hazard curves for T2DM by tertiles of the TG/HDL-C. T2DM, type 2 diabetes mellitus; TG/HDL-C, triglyceride to high-density lipoprotein cholesterol ratio.
Univariate analysis
Table 2 displays the results of the univariate analysis. Age, BMI, GGT, ALT, AST, SBP, DBP, TC, HbA1C, FPG, alcohol consumption and smoking status were found to be positively related to incident T2DM. The authors also found that men were more likely than women to develop T2DM.
The Results of Univariate Analysis
CI, confidence interval; HR, hazard ratio.
Multivariate analysis
The association between the TG/HDL-C ratio and incident T2DM was analyzed using multivariate Cox regression models (Table 3). Based on the crude model, the TG/HDL-C ratio was positively correlated with incident T2DM (HR: 1.15, 95% CI: 1.11–1.20, P < 0.0001). In the minimally adjusted model (adjusted for sex and age), the results did not significantly differ (HR: 1.13, 95% CI: 1.08–1.18, P < 0.0001). After adjusting for the full model (adjusted for sex, age, SBP, DBP, BMI, GGT, AST, ALT, TC, HbA1C, FPG, exercise, alcohol consumption, and smoking status), the association between the TG/HDL-C ratio and incident T2DM was still observed (HR = 1.08, 95% CI: 1.01–1.15, P = 0.0239).
Association Between Triglyceride to High-Density Lipoprotein Cholesterol Ratio and the Incident of Diabetes in Different Models
Crude model: not adjusted for other covariants. Minimally adjusted model: adjusted for age and sex. Fully adjusted model: adjusted for age, sex, BMI, SBP, DBP, ALT, AST, GGT, TC, FPG, HbA1C, exercise, alcohol consumption, smoking status.
Further, the authors examined the TG/HDL-C ratio as a categorical variable (tertile) in the full model, demonstrating a 71% increase in diabetes risk in the high tertile compared with the low tertile. The trend across the tertiles was significant (P = 0.0372).
The results of the subgroup analysis
Subgroup analyses were conducted to examine the potential confounding variables that may have influenced the association between the TG/HDL-C ratio and incident T2DM. Age, sex, SBP, DBP, BMI, exercise, alcohol consumption, and smoking status were chosen as stratification variables. Table 4 shows that BMI interacted positively with the TG/HDL-C ratio and incident diabetes. The incidence of T2DM was strongly correlated with the TG/HDL-C ratio in participants with a BMI of ≥18.5 and <24 kg/m2 (HR: 1.11, 95% CI: 1.04–1.18, P = 0.0025).
Results of Subgroup Analysis and Interaction Analysis
Above model adjusted for age, sex, BMI, SBP, DBP, ALT, AST, GGT, TC, FPG, HbA1C, exercise, alcohol consumption, smoking status.
In each case, the model is not adjusted for the stratification variable.
Receiver operating curve analysis
The potential for the TG/HDL-C ratio to predict diabetes was further investigated using ROC analysis. The results showed that the AUC was 0.684 (95% CI: 0.640–0.728) (Fig. 2). The optimal cutoff point determined by Youden's Index for using the ratio of TG/HDL-C to predict T2DM was 1.609, with 54.7% sensitivity and 73.6% specificity, respectively.
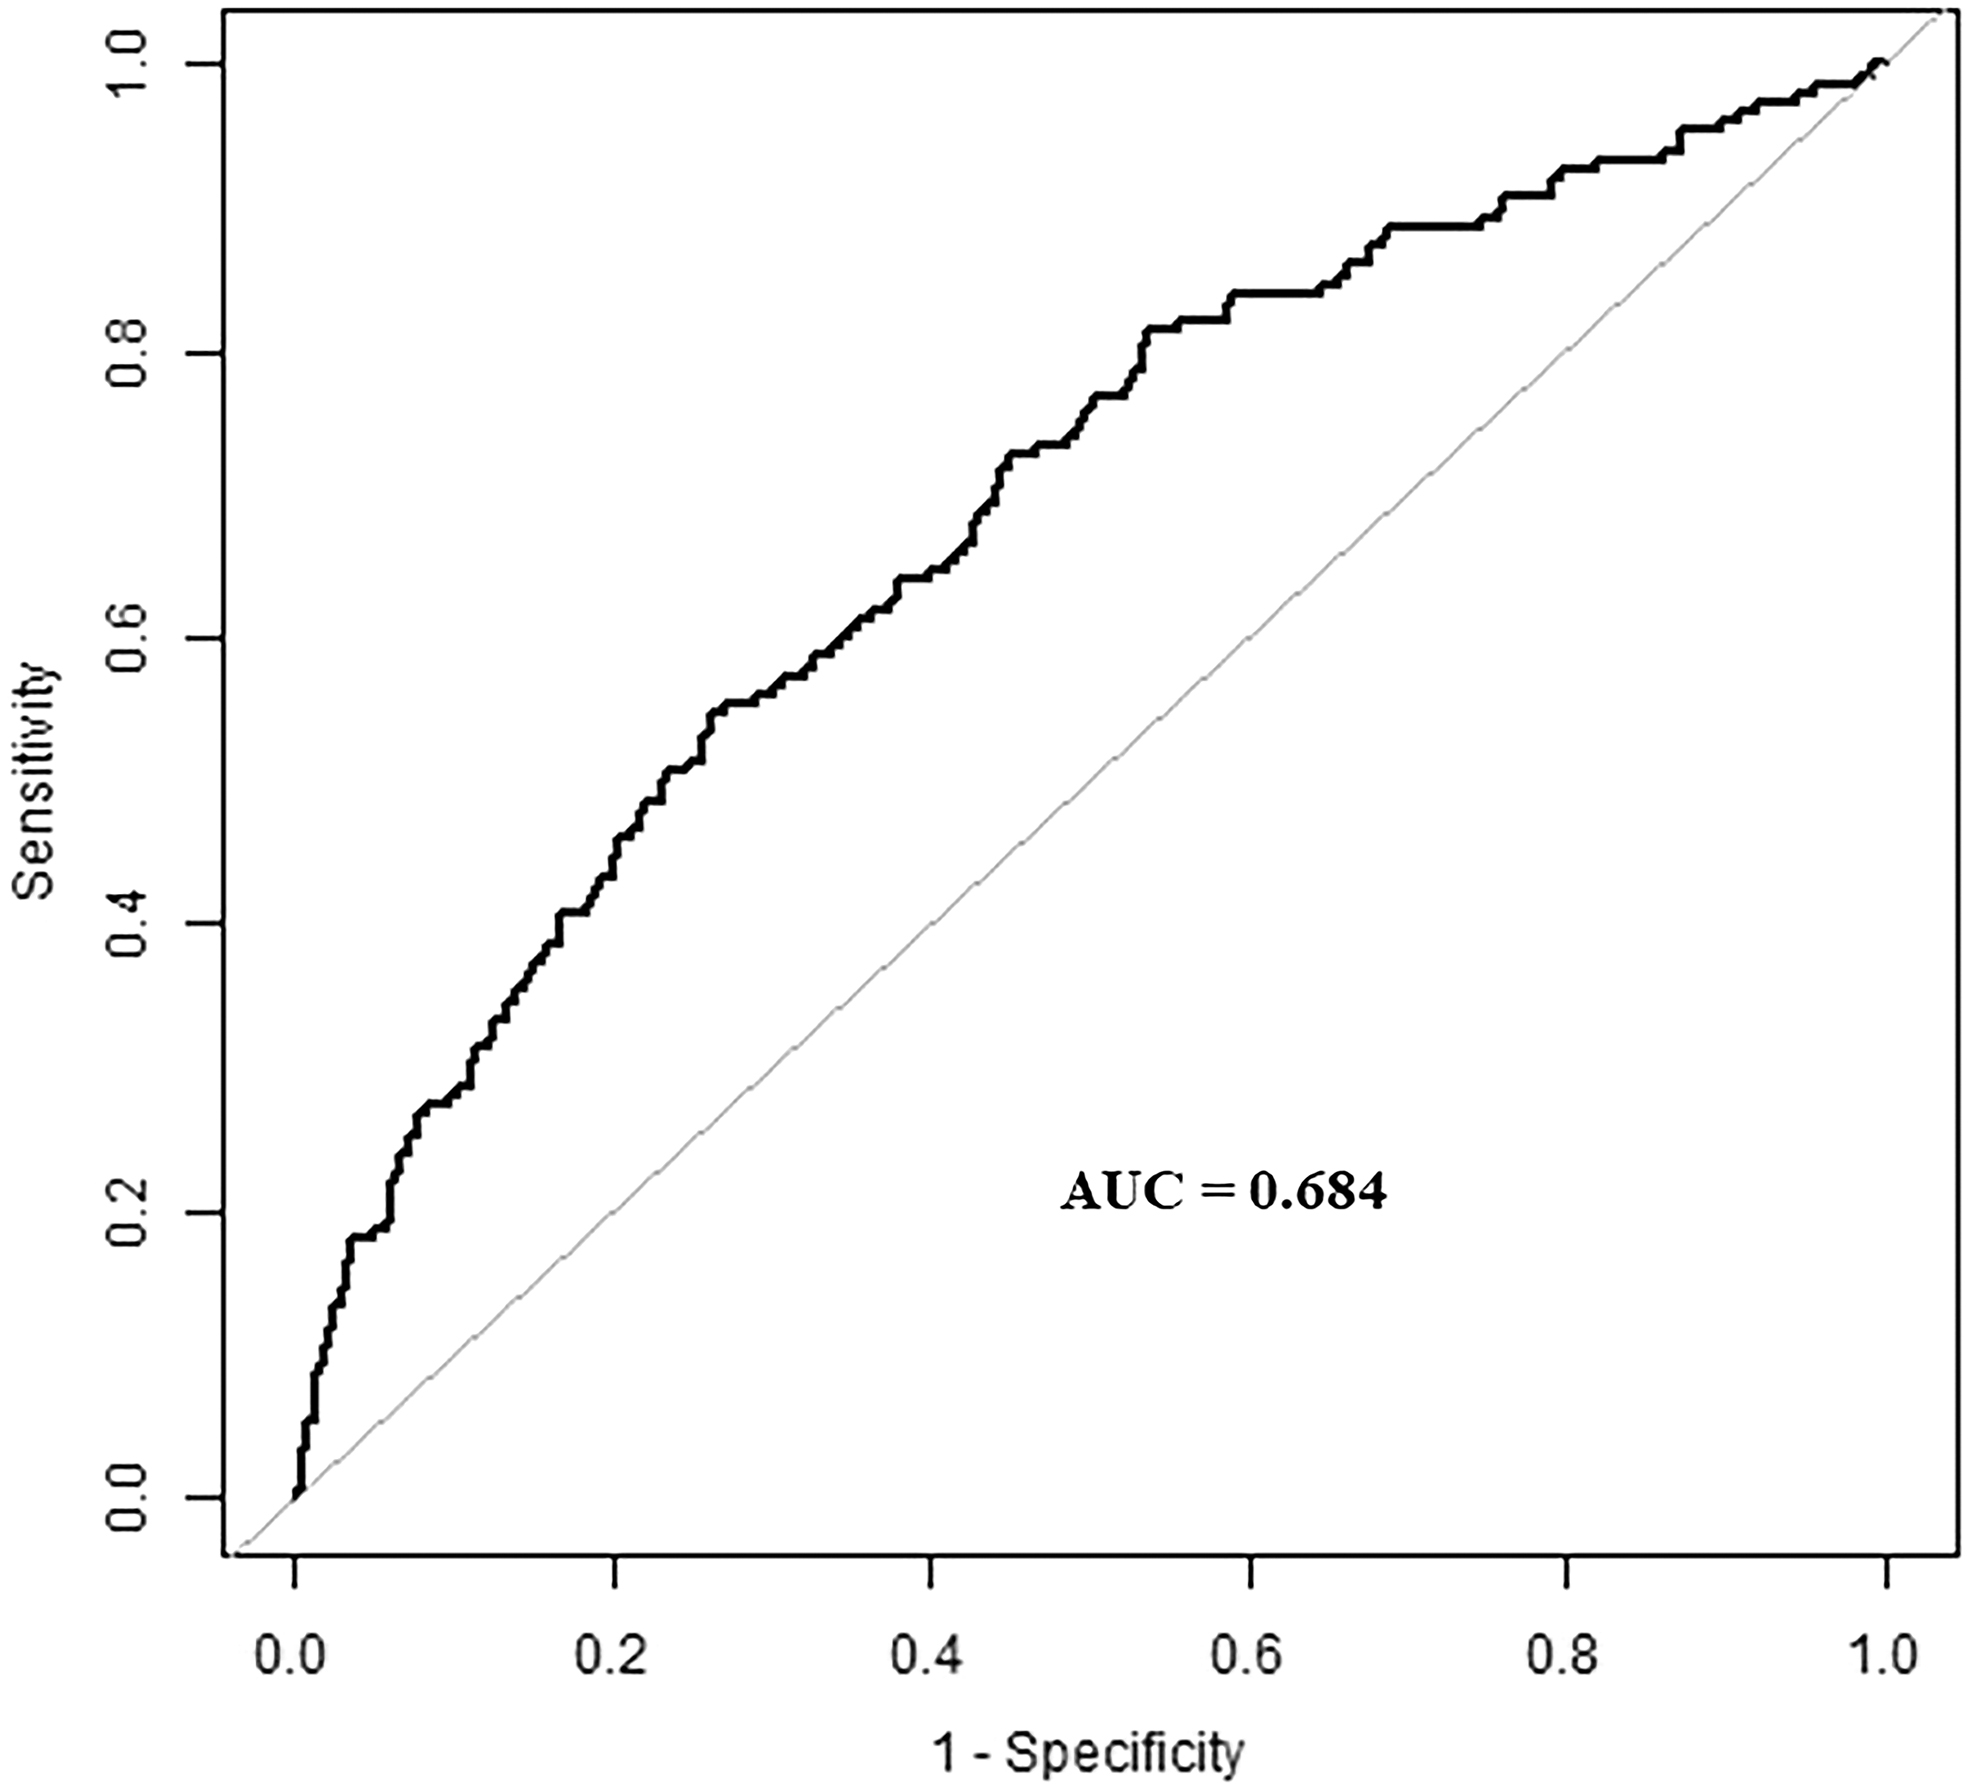
Receiver operating curve analysis to analyze the predictive value of the TG/HDL-C for T2DM. AUC, area under the curve.
Discussion
In this study, the authors investigated the relationship between the TG/HDL-C ratio and the risk of incident T2DM in a large cohort of Japanese individuals. The results demonstrated a positive correlation between the TG/HDL-C ratio and the incidence of T2DM in the Japanese population. The correlation remained highly significant even after adjusting for potential confounding factors, such as SBP, DBP, BMI, GGT, ALT, AST, TC, HbA1C, FPG, exercise, smoking status, and alcohol consumption. Also, subgroup analyses were conducted to gain a deeper understanding of the trend in the TG/HDL-C ratio and the incidence of T2DM among different populations. According to this study's findings, a significant association was observed in the population with a BMI of ≥18.5 and <24 kg/m2. In addition, the authors found that the optimal cutoff value of the TG/HDL-C ratio to predict T2DM was 1.609, with a sensitivity and specificity of 54.7% and 73.6%, respectively.
Studies 27,28 have previously confirmed an association between a high TG/HDL-C ratio and a greater risk of diabetes. According to Liu et al., 29 elevated TG/HDL-C ratio levels were related to a significant incidence of new-onset T2DM in an elderly Chinese population older than the age of 75 years. Similar findings 30 have been published in another prospective study involving 11,949 rural Chinese. A prospective cohort study involving 5314 Chinese American, white, African American, and Hispanic participants showed that T2DM developed to a significant degree in participants with the highest TG/HDL-C ratio over a mean follow-up of 7.7 years compared with participants with the lowest TG/HDL-C ratio. 31 The significance of the TG/HDL-C ratio in T2DM, however, remains controversial. According to Maturu et al., 32 the TG/HDL-C ratio was ineffective as an IR marker in African American women.
Similarly, Janghorbani and Amini 33 concluded that the TG/HDL-C ratio failed to predict T2DM among high-risk Iranian individuals. These discrepancies could potentially stem from interethnic variations in lipid profiles or differences in lifestyle factors that influence the manifestation of IR. Another contributing factor to these findings might be the reliance on studies with small sample sizes.
A few possible mechanisms could explain the relationship between the TG/HDL-C ratio and T2DM. First, when TG levels remain high, heparin stimulates lipoprotein lipase, increasing the intravascular lipolysis of circulating TG and thereby exposing it to free fatty acids (FFAs). Increased FFAs may reduce insulin sensitivity, resulting in a vicious cycle of increasing IR and TG levels. This may lead to reduced glucose tolerance and the onset of diabetes. 34,35 Second, decreased HDL-C levels may influence glucose homeostasis through the 5′ adenosine monophosphate-activated protein kinase pathway by lowering insulin synthesis and insulin sensitivity. 36 –39 Furthermore, a recent Mendelian randomization experiment 40 evaluating 25 loci (comprising 10% of genetic variation) established that low HDL-C and high TG levels are causally associated with the development of T2DM. Therefore, the TG/HDL-C ratio was identified as a potential predictor of IR, which is closely related to T2DM.
Several factors can affect lipid and glucose metabolism. In accordance with the findings of Chen et al., 14 the relationship between the TG/HDL-C ratio and T2DM risk was only significant with a BMI of ≥18.5 and <24 kg/m2. Although the underlying mechanism for T2DM development is unknown, the authors hypothesized that different ethnicities might have different pathways of pathogenesis that cause the disease to develop. Asians are more likely than Westerners to get T2DM at a lower BMI, which may be attributable to their tendency to retain fat viscerally instead of subcutaneously. 28,41 In addition, Asian individuals have lower levels of β cell function and are more insulin resistant than non-Asian individuals, especially individuals who are relatively lean. 42
A major strength of the current study is the large sample size and rigorous follow-up for an extended period of time in the original study. As a population-based retrospective cohort study, the data on the TG/HDL-C ratio and incident T2DM, as well as a broad range of confounding factors, are relatively reliable. The present study still has some potential limitations. First, the secondary analyses are limited by the data available. Therefore, it was not possible to fully adjust for unmeasured or unreported confounding factors that were present in the original study. Second, oral glucose tolerance tests were not performed during follow-up visits, which may have led to an underestimation of the incidence rate of T2DM. Thus, the findings of this study need to be confirmed by further investigation.
Conclusion
In conclusion, the current study demonstrates that an elevated TG/HDL-C ratio is associated with incident T2DM and could be used as a predictor for T2DM in the Japanese population. In addition, there is a significant correlation between the TG/HDL-C ratio and incident T2DM in the group with a BMI of ≥18.5 and <24 kg/m2. These insights underscore the importance of further investigation to replicate and substantiate our findings across a broader spectrum of populations. Future research endeavors should not only aim to reaffirm the TG/HDL-C ratio's predictive accuracy for T2DM but also delve into understanding the underlying biochemical and genetic mechanisms that drive this association in different ethnic backgrounds.
Footnotes
Acknowledgments
We sincerely thank Professor Takuro Okamura and colleagues for providing the original data of their study.
Authors' Contributions
G.J.X. contributed to the drafting of the article and analysis and interpretation of the data. J.S. contributed to the conception and critical revision of the article, analysis and interpretation of the data, and approved the final version of the submitted article. Both authors read and approved the final article.
Availability of Data and Materials

Ethics Approval and Consent to Participate
The current study is a secondary analysis of published data. The original study was approved by the Murakami Memorial Hospital Ethics Committee. Written informed consent was obtained from all participants. The authors state that this study was conducted in accordance with the Declaration of Helsinki.
Author Disclosure Statement
No competing financial interest exist.
Funding Information
This project was supported by the Medjaden Academy & Research Foundation for Young Scientists (Grant No. MJA202306004).