




Abstract
Objective:
Screen time (ST) has shown negative effects on physical and mental health, with an increase in the prevalence of overweight, metabolic syndrome (MetS), and obesity. The time spent in front of the screens was also associated with higher odds of selecting indicators of cardiometabolic disease in adulthood. In view of this, the aim of this study was to identify the risk of MetS and type 2 diabetes mellitus (T2DM) in healthy young males and relate it to ST and sleep time.
Methods:
We evaluated physical and laboratory characteristics, dichotomous diagnosis criteria, and continuous scores to assess MetS and Finnish Diabetes Risk Score questionnaire to measure the T2DM risk.
Results:
The means of MetS dichotomous and continuous severity criteria, among individuals with <7 hr of sleep, were higher than those with adequate sleep. We did not observe a direct impact of ST on the risk of MetS; nevertheless, >8 hr of ST increased 1.22 points in the T2DM risk.
Conclusion:
Excessive ST increased the risk of T2DM, but not of MetS. Moreover, sleeping <7 hr was associated with a higher mean of dichotomous and continuous severity criteria for MetS.
Introduction
Metabolic syndrome (MetS) is characterized by a dichotomous diagnosis that requires the presence of at least three of the five of risk criteria: (1) obesity or increased waist circumference; (2) increased systolic blood pressure (SBP) and/or diastolic blood pressure (DBP), or history of hypertension under treatment; (3) changes in blood glucose levels, or treatment for hyperglycemia; (4) atherogenic dyslipidemia or hypertriglyceridemia; and (5) reduction in high-density lipoprotein cholesterol (HDL-C) for values <40 mg/dL in men. 1 Individuals who did not meet this criterion were identified as not having MetS, even if these values were within the upper threshold of normality. Hence, continuous MetS scores derived from grouping the main MetS components have been proposed to represent this syndrome in children, adolescents, and young adults, because MetS scores is considered statistically more sensitive and less subject to errors when compared with the dichotomous approach. 1 –3 Like obesity and type 2 diabetes mellitus (T2DM), MetS is related to risk factors involved in chronic inflammatory processes, active in atherosclerosis and cardiovascular disease (CVD). 4 –6
Technological evolution associated with the emergence of the World Wide Web has led to an increase in the time people spend in front of a screen. This behavior termed as screen time (ST), or the time of exposure to screen-based technology, has been incorporated into research in different areas, such as psychology, public health, epidemiology, and education. 7,8 The use of interactive screens such as computers, video games, and smartphones has been shown to be more harmful to sleep than passive ST. 9,10
Blue light emitted by cell phones and tablets alters the secretion of melatonin, a hormone responsible for the circadian cycle, leading to changes in sleep patterns and other metabolic changes. 9 Sleep is an important and complex physiological process critical for maintaining metabolic homeostasis. A meta-analysis sought to identify whether a dose–response relationship exists between sleep duration and the presence of MetS. The results showed that those who reported a sleep duration of <5 hr had 1.5 higher odds of having MetS. 11 Disturbances in metabolic homeostasis can increase the risk of developing cardiometabolic diseases such as diabetes, obesity, and heart disease. 12 Furthermore, the highest ST has shown negative results in physical and mental health, with an increase in the prevalence of overweight, MetS, and obesity. 10,13 A prospective cohort study showed that higher ST in adolescence was associated with higher odds of select indicators (such as waist circumference, obesity, and diabetes) of cardiometabolic disease in adulthood. 14 In children and youth, excessive ST is thought to affect the cardiovascular system. The studies have mainly focused on cardiovascular fitness, blood pressure (BP), insulin resistance (IR), and cholesterol levels. A dose-dependent negative association has been documented after exceeding a 2-hour threshold of daily ST. 10
In view of this, the aim of this study was to identify MetS and T2DM risks and relate them to ST and sleep time in healthy young males. For this purpose, we applied both dichotomous diagnosis and continuous MetS severity score, and the Finnish Diabetes Risk Score (FINDRISC) questionnaire to evaluate the risk of developing T2DM.
Patients and Methods
This is an observational cross-sectional study, consisting of a convenience sample of 700 candidates evaluated in the selection process to join the Air Force (AF). They were invited to participate in the study during the selection process that took place at the Medical Evaluation Center of the Air Force Hospital (AFH), from June 2 to July 1, 2020. We adopted as inclusion criteria: male individuals, aged between 18 and 21 years, who were considered fit to join the AF as soldiers. The age adopted for participation in the study aimed to include individuals considered digital natives or belonging to generation Z. Noninclusion criteria: not considered fit to join the AF, use of illicit drugs, and age >21 years. The causes of health disability to join the AF are height <155 cm, disproportionate weight–height (>10 kg between height and weight for candidates <175 cm tall, and >15 kg for those with a height >175 cm), presence of infectious and parasitic diseases, neoplasms, allergy, endocrinopathy, or nutritional, hematological, psychiatric, or central nervous system diseases. The study was conducted in compliance with the Declaration of Helsinki, and it was approved by the institutional ethics committee (#3757623).
A total of 154 participants met the inclusion criteria and underwent laboratory tests performed by the AFH. All of them signed the free and informed consent form.
During the individual medical consultation, a complete physical examination was performed with anthropometric, BP, and bipolar electrical bioimpedance [BIA (RJL, Quantum II model, Clinton Twp, MI, USA)] measurements. We used the standard formula to calculate the body mass index (BMI), and we adopted values between 25 and 29.9 kg/m2 as criteria for overweight and values ≥30 kg/m2 for obesity. Blood samples were collected in the morning, after a 12-hour fasting, for laboratory measurement of blood glucose levels, HDL-C, and triglycerides (TGL). Dichotomous diagnosis of MetS (dichotomous MetS) was defined by the presence of at least three of the following criteria: (1) obesity or waist circumference ≥102 cm; (2) SBP ≥130 and/or DBP ≥85 mmHg, or history of hypertension under treatment; (3) changes in blood glucose levels (fasting blood glucose levels ≥100 mg/dL, or treatment for hyperglycemia); (4) atherogenic dyslipidemia or hypertriglyceridemia (>150 mg/dL or treatment for hypertriglyceridemia); and (5) reduction in HDL-C for values <40 mg/dL in men. These criteria were proposed by the Joint Interim Statement of the International Diabetes Federation Task Force on Epidemiology and Prevention; the National Heart, Lung, and Blood Institute; the American Heart Association; the World Heart Federation; the International Atherosclerosis Society; and the International Association for the Study of Obesity. 1
The continuous MetS scores are derived by grouping the main MetS components (waist circumference, SBP and/or DBP, blood glucose levels, dosage of TGL, and HDL-C). Several MetS scores have been proposed to represent this syndrome. For the continuous MetS severity score, we used the MetS severity calculator (MetS calc), developed by Gurka et al., available electronically at https://metscalc.org/3. The scores obtained are compared with those of the American population and divided into (1) 0 or negative value: low risk; (2) >0 and <1: moderate stage; and (3) ≥1: increased risk for MetS and future diseases. 3
The participants answered a self-reported questionnaire about the time (hours) spent on average per day in the last week on the internet, sleeping (hours), and on physical activity, and about the daily consumption of fruits and vegetables, unhealthy snacks, deep-fried food, or fatty meats, and about their smoking habit.
Information on diabetes risk factors was acquired through the application of the Brazilian cross-cultural adaptation of the FINDRISC self-administered questionnaire. Age, self-declared race, BMI, waist circumference, sedentary lifestyle, high BP, changes in blood glucose, and diagnosis of diabetes mellitus (DM) in family members are predictors of the risk of having diabetes computed by the questionnaire. The FINDRISC score allows classification into: (1) low risk: <7 points, for which it is estimated that 1 in every 100 people will develop T2DM; (2) moderate risk: between 12 and 14 points, that is, 1 in 6 people may develop T2DM; and (3) high risk: 15 to 20 points, assuming that 1 in 3 people is likely to have the disease. 15
Statistical Analysis
Data were descriptively analyzed. Categorical variables were presented as absolute and relative frequencies, and for numerical variables, summary measures [(mean, minimum and maximum quartiles, and standard deviation (SD)] were used. Associations between two categorical variables were assessed using the chi-squared test, or alternatively with Fisher’s exact test. For comparisons of means between two groups and more than two groups, Student’s t test and analysis of variances (ANOVA) were applied, respectively, owing to the presupposed normality in the data; otherwise, the nonparametric Mann–Whitney and Kruskal–Wallis tests were used. In the presence of mean differences in the ANOVA and the Kruskal–Wallis test, distinct groups of means were identified through Duncan and Dunn-Bonferroni multiple comparisons, respectively. The linear association between two numerical variables, that did not present a normal distribution, was assessed using Spearman’s correlation. The effects of explanatory variables (demographic, clinical, anthropometric, bioimpedance, lifestyle, and laboratory characteristics) on the number of MetS criteria (dependent variable) were examined with simple (univariate) and multiple (multivariate) Poisson regressions. The multivariate Poisson regression model was adjusted to evaluate the effect of time spent in front of some type of screen (hours) and DM risk score, which was also adjusted for age, ethnicity, regular physical activity, daily consumption of fruits, vegetables, or grains, daily consumption of fried foods, salty snacks, or fatty meats, smoking, first- and second-degree relatives with diabetes, low density lipoprotein cholesterol (LDL-C), BIA% fat, basal metabolic rate (BMR), and sleep time. BMI and altered glucose were excluded because they were multicollinear with the DM risk score, while weight was multicollinear with BIA% fat and BMR and were disregarded from the analysis. Initially, all explanatory variables were included in the model, and subsequently nonsignificant variables at 5% were excluded one by one in order of significance, except for ST and T2DM risk. A similar procedure was used for the MetS risk score, as a dependent variable, and for the analysis of the T2DM risk score (dependent variable). In this case, the nonsignificant variables at 5% were also excluded one by one in order of significance, except for ST. In multiple linear regression models, the presence of multicollinearity was verified using the variance inflation factor. One of the assumptions of Student’s t test, as well as ANOVA and the linear regression model, is the normality of the data, which was examined using the Kolmogorov–Smirnov test. The significance level for all statistical tests was 5%. Statistical analyses were performed using IBM SPSS [Statistics for Windows, version 20.0 (2011), Armonk, NY: IBM Corp.] and Stata 12 [Stata Statistical Software12 (2011), College Station, TX: StataCorp LP].
The Strengthening the Reporting of Observational Studies in Epidemiology (STROBE Statement) checklist was followed to ensure the quality of this observational cross-sectional study. 16
Results
This observational cross-sectional study enrolled 154 healthy, young conscripts. The mean and SD of age was 18.7 ± 0.6 years, and about 50% did not practice regular physical activity. The most prevalent risk factor was SBP 66.2% or DBP 29.2%, followed by changes in blood glucose levels (23.4%) and low HDL-C (16.9%). Table 1 describes the clinical, anthropometric, and social characteristics of the participants, while Table 2 reports the risk factors and scores related to MetS and T2DM.
Demographic, Clinical, and Anthropometric Characteristics of the Participants
Number of participants: 154.
BMI, body mass index; BP, blood pressure; Max, maximum; Min, minimal; SD, standard deviation; ST, screen time; T2DM, type 2 diabetes mellitus; <, less than; >, more than.
Risk Factors and Scores Related to Metabolic Syndrome and Type 2 Diabetes Mellitus
Data presented as mean ± SD, and in parentheses, the percentage or minimum and maximum values.
DBP, diastolic blood pressure; HDL-C, high-density lipoprotein cholesterol; MetS, metabolic syndrome; SBP, systolic blood pressure.
Ten participants (6.4%) had three or more criteria for MetS, enabling the dichotomous diagnosis of MetS. In 72% of the sample, the presence of one or two criteria was identified; therefore, only 21.4% did not have any MetS features. However, the continuous analysis of these criteria, using the MetS calc, showed that 55.2% had moderate risk and 10.4% had high risk for MetS; thus, this population had an average risk of 58.3% for MetS (mean MetS calc 0.25 ± 0.63). The chance of developing T2DM was considered low in 99.4% of cases, according to the FINDRISC test final score.
Risk factors related to dichotomous diagnosis of MetS were analyzed considering the characteristics adopted for the study. We found a statistically significant difference only in the mean regarding sleep time (P = 0.036), for which the mean of MetS criteria among individuals with <7 hr of sleep was higher than those with adequate sleep (>8 hr/night). Spearman’s correlation between the number of MetS risk factors and participants’ characteristics showed a weak positive association with weight (r = 0.175; P = 0.030). In the simple Poisson regression, none of the characteristics (predictive variable) was associated with the number of risk factors for MetS (dependent variable) (Table 3). Subsequently, the multivariate Poisson regression model was adjusted, and no variable remained significant, including the ST (P = 0.938) and T2DM risk score (P = 0.239).
Results of Initial Poisson Regression Model for Risk Factors Related to Dichotomous Diagnosis of Metabolic Syndrome
Reference: white skin.
Reference >30 min/day or >4 hr/week.
Reference: no.
Reference: eutrophic.
Reference: between 7 and 9 hr of sleep was considered adequate.
Reference <3 hr.
BIA, bipolar electrical bioimpedance; BMR, basal metabolic rate; CI, confidence interval; LDL-C, low density lipoprotein cholesterol.
Similarly, risk factors related to MetS calc were also analyzed, and individuals with overweight and obesity reached mean MetS calc higher than that of the eutrophic ones (P < 0.001 and P = 0.002, respectively). The mean of the MetS calc was also explored considering the characteristics adopted for the study. We found significant differences in the mean MetS calc in the group of individuals with <7 hr of sleep, which was higher than those with adequate sleep (P = 0.028). Spearman’s correlation showed a moderate positive correlation between the MetS calc and the variables weight (r = 0.550; P < 0.001) and BMI (r = 0.588; P < 0.001), and a weak positive correlation with BIA fat percentage (r = 0.480; P < 0.001), BMR (r = 0.434; P < 0.001), and LDL-C (r = 0.174; P = 0.031). For simple linear regression model, MetS calc (dependent variable), there was statistical significance for the following predictor variables: weight, BMI classification, BIA fat percentage, BMR, and sleep time <7 hr (Table 4). The variables which did not reach significance at 5% were excluded before the initial multivariate model, and the multicollinear variables with T2DM risk score (BMI and altered blood glucose levels) and weight (BIA% fat and BMR) were excluded from the analysis as well. According to Table 5 and Fig. 1, ST and risk score for T2DM adjusted for BIA fat percentage, BMR, and sleep time did not reach significance. On the contrary, the increase in BIA fat percentage and BMR led to an increase in the MetS calc [adjusted coefficient (95% confidence interval) 0.03 and 0.0012, respectively]. Moreover, individuals with <7 hr of sleep had on average 0.24 points higher in the MetS calc, compared with those with adequate sleep.

Estimate of the coefficients of the final regression model for risk score for MetS. BIA, bipolar electrical bioimpedance; MetS, metabolic syndrome; T2DM, type 2 diabetes mellitus.
Results of Initial Poisson Regression Model for Risk Factors Related to Continuous Metabolic Syndrome Scores (MetS Calc)
Reference: white skin.
Reference >30 min/day or >4 hr/week.
Reference: no.
Reference: eutrophic.
Reference: between 7 and 9 hr of sleep was considered adequate.
Reference <3 hr.
Results of Initial and Final Multiple Linear Regression Models for Continuous Metabolic Syndrome Scores (MetS Calc)
Reference: white skin.
Reference >30 min/day or >4 hr/week.
Reference: between 7 and 9 hr of sleep was considered adequate.
Reference <3 hr; R 2: R-squared or coefficient of determination.
For the T2DM risk score, Spearman’s correlation showed weak positive correlations with the variables: weight (r = 0.176; P = 0.029), BMI (r = 0.200; P = 0.013), length of stay in front of a screen (r = 0.162; P =0.045), and BIA fat percentage (r = 0.207; P = 0.019). For the adjusted simple linear regression model, with the T2DM risk score as the dependent variable, the following predictor variables were significant: regular physical activity (P = 0.008), daily consumption of fruits, vegetables, or grains (P = 0.025), altered blood glucose levels (P < 0.001), first-degree relatives with diabetes (P < 0.001), second-degree relatives with diabetes (P < 0.001), weight (P = 0.001), BMI classification (P < 0.001), and BIA fat percentage (P = 0.003). For the adjusted multivariate linear regression model, the variables age, BMI, altered blood glucose levels, first- and second-degree relatives with diabetes, regular physical activity, and daily consumption of fruits, vegetables, or grains were not considered as they were included to assess the T2DM score. Once again, weight was excluded as it was multicollinear with BIA fat percentage and BMR. In the final model, the length of stay in front of a screen for >8 hr (P = 0.037) and BIA fat percentage (P = 0.004) remained statistically significant (Table 6 and Fig. 2). Therefore, individuals with length of stay in front of a screen longer than 8 hr reached an average of 1.22 points higher in the T2DM risk score. This result was higher than a risk factor known as adiposity, since an increase of 1% in the BIA fat percentage resulted in an increase of only 0.13 in the T2DM score.
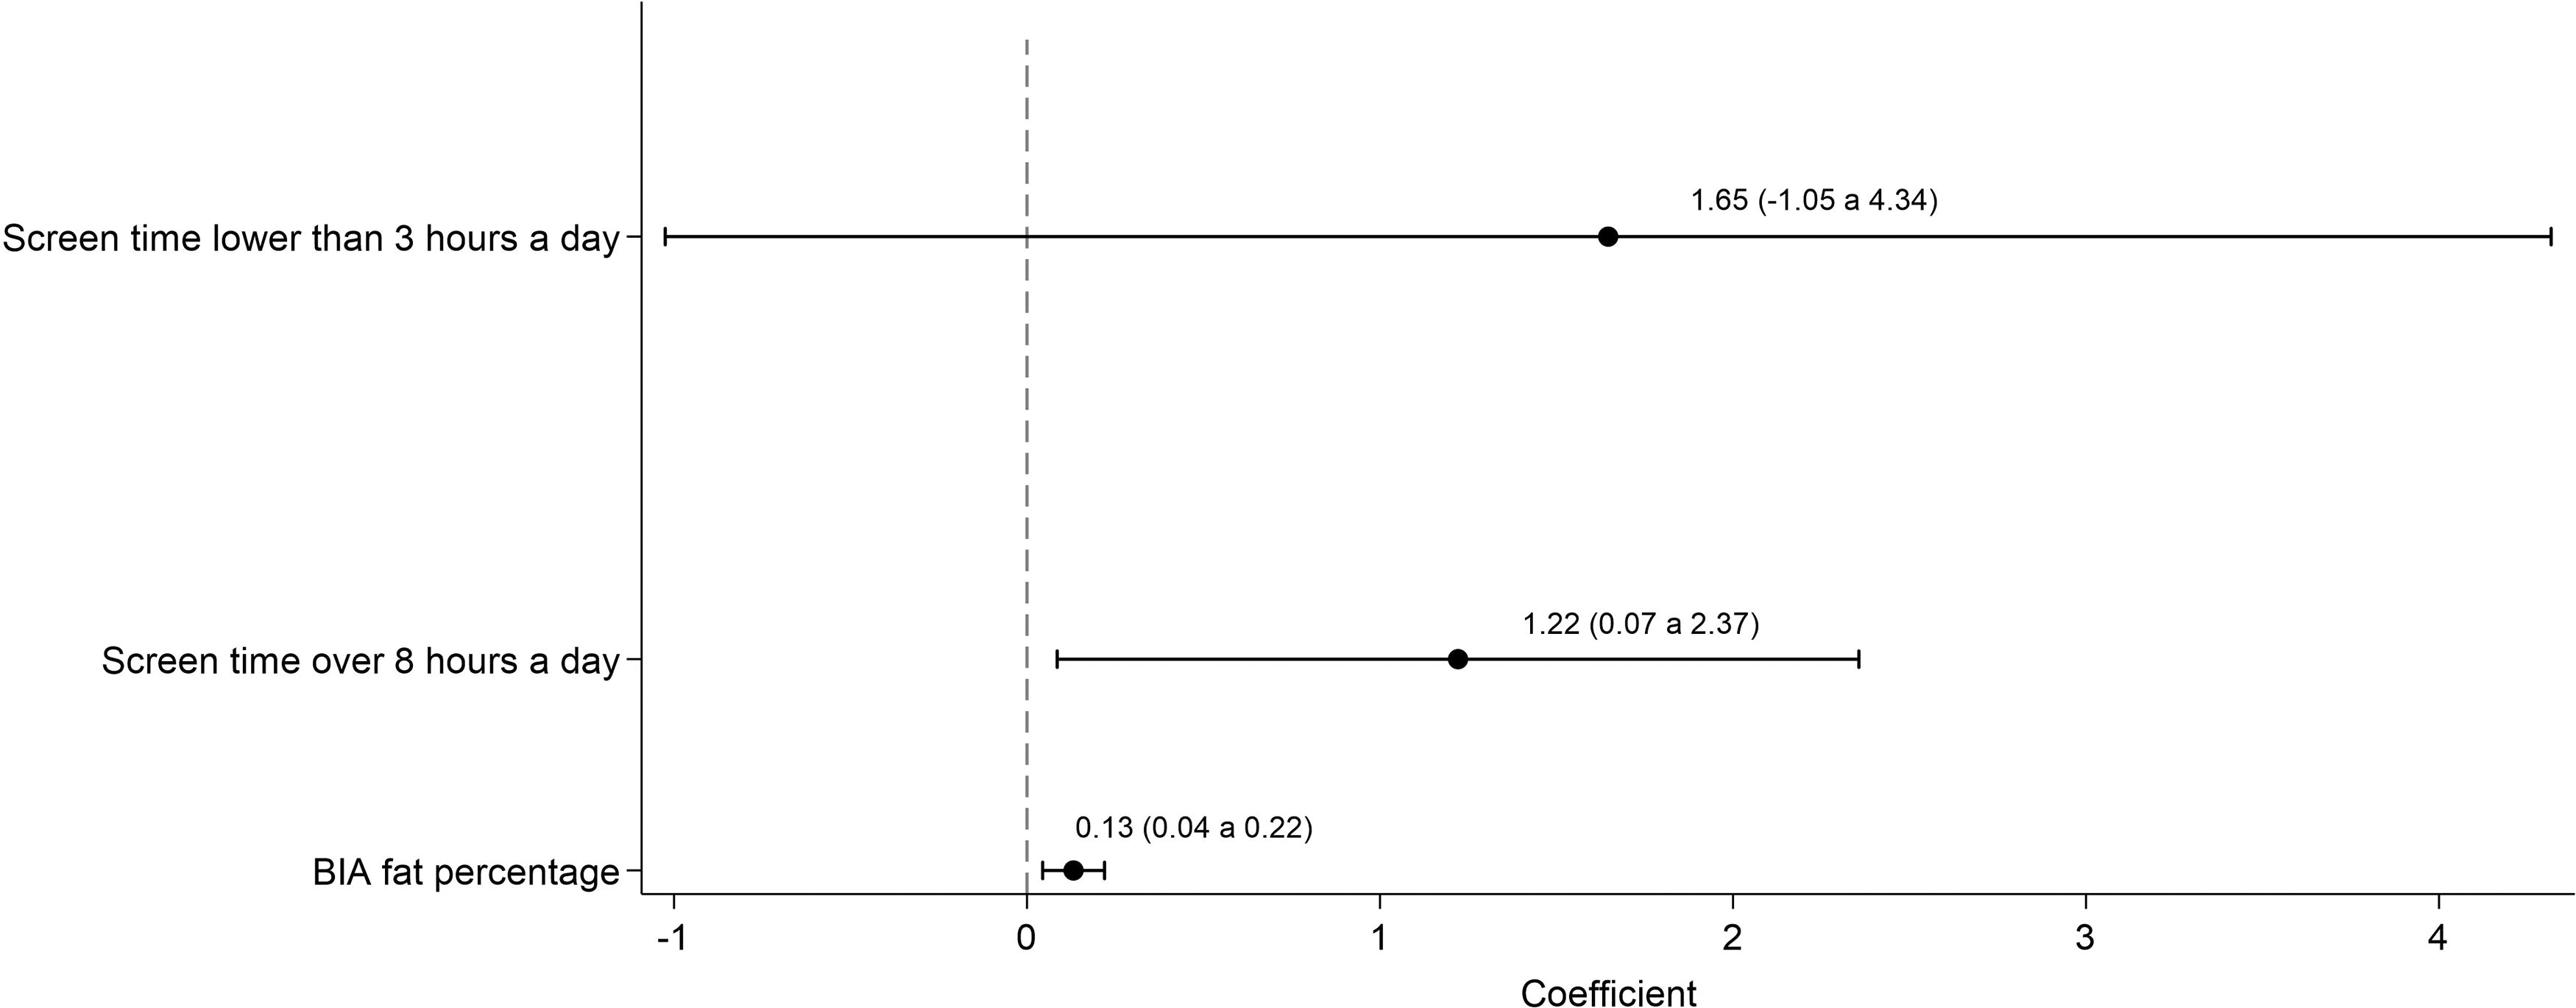
Estimate of the coefficients of the final regression model for risk for T2DM.
Results of Initial and Final Multiple Linear Regression Models for Type 2 Diabetes Mellitus Risk Score
Reference: white skin.
Reference <3 hr; R 2: R-squared or coefficient of determination.
Discussion
A total of 154 young males were investigated for MetS and T2DM risk factors. The most prevalent risk factor was SBP ≥130 mmHg or DBP >95 mmHg, followed by changes in blood glucose levels and HDL-C. About 95% of the participants reported ST longer than 3 hr; among them, 39.6% spent >8 hr exposed to a screen. Sleeping <7 hr per night was reported by 23.4% of young people included in the study.
Ten participants had three or more criteria for dichotomous diagnosis of MetS (6.4%), compatible with the variation between 2.2% and 52% in adolescents between 10 and 19 years old, described in a systematic review, 17 but lower than the 16.7% reported for the Brazilian population between 18 and 39 years old. 18 Participants who did not reach cut-off values for MetS were identified as absence of MetS, even if such values were at the upper threshold of normality. In approximately 72% of the studied sample, the presence of one or two criteria was reported; only 21.4% of the participants did not have any metabolic characteristic. Still, using the MetS calc, the continuous analysis of these criteria showed an increase of 0.25 points in the risk for MetS, reflecting a 58.3% increase in the risk for MetS. A systematic review and meta-analysis involving 10 cross-sectional design studies, a total of 25,073 participants with age range between 7 and 94 years, evaluated the validity of continuous MetS (cMetS) scores for predicting MetS. This study concluded that high sensitivity and specificity of cMetS scores indicate a high accuracy to predict the risk of MetS and good ability to rule out healthy people. 19 Different studies correlated MetS with IR, pre-T2DM, biomarker abnormalities, and future CVD. 2,20,21 In turn, Viitasalo et al. validated the MetS score by confirmatory factor analysis in distinct age groups, including children and the elderly. 22 They also investigated the relationships of the MetS score to incident T2DM, myocardial infarction, and cardiovascular overall death in middle-aged men. The results showed an increment of 3.67-fold in T2DM risk, 1.38-fold in myocardial infarction, and 1.56- and 1.44-fold in cardiovascular death and overall death (respectively) for a 1 SD increase in the MetS score. This indicates MetS score could be used as a tool for evaluating cardiometabolic risk in different age groups, but it is still necessary to define cut-off points for risk estimation in clinical practice. 22
Data on arterial hypertension in young individuals come from studies involving army conscripts, with the same disadvantages found in our evaluation: a single BP measurement conducted during the selection process, which could lead to white-coat or masked hypertension. 23,24 Fear of possible alterations in the exam and anxiety, owing to waiting, can cause an increased response to stress and adrenergic release. This situation increases both SBP and cardiac output and generates a reduction in DBP, by activating beta2-adrenergic receptors, which may produce vasodilation and result in isolated systolic hypertension. 25 In addition, in the Coronary Artery Risk Development in Young Adults (CARDIA) study, 46.9% of the population studied under the age of 40 years had elevated BP according to the 2017 American College of Cardiology/American Heart Association BP guideline. 26 As the cut-off value that we used for BP was similar to the criterion for MetS detection, 66.2% of the participants had SBP ≥130 mmHg, 29.2% had DBP ≥85 mmHg, but in only 8.5%, DBP was above 90 mmHg, not differing from previous reports that show that the prevalence of altered BP ranges from 6.9% to 22.2% in adolescents 27,28 and up to 71.3% in young adults. 29 The prevalence of SBP ≥130 mmHg and DBP ≥85 mmHg found in this study may represent the adrenergic response to stress, but a possible diagnosis of prehypertension cannot be ruled out, indicating the need for greater attention to this comorbidity among young adults. 30,31 The results of the prospective CARDIA study showed that young adults with elevated BP stage 1 and stage 2 hypertension before the age of 40 years had significantly higher risk for subsequent CVD events compared with those with normal BP before this age group. 26,31
Our results showed that both the mean of MetS dichotomous criteria and MetS calc among individuals with <7 hr of sleep was higher than those with adequate sleep (P = 0.036 and P = 0.028, respectively), reflecting, on average, 0.24 points more in the risk score for MetS, compared with those with adequate sleep. These results are similar to those previously described by Chaput et al., who identified a significant increase in the chance of developing MetS using the continuous risk score, based on the MetS components in individuals with less sleep time (≤6 hr), compared with those who sleep adequately, after adjustment for covariates. 32 Other prospective and meta-analysis studies proved the relationship between shorter sleep duration and risk for MetS, as well as greater internet addiction, risk for psychological distress, and poor sleep quality. 33 –35
Despite the low FINDRISC score in the population studied, staying in front of any type of screen for >8 hr resulted in an increase of 1.22 points in the T2DM risk score. Meta-analysis studies suggest compelling evidence between ST and all-cause mortality, fatal and nonfatal CVD, T2DM, and MetS. 36 A similar association was described in a prospective, controlled study in adolescents, with a twofold increase in the risk for T2DM among those who watched TV for >4 hr/day, 37 and as a factor associated with metabolically harmful obesity in children. 38
The main limitation of this study is that because of the adoption of a convenience sample of candidates in the selection process to join the AF, just young males were included. In Brazil, only male citizens between 18 and 21 years of age must compulsorily report to military service, regardless of their social and work status, occupation, or education level. Although we believe that the participants make up a reliable sample of the male population in this age group, it does not allow the extrapolation of the results to other age groups, nor to females. Furthermore, as it is a cross-sectional study, it does not allow us to compare the MetS calc with the dichotomous criteria for the diagnosis of MetS regarding effectiveness or predictive value for future illnesses.
Conclusion
Our results draw attention to the increase in the MetS calc (58.3%) and alert to the need for seeking better indices to assess and identify MetS among young adults. Beyond that, we also observed increase in the T2DM risk by excessive ST, and that sleeping <7 hr was associated with higher means of MetS criteria and MetS calc. The results alert for necessity of understanding the effect of ST on sleep, MetS, and diabetes.
Footnotes
Acknowledgment

Data Sharing Statement
The data are available upon request to corresponding author.
Authors’ Contributions
C.C.-S. oversaw the study implementation and collection of data, and contributed to its intellectual content. G.G.C.D.M., R.A.F., and J.A.d.A.P. collected the data. M.S.Q. conceived and designed the study, oversaw the study implementation and collection of data, interpreted the data, contributed to the writing of the first draft of the article and its subsequent revisions, and contributed to its intellectual content.
Author Disclosure Statement
No conflicting financial interests exist.
Funding Information
This research did not receive any specific grant from any funding agency in the public, commercial, or not-for-profit sector.