




Abstract
Background:
Data on reference values for lean mass (LM) and fat mass (FM) in the Southeast Asian populations are currently lacking. Therefore, we aimed to estimate the normative values and generate anthropometric prediction models for LM and FM in the Thai population.
Methods:
Consecutive community-dwelling individuals aged 20–90 years were recruited from Srinagarind Hospital, Khon Kaen, Thailand, between 2010 and 2015. LM and FM were measured using dual energy X-ray absorptiometry. Age and sex stratified percentile of LM and FM were presented. Anthropometric prediction models for LM and FM were developed by using linear regression to generate competing models.
Results:
A total of 832 individuals (334 males and 498 females) were included in the study. The mean ± SD age, LM, and FM were 50.0 ± 16.2 years, 38.9 ± 8.0 kg, and 15.5 ± 7.7 kg, respectively. LM decreased with age from 49.4 kg in 20–29 years group to 42.3 kg in ≥70 years group in male and 34.6 kg in 30–39 years group to 30.8 kg in ≥70 years group in females. FM has an inverse U-shaped association with age, which peaked at 11.9 kg in 60–69 years group in males and 20.7 kg in 50–59 years group in females. Among the various anthropometric models, the models incorporating age, sex, weight, and height were considered the best fit for predicting both LM and FM.
Conclusion:
In the Thai population, peak LM was reached during early adulthood and decline with age, whereas FM showed an inverse U-shaped association with age. The prediction models incorporating age, sex, weight, and height were proposed as practical tools for assessing LM and FM in clinical practice.
Introduction
Obesity is a significant public health problem affecting approximately 650 million individuals worldwide. 1 This condition is linked to several cardiometabolic complications, including hypertension, insulin resistance, hyperlipidemia, and cardiovascular diseases. Conventionally, obesity is measured by calculating the body mass index (BMI, calculated by weight (kg)/height (m2)). 2,3 In 1993, the World Health Organization (WHO) Expert Committee proposed defining overweight and obesity as BMIs between 25.0 and 29.9 kg/m2 and 30.0 kg/m2. Later in 2000, the WHO Western Pacific Regional Office lowered the BMI cutoffs for Asian populations to 23 kg/m2 and 25 kg/m2, respectively. 4,5 Using a BMI cutoff of 25 kg/m2, the prevalence of obesity in Thailand reported in a population survey in 2011 was 23.8%. 6 Subsequent studies have shown an increased prevalence of obesity in different groups of the population ranging from 37% to 44%. 7,8 Nevertheless, BMI has limitations in predicting the risk of cardiometabolic disorders as it fails to differentiate between excess fat, muscle, or bone mass. 6
To address this limitation, determination of lean mass (LM) and fat mass (FM) using dual-energy X-ray absorptiometry (DXA) or bioelectrical impedance analysis (BIA) has been used as an alternative method to evaluate body composition in relation to the risk of cardiometabolic disorders. 7 According to data from the Korea National Health and Nutrition Examination Survey (KNHANES) IV and V, for instance, increased FM was associated with an increased risk of metabolic syndrome. 11 In addition, reduced muscle mass was found to be associated with the presence of metabolic syndrome among individuals with normal BMI. 12 Increased percentage body fat (%BF, FM/body weight) of >25% in male and >35% in female has been defined by WHO as %BF-defined obesity. 8
While evidence on the predictability of LM, FM, and %BF with health outcomes is evolving, the cutoff values for LM and FM in various populations are not well-established due to limited data on reference values of LM and FM, particularly in Southeast Asians. Using data from a cohort of Northeastern Thais, the purpose of this study was to estimate the normative values of LM and FM across age groups in the Thai population. In addition, previous research has demonstrated that using BMI alone to predict %BF-defined obesity has limited accuracy. 9 –11 To improve the accuracy of using anthropometric profiles to estimate LM and FM, we intended to generate and validate anthropometric prediction models for LM and FM using mathematical modeling.
Methods
Study population and measurements
The present study was designed as a cross-sectional investigation in rural and urban areas of Khon Kaen province, Northeastern Thailand. In the rural area, we recruited from two villages in the Muang districts, which contained 14 hamlets. A complete list of participants was acquired in each hamlet and was chosen at random by the local administrator. Participants in the urban area were recruited through a media campaign, and the sample technique was similar to that used in the rural area.
From 2010 to 2015, apparently healthy male and female individuals aged 20 or older were randomly selected. Participants with a history of recent acute illness (e.g., pneumonia, myocardial infarction), chronic conditions (e.g., chronic infection, cancer, connective tissue disease, hepatic or renal impairment, diabetes, metabolic syndrome, polycystic ovary syndrome), history of taking medication affecting body weight (i.e., glucocorticoids, thyroid hormone, diuretics, glucagon like peptide-1 receptor agonist), or involvement in weight training were excluded. The Khon Kaen University Human Research Ethics Committee examined and approved this study in compliance with the Helsinki Declaration and Good Clinical Practice Guidelines (IRB No. HE42116). Informed consent was obtained from all participants.
LM and FM were measured using dual energy X-ray absorptiometry on a Lunar Prodigy bone densitometer (GE Healthcare, Madison, WI). Demographic and anthropometric data, including age, sex, height, and weight, were obtained. The lean mass index (LMI), fat mass index (FMI), and %BF were determined [LMI = LM (kg)/height (m2), FMI = FM (kg)/height (m2), and %BF = FM (kg)/weight (kg)]. 6
Estimation of optimal body mass index cutoff value for prediction of percent body fat-defined obesity
We used Receiver Operating Characteristic (ROC) curve analysis to assess the sensitivity and specificity of various BMI cutoff values for predicting %BF-defined obesity. The BMI cutoff point yielding the maximum Youden’s index was deemed the most predictive for the outcome. 12 Subsequently, binary logistic regression was utilized to examine the association between BMI-defined obesity using the determined cutoff and the likelihood of %BF-defined obesity, adjusting for age and sex.
Generation of normative values of lean mass and fat mass
Data stratified by age and sex were presented as mean and standard deviation (SD), number of patients (%), and 10th, 25th, 50th, 75th, 90th, and 95th percentiles. Obesity was defined by BMI and %BF as BMI ≥25 kg/m2 and %BF of >25% in male and >35% in female, respectively. Univariate comparison between two groups was performed using the independent t-test for normally distributed continuous data, the Mann–Whitney U test for non-normally distributed continuous data, and the chi-square test for categorical data.
Development of anthropometric prediction models
Before conducting the analysis, the entire dataset was randomly divided into two sets, the training set and the validation set, with a ratio of 2:1 for each. The training set was used to develop predictive models for LM and FM, whereas the validation set was used to evaluate the predictive accuracy of the models. Using adequate subsets of anthropometric candidate predictors from the training set, we performed linear regression to generate competing prediction models. Age and sex were included in all models, and polynomial terms were added to determine if they enhanced the predictive ability of the models. If polynomial terms did not significantly enhance the model, they would be eliminated and the model’s parsimony would be maintained. To assess and compare model discrimination, the adjusted R 2 and Akaike’s Information Criterion (AIC) were calculated for each candidate model. 13 An adjusted R 2 value closer to 1 indicated improved discrimination, whereas lower AIC values indicated improved cross-validated prediction and enhanced discrimination. The standard error of estimate (SEE) was also measured to evaluate the predictive accuracy of the models. A smaller SEE indicated a more accurate model, whereas a larger SEE indicated greater prediction error.
To internally validate the models, we predicted LM and FM values for all participants in the validation group using the developed anthropometric models. Using paired t-tests, we compared the predicted and observed values to determine any differences. In addition, the adjusted R 2, AIC, and SEE of the fitted models in the training group were compared to those in the validation group. A model with a high adjusted R 2, a low AIC, and a high SEE for each LM and FM was considered to be a good fit. All statistical tests were performed using RStudio.
Results
A total of 832 participants were included in the study. The mean ± SD age was 50.0 ± 16.2 years, and 498 (59.9%) were female. The mean ± SD for BMI, FM, FMI, LM, and LMI, as well as percentages of participants who met the BMI and %BF criteria for obesity, are shown in Table 1. The prevalence of %BF-defined obesity was 70.3% (161 participants) among those with obesity defined by BMI of ≥25 kg/m2 compared with 19.1% (84 participants) among those without BMI-defined obesity (p < 0.001). Through ROC analysis, among all participants, a BMI cutoff of 24.5 kg/m2 was identified as the best predictor of %BF-defined obesity, with a sensitivity of 71% and specificity of 85%. The optimal BMI cutoffs in subgroups of men and women were 24.1 kg/m2 and 24.3 kg/m2, respectively (Fig. 1). Logistic regression analysis demonstrated that the individuals with BMI ≥ 24.5 kg/m2 had an increased likelihood of %BF-defined obesity with an odds ratio of 13.7 (95% CI: 9.4–20.1), after adjusting for age and sex.
Characteristics of Participants
% Body fat-defined obesity was defined as percentage of body fat of >25% in males and >35% in females.
Independent t-test.
Mann–Whitney U test.
chi-square test.

Receiver operating characteristic curves for body mass index to detect percentage of body fat-defined obesity for all participants, males and females. AUC, all participants: 0.864, 95% CI: 0.838–0.890; Males: 0.872, 95% CI: 0.824–0.919; Females: 0.864, 95% CI: 0.832–0.896. Best BMI cutoff, all participants: 24.5 kg/m2; Males: 24.1 kg/m2; Females: 24.3 kg/m2. Sensitivity, all participants: 0.710; Males: 0.786; Females: 0.730. Specificity, all participants: 0.852; Males: 0.795; Females: 0.841. BMI-defined obesity was defined as body mass index ≥25 kg/m2. % Body fat-defined obesity was defined as percentage of body fat of >25% in males and >35% in females. AUC: area under the curve; 95% CI: 95% confidence interval.
Lean mass and fat mass across different age groups in the Thai population
Age- and sex-stratified percentiles of LM, LMI, FM, FMI, and %BF are shown in Figures 2 and 3, as well as in Supplementary Tables S1–S5. In males, the median LM decreased with age from 49.4 kg in 20–29 years group to 42.3 kg in ≥70 years group. The median LMI was relatively unchanged from age 20–59 years at 17.7–18.0 kg/m2 and dropped to 16.4 kg/m2 in ≥70 years group (Fig. 2). The median FM and FMI increased with age from 6.3 kg and 2.5 kg/m2 in 20–29 years group to 11.9 kg and 4.6 kg/m2 in 60–69 years group and then decreased to 10.3 kg and 4.1 kg/m2 in ≥70 years group (Fig. 3). In females, the median LM peaked at age 30–39 years at 34.6 kg and decreased with age to 30.8 kg in ≥70 years group. The median LMI peaked at age 40–49 years at 14.6 kg/m2 and decreased with age to 13.8 kg/m2 in ≥70 years group (Fig. 2). The median FM and FMI peaked at age 50–59 years at 20.7 kg and 9.0 kg/m2 and decreased with age to 15.9 kg and 7.1 kg/m2 in ≥70 years group (Fig. 3). As shown in Table 2, the prevalence of BMI-defined obesity and %BF-defined obesity peaked at age 60–69 years (32.7% and 27.3%) in males and 50–59 years for BMI-defined obesity (42.2%) and 60–69 years for %BF-defined obesity (53.5%) in females.
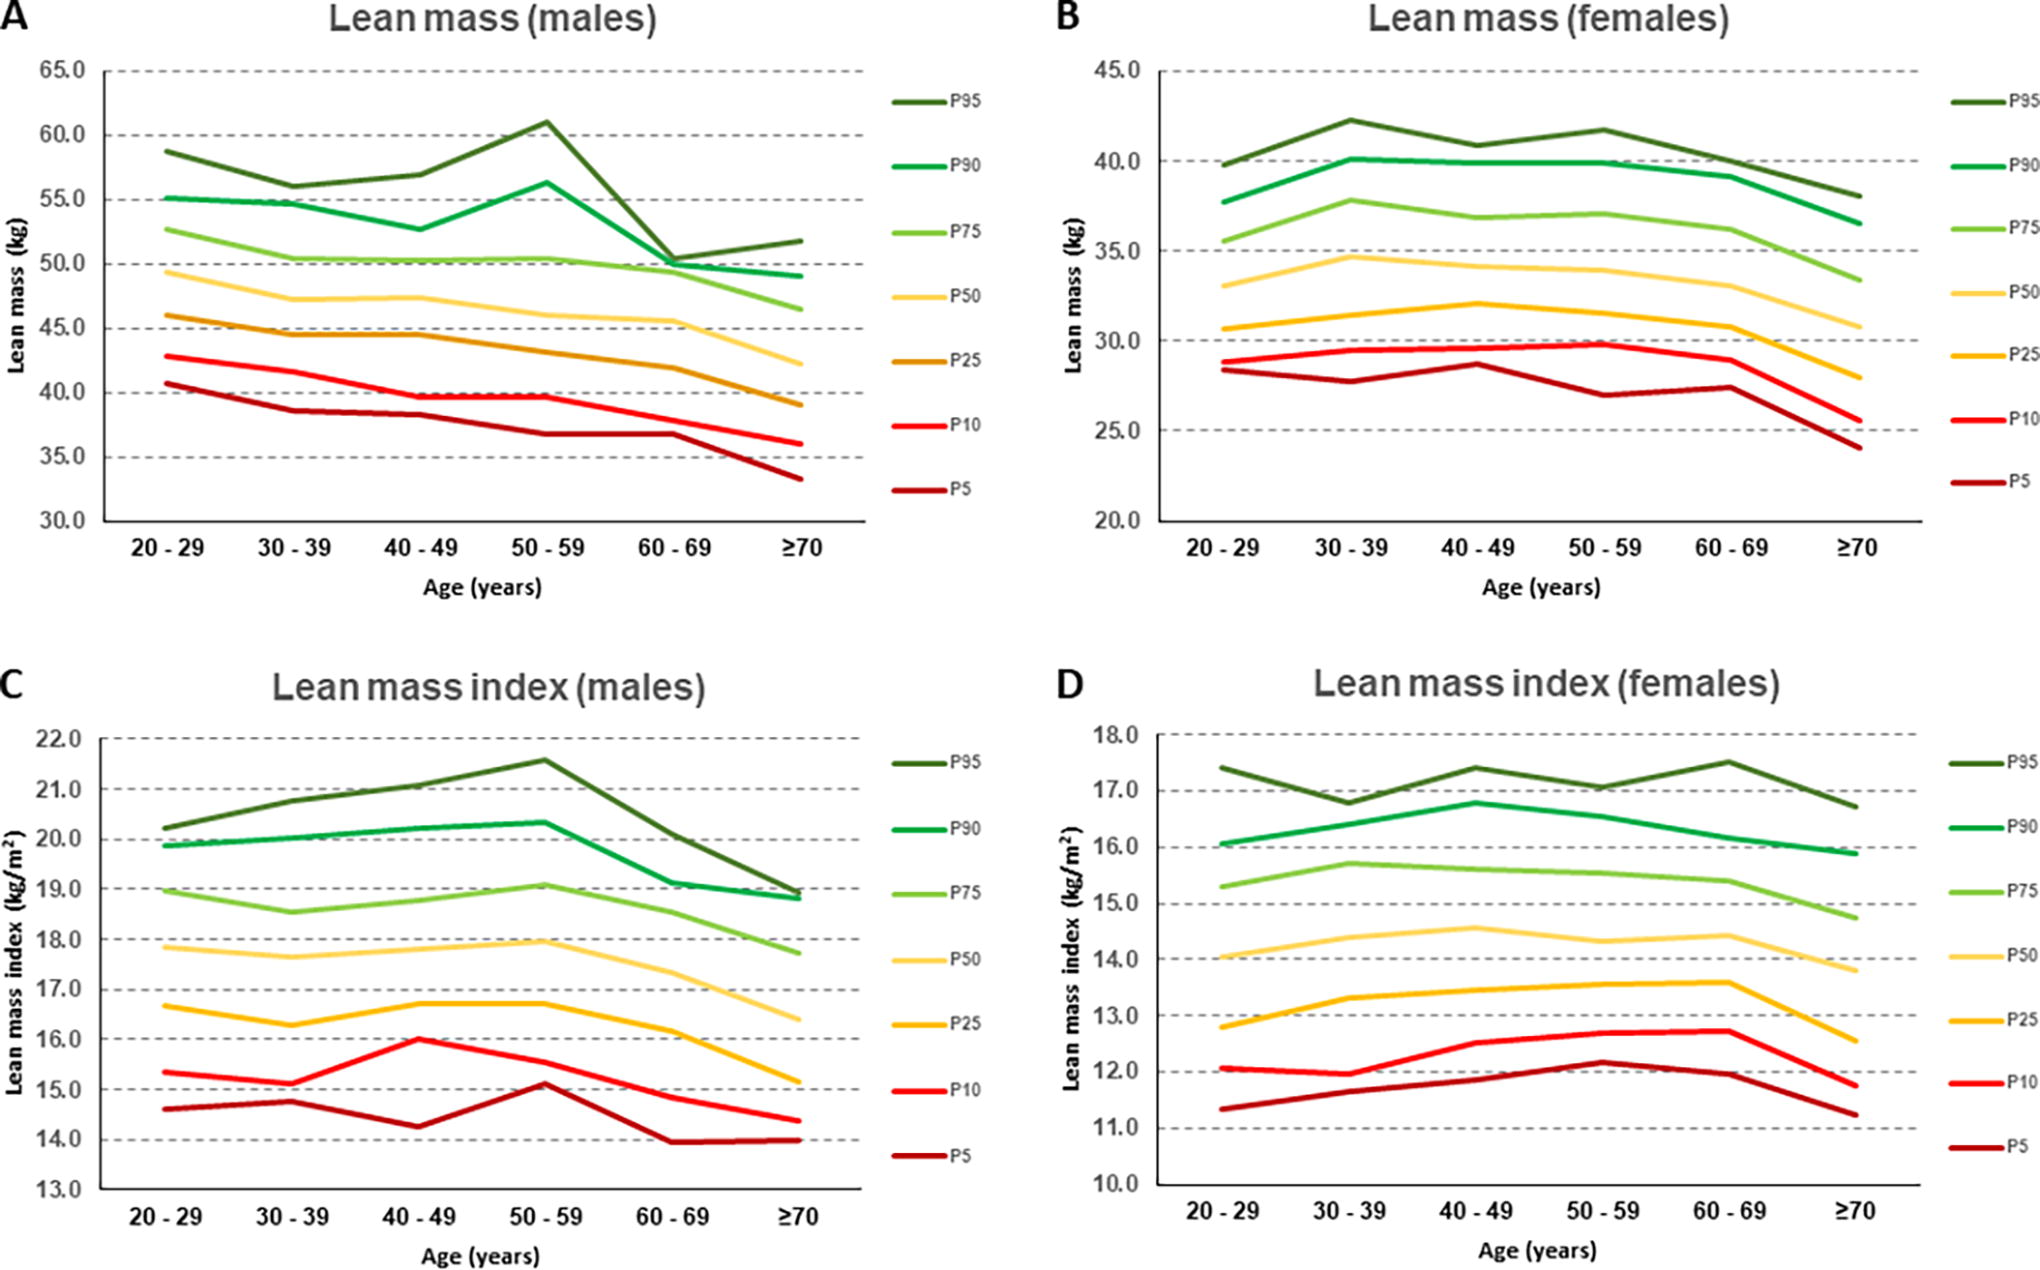
Age-stratified 10th, 25th, 50th, 75th, 90th, and 95th percentiles of lean mass and lean mass index in male and female participants.
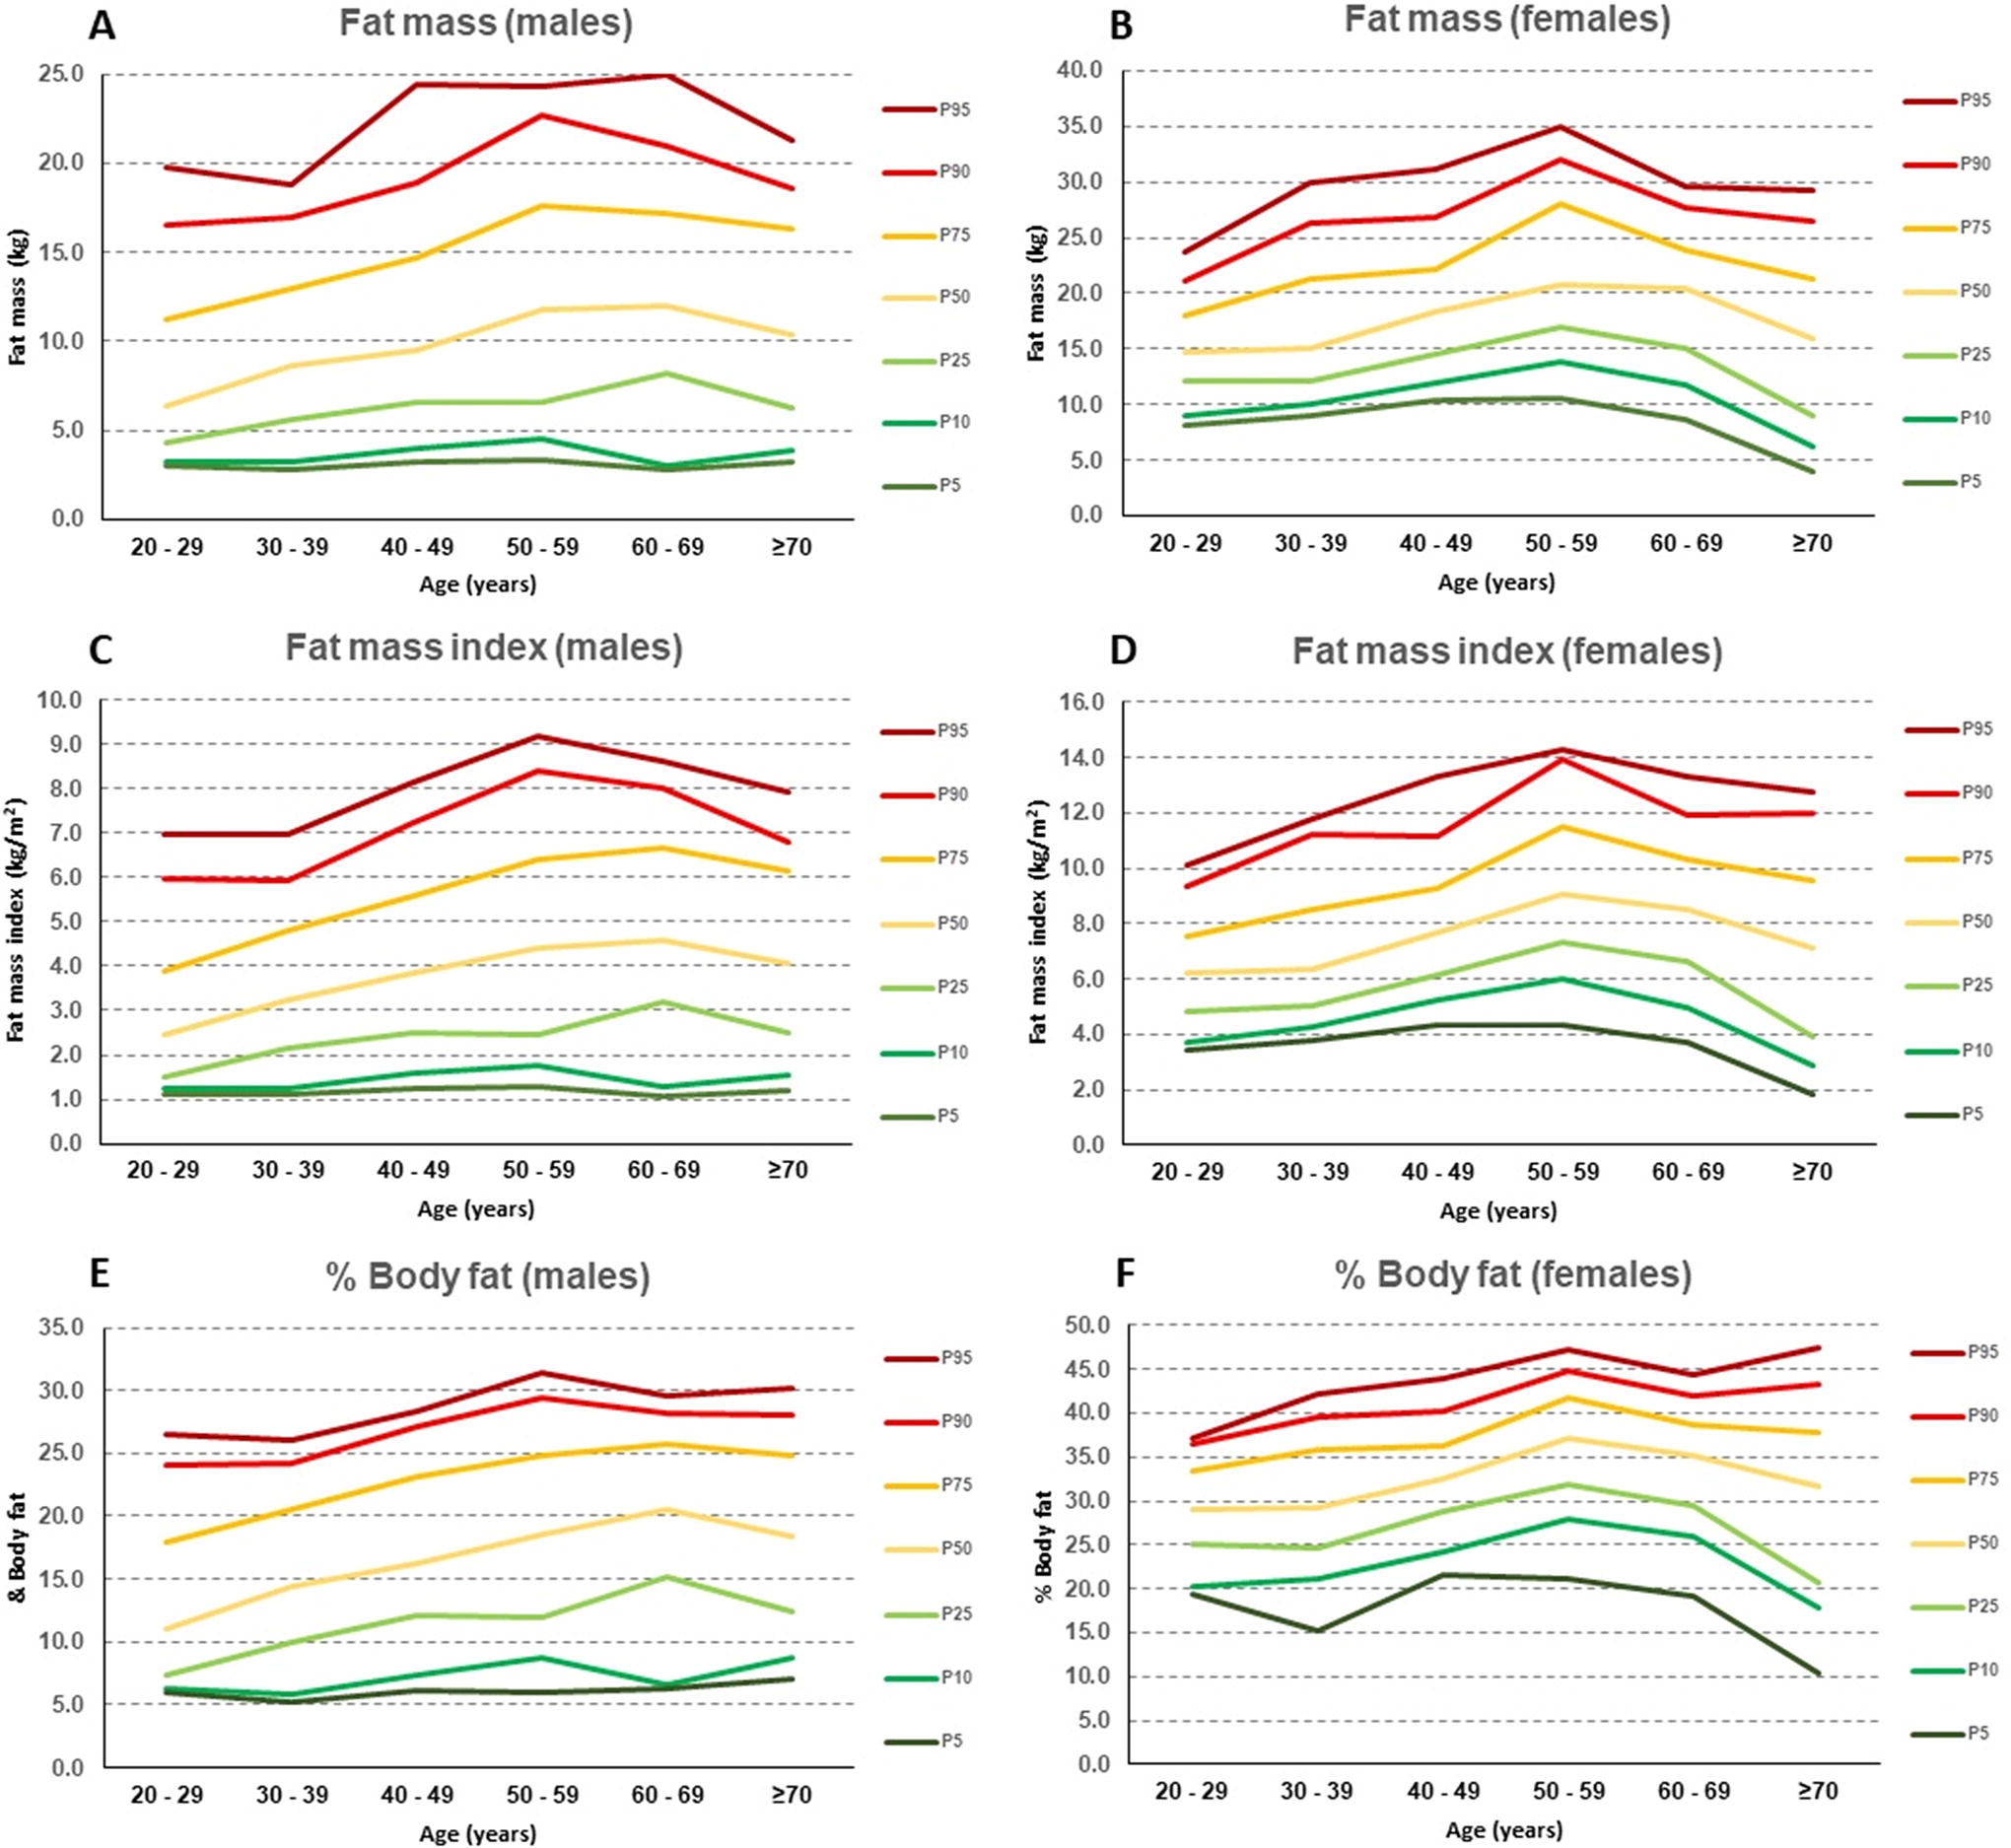
Age-stratified 10th, 25th, 50th, 75th, 90th, and 95th percentiles of fat mass, fat mass index, and % body fat in male and female participants.
Age-Stratified Prevalence of Obesity Defined by Body Mass Index and % Body Fat
BMI-defined obesity was defined as BMI) ≥25 kg/m2.
% Body fat-defined obesity was defined as percentage of body fat of >25% in males and >35% in females.
BMI, body mass index; %BF, % body fat.
Anthropometric prediction models for lean mass and fat mass
The participants were randomly divided into two separate groups, the training group and the validation group, with a ratio of 2:1. There were no statistically significant differences in the distribution of sex, age, weight, height, and BMI between the training and validation groups (Supplementary Table S6).
The results of the three anthropometric candidate prediction models for LM and FM developed using the training dataset are presented in Table 3. The first model, including age, weight, and sex, for LM prediction explained 85% of the variance in LM (i.e., adjusted R 2 = 0.85) and had an AIC of 2889 and SEE of 3.2 kg. The second model, which included age, weight, height, and sex, explained 86% of the variance in lean body mass with an AIC of 2847 and a SEE of 3 kg. The final model that included age, BMI, and sex had the lowest adjusted R 2 of 0.76 and the highest AIC and SEE, which were 3151 and 4.0 kg, respectively. For FM prediction, the first model which included age, weight, and sex explained 79% of the variation in FM and had an AIC of 3005 and SEE of 3.5 kg. The second model which included age, weight, height, and sex explained 81% of the variation in FM and had the lowest AIC of 2967 and the lowest SEE of 3.4 kg. In contrast, the final model, including age, BMI, and sex, had the lowest adjusted R 2 of 0.78 and the highest AIC and SEE, i.e., 3151 and 3.7 kg, respectively. Polynomial terms did not significantly improve any of the models for LM and FM prediction.
Anthropometric Prediction Models for Lean Mass and Fat Mass in the Training Group (n = 561)
Linear regression analysis was performed to generate prediction models.
For sex variable, Male is the reference group.
Unit for SEE is kg.
AIC, Akaike information criterion; SEE, standard error of estimate.
We validated the three models using the validation group. As shown in Table 4, there was no significant difference between observed and predicted LM for any of the three models (P values of paired t-test = 0.12, 0.08, and 0.69, respectively) and no difference between observed and predicted FM in the first and second prediction models (P values of paired t-test = 0.14 and 0.09, respectively). However, we found a statistically significant difference in the final model for FM prediction (P value = 0.03). Furthermore, the adjusted R 2, AICs, and SEEs in the validation group were comparable to those in the training group for all models, as shown in Table 4. Based on these findings, the anthropometric prediction models incorporating age, weight, height, and sex (models 2 for LM and FM) were considered the best fit for predicting LM and FM, with the highest adjusted R 2 and lowest AIC and SEE among the various models. The internal validation showed that these models had good predictive accuracy.
Validation of Anthropometric Prediction Models for Lean Body Mass and Fat Mass in the Validation Group (n = 271)
Mean differences between predicted and observed values and their corresponding standard deviation. Unit for difference (observed-predicted values), SD, and SEE is kg.
P values from paired t-tests to examine differences between predicted and observed values.
AIC, Akaike information criterion; SD, standard deviation; SEE, standard error of estimate.
Discussion
Recent research suggests that assessments of LM and FM are useful in overcoming the limitations of BMI in determining the risks of various health consequences. Numerous studies have found that higher FMI and %BF are associated with metabolic syndrome, cardiovascular disease, osteoporosis, and all-cause mortality. 14 –18 LMI, on the other hand, can be used to assess nutritional status, physical activity, and mortality risk. 19 –21 However, because of a lack of reference values for LM and FM in diverse groups, the clinical relevance of assessing these parameters to stratify the risk of co-morbidities in general clinical practice is still limited.
To the best of our knowledge, this study is the largest report on age- and sex-specific normative values for LM and FM in the Southeast Asian adult population. We found that peak LM occurred during early adulthood (ages 20–29 years in males and 30–39 years in females) and decreased with age. In contrast, an inverse U-shaped relationship was observed between FM and age, with FM reaching its peak between the ages 60–69 years in males and 50–59 in females and decreasing with increasing age. These observations are in line with data from several previous studies and can be explained by metabolic alterations associated with aging. 22 –30
It is worth noting that there are some discrepancies in the observed trends in LM and FM among age groups across studies in different populations. In a study of 537 Singaporean adults, FMI remained comparatively constant across age groups for both males and females, whereas LMI peaked in the 40s for men and 50s for women. 22 A study using data from the Korea National Health and Nutrition Examination Survey IV (KNHANES IV), which included 4476 men and 5980 women, revealed that fat percentages peaked at age 30 in men and 40 in women, whereas LMI decreased with age in men but peaked at the age 55 in women. 23 In a study of 5688 Chinese adults, the LMI peaked at age 50 and declined with age for males, whereas it increased with age and plateaued at age 60 for females. The same study also revealed that FMI increased with age in both men and women. 24 According to data from the National Health and Nutrition Examination Survey (NHANES), the United States, LMI peaked between ages of 30–40 years for White females, 40 years for Black male and female, 45 years for Hispanic females, and 50 years for White and Hispanic males. In contrast, FMI peaked between the ages of 50–60 years for White and Hispanic males, 55–65 years for Black and Hispanic females, and 60–70 years for White females. In addition, FMI consistently increased with age in Black males. 25,26 The differences observed in LM and FM across age groups are most likely influenced by genetic, as well as dietary and lifestyle factors. 27,28
Nowadays, routine direct measurement of body composition remains technically infeasible, making measurement of LM and FM of limited use in general clinical practice. Using the ROC analysis, we found that BMI cutoff of 24.54 kg/m2 best predicted %BF defined obesity (>25% in male and >35% in female) with sensitivity and specificity of 71% and 85%, respectively. This cutoff value is similar with the result of a previous study in the Korean population which found that BMI cutoff of 24.2 kg/m2 best predicted %BF-defined obesity with sensitivity and specificity of 78% and 71%, respectively. These data suggest that BMI alone has limited diagnostic accuracy in determining increased adiposity. 9 Furthermore, a previous study of 436 Thai adults found that %BF predictive models, including age, sex, and BMI, were fairly accurate, with a 9% difference between measured and predicted %BF. 31 In our study of 832 participants, we generated different anthropometric prediction models for LM and FM. The models incorporating age, sex, weight, and height as independent variables were considered appropriate for predicting LM and FM in the validation cohort. We propose that these models could be used in clinical practice as a simple predictive tool for LM and FM; however, further investigation is required to establish their utility.
This study carries some limitations that should be acknowledged. First, the generalizability of our findings may be limited due to the inclusion of only adults from Northeast Thailand without using a systematic sampling method. The genetic and environmental factors specific to this region may not be representative of other populations. Second, we were unable to obtain data on the specific site of body composition, such as truncal and appendicular LM and FM, which would have been useful for predicting the presence of medical co-morbidities. Moreover, certain anthropometric parameters, such as waist, hip, mid-arm, or thigh circumference, are not available in this study. These parameters may be valuable predictors for body composition and should be considered in future studies. Finally, it is crucial to note that our study was cross-sectional and lacked clinical outcome data, such as the diagnosis of medical co-morbidities, which might have assisted in identifying appropriate cutoff values for LM and FM. To establish these cutoff values and evaluate the predictability of LM and FM on clinical outcomes, a longitudinal follow-up study evaluating clinical outcomes is necessary.
Conclusion
In conclusion, we derived age-stratified normative values for body composition parameters, including LM, FM, LMI, FMI, and %BF, from cross-sectional data of community-dwelling Thai adults. We found that peak LM levels are reached during early adulthood and decline with age. In contrast, an inverse U-shaped relationship was observed between FM and age, as FM reached its peak in late maturity. In addition, anthropometric prediction models for LM and FM were developed. The models incorporating age, sex, weight, and height as independent variables were found to be effective for predicting LM and FM in the validation cohort and were proposed as practical tools for assessing body composition in general clinical practice.
Footnotes
Authors’ Contributions
Study concept and design: C.P., N.C., and T.R.: acquisition of data: C.P. and D.S.: analysis and interpretation of data: C.P., N.C., and T.R.: drafting of the article: C.P., N.C., and T.R.: critical revision of the article: C.P., N.C., and T.R.: statistical analysis: N.C. and T.R.: administrative, technical, or material support: C.P. and D.S.: and study supervision: C.P.
Author Disclosure Statement
All authors declare no conflict of interest.
Funding Information
No funding was received for this article.
Supplementary Material
Supplementary Table S1
Supplementary Table S2
Supplementary Table S3
Supplementary Table S4
Supplementary Table S5
Supplementary Table S6
References
Supplementary Material
Please find the following supplemental material available below.
For Open Access articles published under a Creative Commons License, all supplemental material carries the same license as the article it is associated with.
For non-Open Access articles published, all supplemental material carries a non-exclusive license, and permission requests for re-use of supplemental material or any part of supplemental material shall be sent directly to the copyright owner as specified in the copyright notice associated with the article.
