




Abstract
Background:
Metabolic syndrome (MetS) in children is a rising health issue that is strongly associated with cardiovascular diseases and type 2 diabetes mellitus development. Low-affinity antibodies reactive to leptin and ghrelin are suggested to regulate hormone stability and function; nevertheless, the role of the leptin/ghrelin axis and antibodies reactive to both hormones in relation to MetS or its components in the pediatric population remains unknown.
Methods:
Fifty-eight children (7–12 years) were included and categorized according to the presence of one or more criteria for the diagnosis of MetS or according to body mass index. Body composition, biochemical variables, and metabolic risk indexes were determined. Antibodies reactive to leptin and ghrelin were quantified by an in-house enzyme-linked immunosorbent assay test. Ratios of leptin/ghrelin hormones and anti-leptin/anti-ghrelin immune complexes were obtained.
Results:
The biochemical variables glucose (P = 0.0009), insulin (P = 0.0001), leptin (P = 0.0036), HOMA-IR (homeostatic model assessment for insulin resistance) (P < 0.0001), and plasma atherogenic index (P < 0.0001) were significantly higher in children with two or three components of MetS (MetS 2–3) in comparison to children with none or one component (MetS 0–1). Ratios of leptin/ghrelin (P = 0.0307) and anti-leptin/anti-ghrelin immune complexes (P = 0.0338) were higher in MetS 2–3 group versus MetS 0–1 group. In MetS 2–3 group, both insulin (r = 0.4361, P = 0.0293) and HOMA-IR (r = 0.4761, P = 0.0161) were positively correlated with the leptin/ghrelin hormone ratio.
Conclusions:
The higher leptin/ghrelin hormone ratio scores observed in MetS 2–3 group, along with their correlation with insulin levels and HOMA-IR, highlight the role of leptin and ghrelin on insulin sensitivity and metabolic regulation. An increased ratio of anti-leptin/anti-ghrelin immune complexes suggests affinity changes in these antibodies that may lead to alterations in hormone function.
Introduction
Metabolic syndrome (MetS) encompasses a cluster of interrelated risk factors that can appear simultaneously or sequentially, including abdominal obesity, dyslipidemia, high blood pressure (BP), and glucose intolerance. 1 Even though MetS has been extensively investigated in the adult population, the increasing prevalence in the pediatric population in recent decades has become a concerning health issue. For instance, in 2020, a systematic review reported that the prevalence of global MetS in children was 2.8%, equivalent to 25.8 million children. 2 Moreover, MetS is one of the main predisposing factors for the development of cardiovascular diseases and type 2 diabetes mellitus (T2DM) in adulthood. 3 Nevertheless, both the prevalence and diagnosis of MetS in the pediatric population pose challenges due to the lack of a unified consensus for its diagnosis, since MetS classification depends on the criteria, methodologies, and cutoff points used for its identification. 1
Leptin and ghrelin are key hormones involved in food intake and metabolic regulation. 4 Both hormones work together, although in opposing ways, and participate in lipid and glucose metabolism, eating behavior, and energy balance. 5 Moreover, various studies have suggested that both hormones play a significant role in the pathogenesis of MetS. 6 It has been reported that low levels of ghrelin are associated with an increase in number of MetS components, 7 whereas elevated levels of leptin have been linked to insulin resistance and the pro-inflammatory state characteristic of obesity and MetS. 8 Additionally, the relationship between both hormones can be assessed with the leptin/ghrelin ratio, and this parameter is increased in patients with obesity, DM2, and MetS 9 ; taken together, it is proposed that the disruption of metabolic processes involving these two hormones contributes significantly to the development of MetS or its worsening. 10
Recently, the identification of low-affinity antibodies reactive to leptin and ghrelin has opened a new perspective about the role of the immune system as an indirect modulator of metabolism and eating behavior. 11 Interestingly, changes in the levels and affinity of these antibodies have been reported in obesity and T2DM, suggesting that they may play a role in regulating hormone activity and leptin and ghrelin resistance. 12,13 Moreover, a study conducted in the Mexican population reported that anti-leptin immunoglobulin G (IgG) levels differ between children and adolescents with overweight or obesity, highlighting that age and disease progression over time may be contributing factors to the alteration in these antibody levels. 14 In addition, we have shown that levels of anti-leptin and anti-ghrelin IgG antibodies differ between sexes in young subjects, and these antibodies are distinctively correlated to appetitive traits and anthropometric parameters, suggesting a role in the regulation of eating behavior. 15
However, the role of the leptin/ghrelin axis and antibodies reactive to both hormones in relation to MetS or its components in the pediatric population remains unknown. Therefore, the present exploratory study aimed to analyze the leptin/ghrelin axis and its associated antibodies in relation to body composition, biochemical variables, and the presence of MetS and its components in a population of Mexican children. Exploring the potential interactions and pathological implications of this axis could be useful for the prevention, early diagnosis, or risk estimation of MetS in children.
Materials and Methods
Study population
For this cross-sectional study, we used clinical data and serum samples from a biobank generated in a previous study. 14 This cohort included participants from 7 to 12 years of both sexes; for the current data analysis, five children from that study were excluded due to missing data for MetS variables, and a total of 58 children were included in the present study for data analysis and anti-ghrelin antibodies quantification. The children included in this study were categorized in two ways: the first one, according to the presence of one or more criteria from The National Cholesterol Education Program-Adult Treatment Panel III (NCEP-ATP-III) for the diagnosis of MetS, which include the following: high-density cholesterol lipoprotein (C-HDL) ≤40 mg/dL, hypertension when systolic BP and diastolic BP resulted in ≥90th percentile for age, gender, and height, fasting glucose ≥100 mg/dL, and waist circumference with cutoff point at ≥90th percentile for age and gender. The presence of none or a single criterion was taken to categorize children into group one (MetS 0–1), and the presence of two or more criteria was used to categorize them into group two (MetS 2–3). The second categorization was in relation to body mass index (BMI), using the World Health Organization (WHO) criteria 16 for normal weight (NW group) and overweight or obesity (OW+OB group).
The study was approved by the Ethics Research Committee of the University of Guadalajara, Centro Universitario de la Costa (registry CUCPV/CEICUC/2018/002), and was conducted according to the principles of the Declaration of Helsinki. The participation of all subjects was voluntary; an informed consent letter was signed by the children’s parents or legal guardians, as well as a letter of assent from the children.
Anthropometry, body composition, and blood pressure
Height was measured with a stadiometer (SmartMet, USA) and weight with bioelectrical impedance equipment (TANITA BF-679W, Japan), which also recorded the percentage of body fat. Waist circumference was measured in standing position, just above the iliac crest, with an anthropometric tape (Hoechstmass, Germany). All anthropometric measurements were taken with participants wearing light clothing and no shoes and were performed by certified nutritionists following the International Society for the Advancement of Kinanthropometry guidelines. Subsequently, BMI was calculated using the WHO
16
BMI-z-score calculation table for children, considering the following parameters: NW: 15th–85th percentiles (z more than or equal to −1; less than or equal to +1). Overweight > 85th percentiles (z-score more than +1). Obesity > 98th percentiles (z-score more than +2).
Systolic and diastolic BP were measured in a sedentary position leaving a 3–5 minute resting interval using an adjustable cuff digital automatic monitor (Omron HEM-7120) following the recommendations for BP measurement.
Blood extraction and biochemical assays
Children and tutors were asked to attend the Clinical Laboratory Analysis Unit of Centro Universitario del Sur, adhering to 8–12 hr fasting for peripheral blood sample collection through venipuncture in the arm. The blood was placed in a Vacutainer tube (BD Vacutainer, USA), and was centrifuged at 3500 rpm to separate the serum for biochemical assays.
Glucose (Cat. No. 1001190), total cholesterol (Cat. No. 41022), high-density lipoprotein cholesterol (HDL-C, Cat. No. BSIS37-E), and triglycerides (TG, Cat. No. 1001313) were determined using enzymatic and colorimetric methods with commercial kits from Spinreact (Girona, Spain) following the manufacturer’s methodology. Additionally, the calculation of low-density lipoprotein cholesterol (C-LDL) levels was obtained using the Friedewald equation: C-LDL = total cholesterol − (TG /5) − HDL. 17 Insulin levels were measured by enzyme-linked immunosorbent assay (ELISA) sandwich kit according to the commercial suppliers (Cat. No. EIA-2935, DRG International, Germany).
Metabolic risk indexes calculation
Insulin resistance and pancreatic β-cell function were determined using the homeostatic model assessment (HOMA-IR and HOMA-β), respectively, using the formulas
18
:
The cutoff value used for insulin resistance in children was >3.43. 19
The plasma atherogenic index (AIP) used for cardiovascular risk assessment was calculated using the formula
20
:
The risk categories of AIP were defined as low risk (AIP < 0.11), intermediate risk (AIP = 0.11–0.21), and high risk (AIP > 0.21), according to the values established by Sapunar et al. 20
Leptin and ghrelin quantification
Fasting total leptin and ghrelin concentrations were assessed using ELISA kits (Cat. No. EIA-2395, DRG International and DRG®, Cat. No. EIA-3706, respectively) according to the manufacturer’s instructions. For leptin essay, the detection range was 0.7 ng/mL-100 ng/mL with an intra-assay coefficient of variation (CV) of 2%. In the case of ghrelin, detection range was 0–100ng/m with an intra-assay CV of 9%.
Quantification of antibodies reactive to leptin and ghrelin
For the quantification of anti-leptin and anti-ghrelin IgG antibodies, in-house ELISAs were performed according to a standardized protocol by our group21 that is based on the original protocol described by Fetissov
21
and can be consulted elsewhere.
14
In both cases, duplicate samples were performed and exhibited a CV <15%. IgG anti-leptin and anti-ghrelin antibodies levels were expressed as optical density (OD), whereas IgG immune complex percentages (% ICs) were calculated using a ratio between free and total fractions of IgGs by the following formula:
Leptin/ghrelin ratio and anti-leptin/anti-ghrelin ratios
The values obtained from leptin and ghrelin serum levels were divided to obtain the leptin/ghrelin hormone ratios, likewise, the percentages of immune complexes of anti-leptin and anti-ghrelin antibodies were divided to obtain the anti-leptin/anti-ghrelin immune complexes ratio.
Statistical analyses
Data distribution was verified using the D’Agostino–Pearson normality test. Descriptive statistics, including mean ± standard deviation (SD), was used to describe quantitative variables with parametric distribution, and median (25–75 percentiles) was used to describe variables with nonparametric distribution. Categorical variables were expressed as percentage and absolute frequency. Differences between the two groups were assessed using Student’s t-test or Mann–Whitney U test according to data distribution. Pearson’s or Spearman’s correlation coefficients (rho) analyses were performed to evaluate the relationships between variables. Data analyses and graphs were plotted using GraphPad Prism 8.0 (GraphPad Software Inc., San Diego, CA). P < 0.05 was considered statistically significant.
Results
Characteristics of children population
Sociodemographic characteristics, body composition, and biochemical parameters, as well as hormone and autoantibody fraction levels, are shown in Table 1. Variables were compared according to the number of criteria for MetS diagnosis (MetS 0–1 vs. MetS 2–3) and according to BMI classification (NW vs. OW+OB). It was found that height, weight, waist, hip circumference, body fat, and BMI were significantly increased in MetS 2–3 group in comparison to MetS 0–1 group. Similarly, these variables were elevated in OW+OB group compared with NW group. Interestingly, when children were categorized by MetS criteria, we found that diastolic BP was significantly elevated in MetS 2–3 group (P = 0.0086) compared with MetS 0–1, but this difference was not detected according to BMI analysis. Considering the total cohort, the presence of MetS according to NCEP-ATP-III criteria was 12% in this sample of Mexican children.
Sociodemographic, Anthropometry, Body Composition, Biochemical, Metabolic Index, and Autoantibodies Characteristics of Children
P values ≤0.05 were considered statistically significant and were highlighted in bold.
Data are shown as mean ± SD or median (25–75th centile). Difference between groups was assessed by Student’s t-test or Mann–Whitney U test in accordance with distribution.
AIP, plasma atherogenic index; BMI, body mass index; HC, hip circumference; HDL-C, high-density lipoprotein cholesterol; HOMA-IR, homeostatic model assessment for insulin resistance; HOMA-β, homeostatic model assessment for pancreatic β-cell function; LDL-C, low-density lipoprotein cholesterol; MetS, metabolic syndrome; TC, total cholesterol; TG, triglycerides; WC, waist circumference; W/H index, waist/hip index.
With regards to biochemical variables, it was found that TG (P < 0.0001), glucose (P = 0.0009), insulin (P = 0.0001), and leptin (P = 0.0036) levels were significantly higher in the MetS 2–3 group than the MetS 0–1, conversely, levels of C-HDL were lower (P = 0.0209) in the MetS 2–3 group. On the contrary, when comparing these variables according to BMI, we found that only glucose (P = 0.035), insulin (P < 0.0001), and leptin (P < 0.0001) were higher in OW+OB group than NW children. No differences were found in total cholesterol, C-LDL, or ghrelin levels between groups independently of classification.
When assessing the metabolic indexes, we observed higher scores of HOMA-IR and AIP in the MetS 2–3 group than the MetS 0–1 group. These differences were also consistent when comparing children in OW+OB group to those in NW group (Table 1).
Antibodies reactive to leptin and ghrelin in children
When analyzing children participants according to the number of MetS components, no significant differences were found in the levels of IgG anti-leptin and anti-ghrelin antibodies in their different fractions (free, total, and percentage of immune complexes) (Table 1). However, when categorizing by BMI, a significant increase in total IgG anti-leptin antibody levels (P = 0.006) was observed in OW+OB group compared with NW group. Analysis of children by sex showed that girls had higher levels of free (P = 0.049) and total (P = 0.0024) IgG anti-ghrelin antibodies compared to boys, and the total fraction of IgG anti-leptin antibodies was also higher in girls than in boys (P = 0.0114) (data not shown).
Correlation analyses of anti-leptin and anti-ghrelin IgG antibodies with anthropometric, body composition, and biochemical parameters are shown as a heatmap in Figure 1. A higher number of significant correlations of these parameters were found in MetS 0–1 group in comparison to MetS 2–3 group. Free anti-leptin antibodies correlated negatively with insulin, leptin, and HOMA-IR, whereas height, weight, waist and hip circumference, body fat, and BMI showed a positive correlation with free leptin antibodies in MetS 0–1 group. Conversely, IgG anti-ghrelin antibodies (and their fractions) showed no significant correlations with these parameters in children despite categorization.
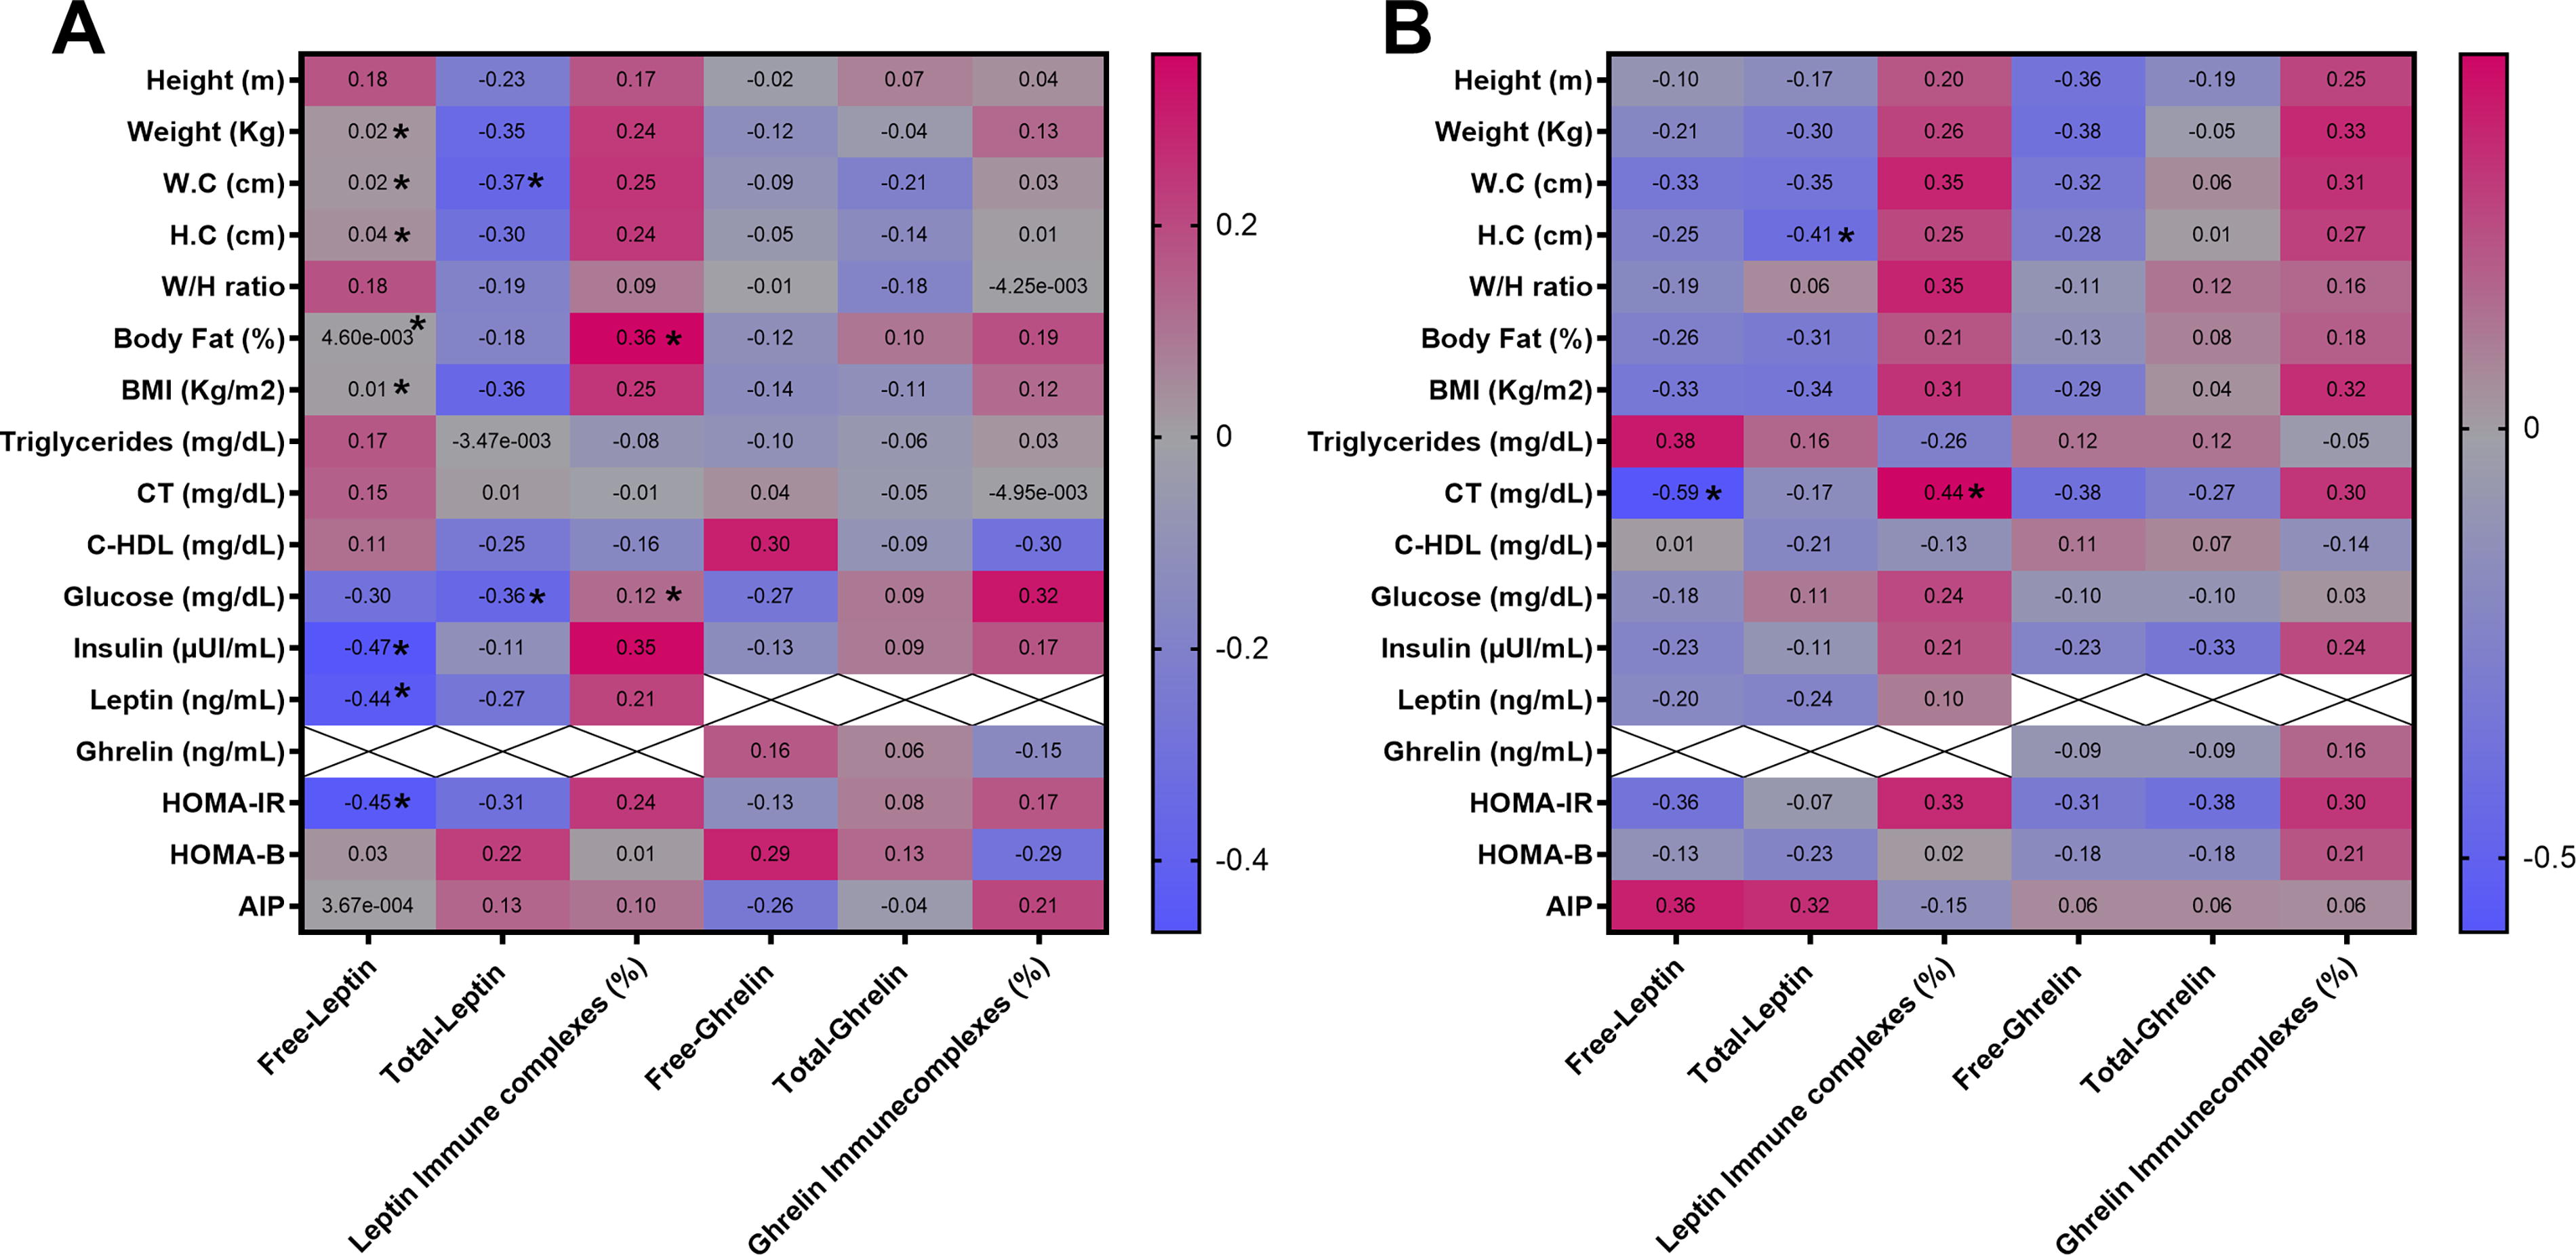
Correlations between anti-leptin and anti-ghrelin antibodies on its different fractions (free, total, and immuncomplexes) with anthropometric, body composition, and biochemical parameters in children categorized by MetS components.
Analysis of leptin/ghrelin hormones and anti-leptin and anti-ghrelin ratios
When comparing the leptin/ghrelin hormone ratios according to children categorization, it was found that the MetS 2–3 group showed higher leptin/ghrelin ratio scores (P = 0.0307) than the MetS 0–1 group. Similarly, children with OW+OB exhibited higher leptin/ghrelin ratio scores (P = 0.0439) than NW children (Fig. 2). Likewise, higher scores of leptin/ghrelin immune complexes ratios were found in the MetS 2–3 group (P = 0.0338) versus MetS 0–1 group, although no significant differences were found in antibodies ratios when categorizing children by BMI.
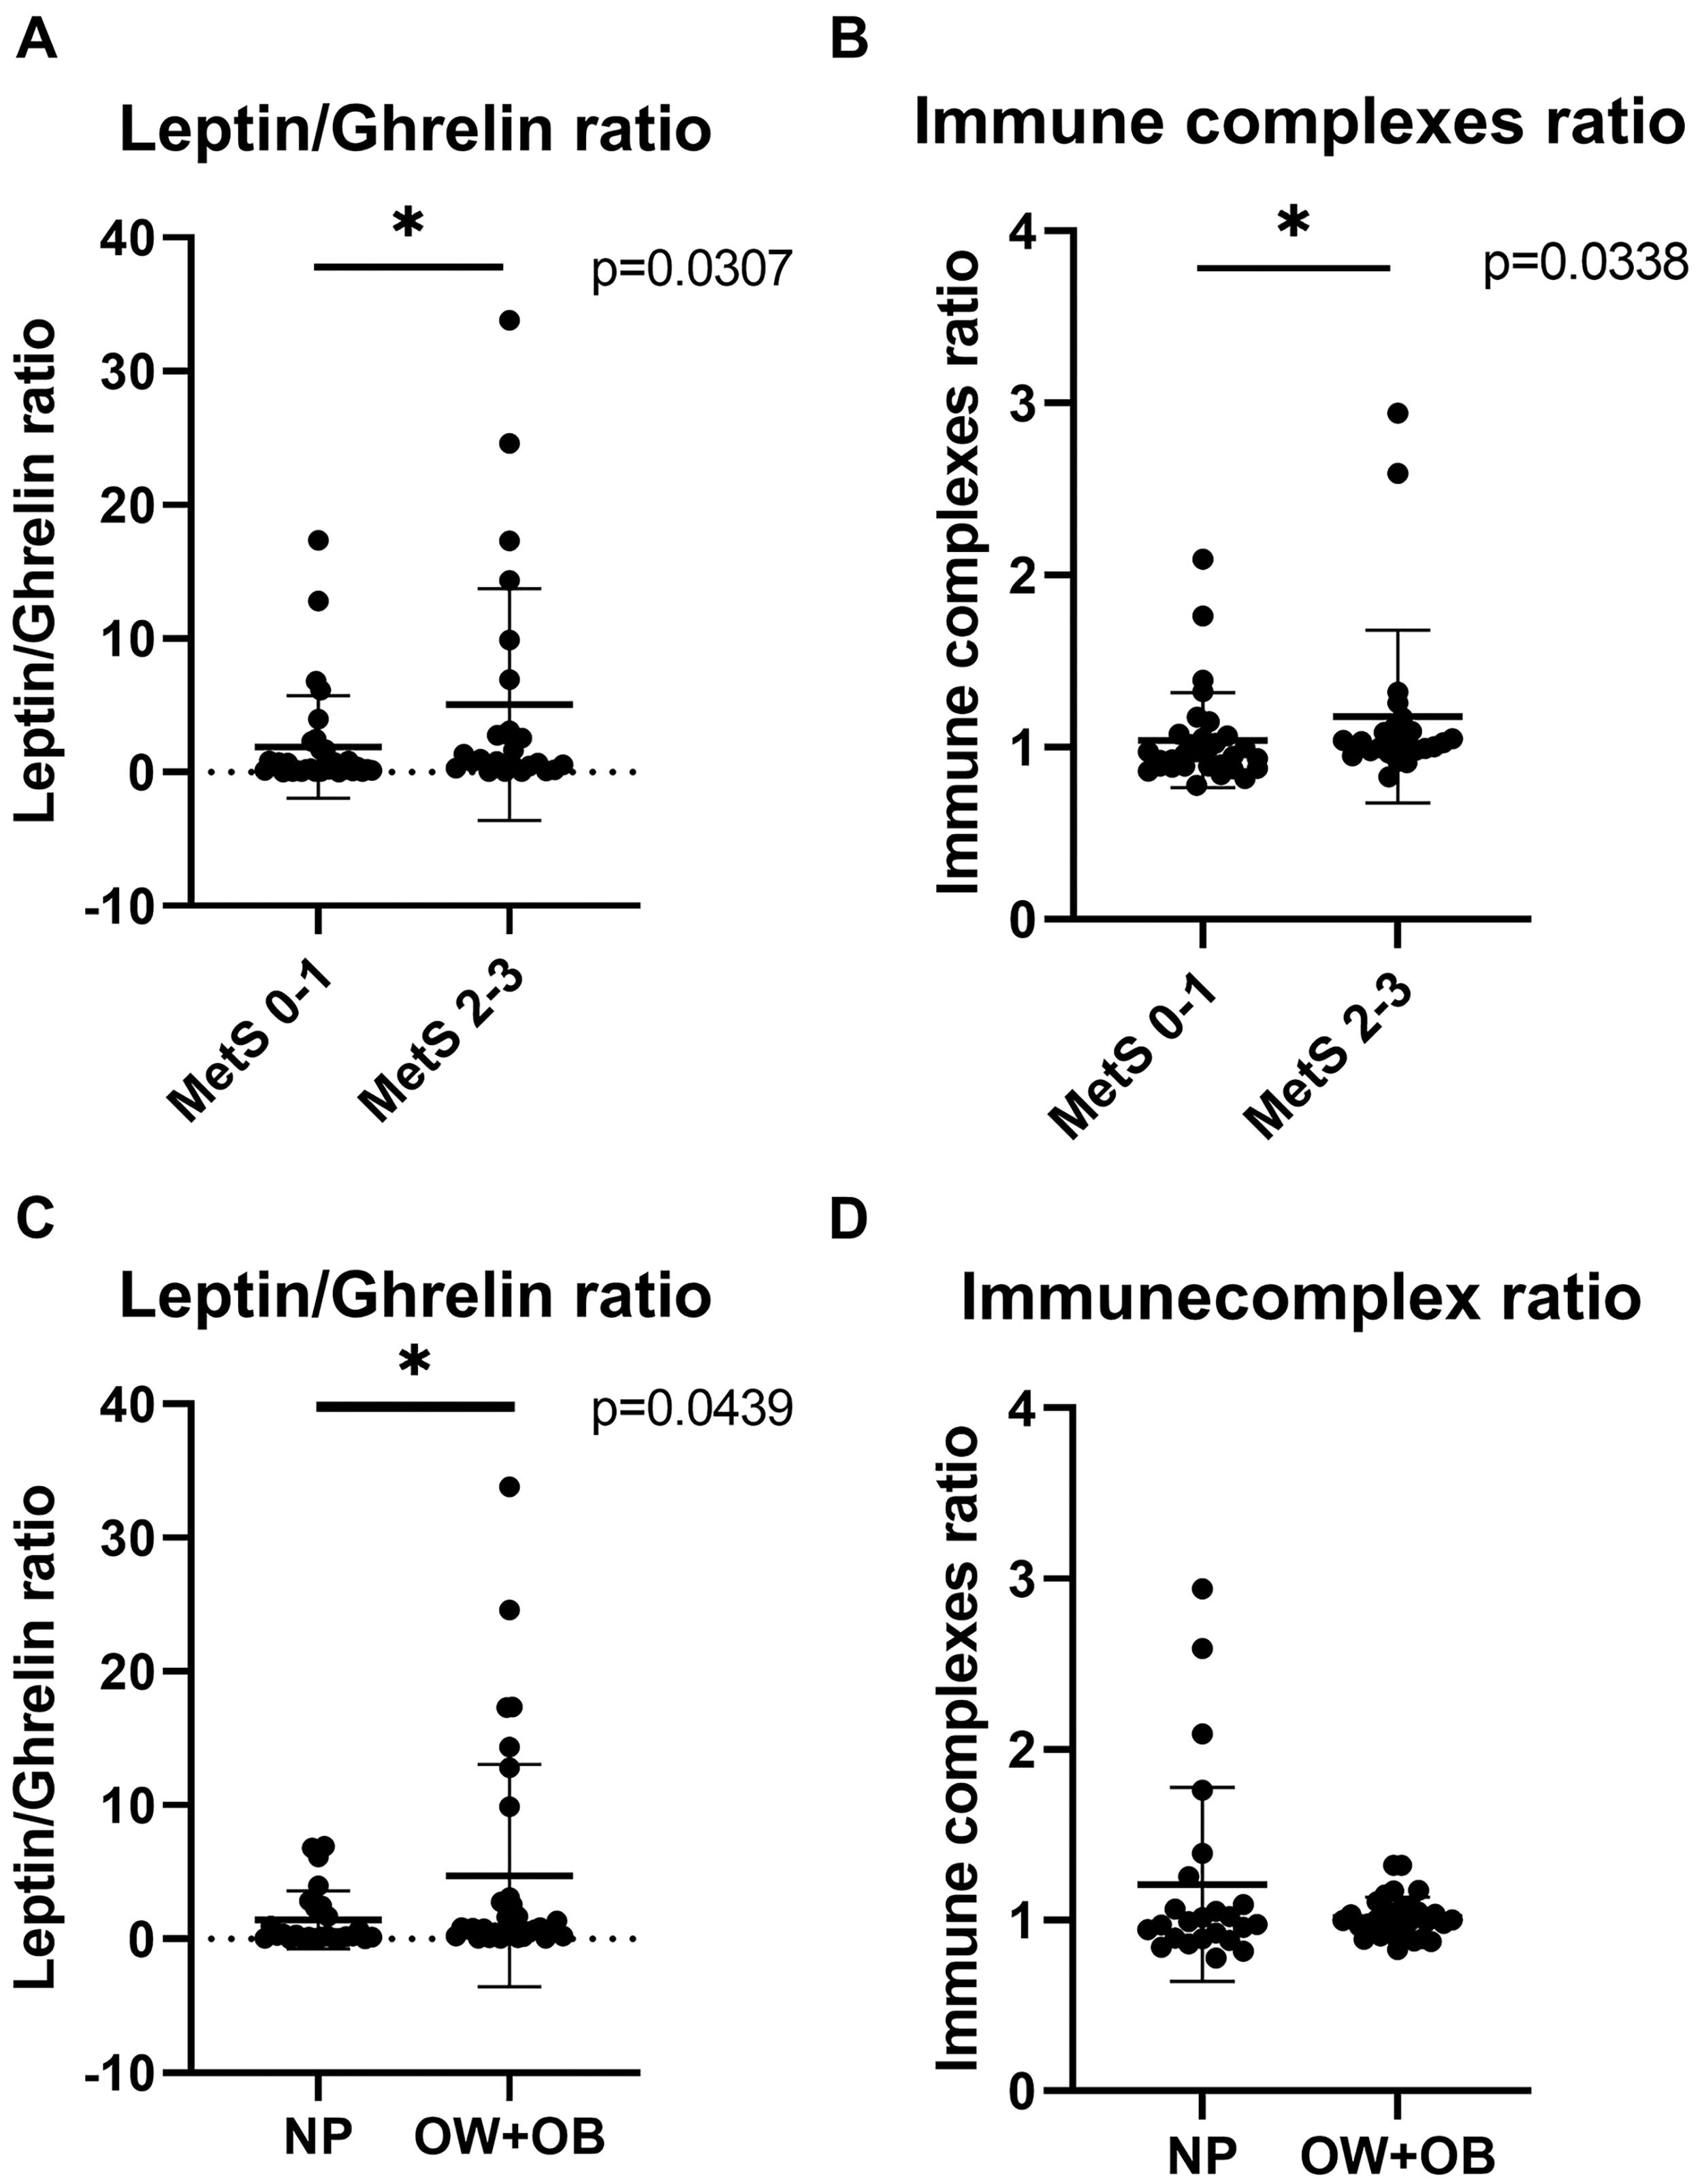
Leptin/ghrelin hormones ratio and IgG anti-leptin/anti-ghrelin immune complexes ratio in children. Leptin/ghrelin ratio
The relationship between the ratios of leptin/ghrelin hormones and immune complexes ratios with the anthropometric and metabolic variables was also explored. We observed that in MetS 0–1 group, the leptin/ghrelin ratio was positively correlated with the percentage of total fat (r = 0.3669, P = 0.0389) and HOMA-IR scores (r = 0.3646, P = 0.0369), while a negative correlation was found between this ratio and TG levels (r = −0.04193, P = 0.051). On the contrary, in the MetS 2–3 group, both insulin levels (r = 0.4361, P = 0.0293) and HOMA-IR (r = 0.4761, P = 0.0161) were positively correlated with the leptin/ghrelin hormone ratio (Fig. 3). No correlations were found between the leptin/ghrelin immune complexes ratios with the variables evaluated.

Correlations between leptin/ghrelin ratios with body composition and biochemical variables in children categorized by MetS components.
Discussion
Leptin and ghrelin are key appetite hormones that regulate insulin and glucose metabolism and have been involved in MetS. 10 The present exploratory study is the first to evaluate the relationship of leptin/ghrelin and its associated antibodies ratios in children that were categorized by MetS components.
Our study showed higher leptin/ghrelin ratio scores in children with two or three components of MetS than the children who presented none or one component. A previous study in children and adolescents with different nutritional status showed that the leptin/ghrelin ratio was higher in children with obesity in relation to NW and malnourished children. 22 This finding is likely explained by the increase in leptin and the decrease in ghrelin levels that are characteristic of the obesity state and occur as an adaptive mechanism in response to positive energy balance. In the adult population, similar studies have evidenced an increase in leptin/ghrelin ratio scores that are associated with alterations at metabolic level in obesity, T2DM, and MetS patients, 5,23 highlighting the possible use of this ratio and BMI as a biomarker for the risk of these conditions.
We also found positive correlations between leptin/ghrelin ratio with insulin levels and HOMA-IR in children with two or three components of MetS, a finding that reflects functional dysregulation in both hormones that impact insulin metabolism and may favor insulin resistance in this group. This notion is supported by a study in which individuals with values of HOMA-IR >2.5 and high leptin/ghrelin ratio before bariatric surgery had less metabolic improvements after surgery. 4 However, further studies are required in the children population to address the relevance of leptin/ghrelin ratio in monitoring improvements in insulin sensitivity.
Strikingly, no differences were detected in ghrelin levels in children regardless of categorization by MetS components or BMI. Although reductions in ghrelin levels have been reported in both children and adults with obesity, 24 –27 other studies show this is not always the case. 9,28 In this context, extended fasting or food restriction for up to 12 hr may elevate ghrelin levels. 29 Although 8–12 hr fasting was requested for blood sample collection in our study, some children may have been in a prolonged fasting state. In addition, other studies have evidenced that even sleep deprivation or reduced sleep time may also increase ghrelin levels in healthy individuals. 30,31 Therefore, taking into account both the duration and quality of sleep in children would be pertinent for future studies.
When evaluating anti-leptin/anti-ghrelin immune complexes ratios in children according to MetS components, we evidenced higher ratio scores in the group with two or three components in comparison to those with none or one. This increase may reflect the affinity changes of these antibodies to their respective hormones as previously found on metabolic diseases; for example, Bouhajja et al. and our study group have provided evidence of decreased affinity and reduced immunocomplexes of anti-leptin IgG antibodies in patients with obesity and T2DM in comparison to healthy subjects or patients with T2DM and overweight. 12,32 Conversely, the affinity of anti-ghrelin antibodies is decreased in patients with anorexia nervosa 33 while increased in individuals with hyperphagic obesity 34 and in patients with rheumatoid arthritis 35 in comparison to healthy individuals. However, few studies have evaluated anti-ghrelin antibodies in children; a preliminary study in Prader–Willi syndrome children reported that levels of IgG anti-ghrelin antibodies were higher than in healthy children and also evidenced that while acylated ghrelin levels decreased postprandially, anti-ghrelin antibodies remained constant, 36 suggesting that they exert hormone-protecting roles in circulation and thereby potentiate its orexigenic effect, contributing to hyperphagia, the key feature of this syndrome. Therefore, the changes of anti-ghrelin antibodies affinity are relevant for the regulation of hormonal activity.
The precise mechanisms responsible for generating the affinity changes in antibodies reactive to leptin and ghrelin are unknown, but it is hypothesized that exposure to gut microbial antigens with similar peptide sequences to these hormones is involved in these changes. 11 Accordingly, the gut microbiota dysbiosis associated with obesity, MetS, or specific diets could have a significant impact on antibody affinity changes.
Our study has some limitations that should be commented on; the first one is related to the sample size and the challenge for children recruiting for this type of study. Body composition analyses with high-accuracy equipment such as DEXA would have been valuable. Also, affinity kinetics assays to accurately measure antibody affinity would have been of additional value to demonstrate its alterations according to MetS components.
Conclusions
In conclusion, higher leptin/ghrelin hormone ratio scores were evidenced in children with two or three components of MetS than in those with none or one; furthermore, the correlations found between leptin/ghrelin hormone ratio with insulin levels and HOMA-IR in this group highlight the role of leptin and ghrelin in regulation of insulin sensitivity and metabolism. Anti-leptin/anti-ghrelin immune complexes ratio was also higher in this group, suggesting that affinity changes of these antibodies could impact and alter hormone function. Therefore, these antibodies ratios could be used as an additional marker for leptin and ghrelin axis monitoring in the context of metabolic disorders.
Footnotes
Authors’ Contributions
R.V.-S. was involved in formal analysis, data visualization, and writing the original draft. M.A.E.-R. contributed to data acquisition and curation, data interpretation, and validation. B.S.-C. contributed to resources, supervision, and reviewing. I.P.-R. was involved in supervision, data interpretation, and reviewing. E.V.-M. contributed to data acquisition/curation and data interpretation. L.B.-G. contributed to data acquisition and curation. L.G.-O. was involved in data supervision and validation. Z.R.-C. was involved in conceptualization, funding acquisition and resources, methodology and supervision of analysis, project administration, and article draft editing and reviewing. All authors read and approved the final version of article.
Author Disclosure Statement
No conflicting financial interests exist.
Funding Information
This research did not receive any specific grant from funding agencies in the public, commercial, or not-for-profit sectors.