




Abstract
Aims/Hypothesis:
Among various albumin posttranslational modifications (PTMs), N- and C-terminal truncations (HSA-DA and HSA-L) have also shown biomarker potential in disease states. We examined albumin truncation longitudinal trends and correlations during diabetes therapy toward possible future clinical applications.
Methods:
In a preliminary longitudinal therapy investigation, mass spectrometry was employed to track PTMs of human serum albumin (HSA), including glycation (GA), cysteinylation (CA or HNA1; reversible), di/trioxidation (OA or HNA2; irreversible), and truncation (TA). These modifications were correlated with ongoing therapy in four distinct subject groups: type 1 diabetes (T1DM), type 2 diabetes (T2DM), prediabetes-obesity (PDOB), and healthy controls (NORM), observed over a follow-up period extending up to 280 days.
Results:
Diabetes was associated with significant reduction (“deficiency”) of measured albumin truncations (For HSA-DA: T2DM = 0.32 ± 0.3%, p = 2E-08; T1DM = 1.02 ± 0.4%, p = 3E-05; PDOB = 1.61 ± 0.2%, p = 0.004; compared to NORM = 2.08 ± 0.2%). Albumin truncation reduction was more striking in T2DM (HSA-DA: T2DM vs. T1DM: p = 0.004). Improvements in glycemic control and decrease of albumin glycation during diabetes therapy were associated with concomitant increase of albumin truncations toward the “healthy” normal ranges, and vice versa (“mirror image” trends). Accordingly, albumin truncation correlated inversely with albumin glycation (HSA-DA vs. GA: R = −0.53, p = 1E-09).
Conclusions:
The “epiphenomenon” of albumin truncation (reflecting the severity of mean hyperglycemia and also insulin resistance) can possibly provide novel, sensitive, and complementary biomarkers (e.g., via simpler HSA-DA peptide fragment immunoassays) to monitor efficacy of diabetes therapy and also progression from “healthy” to prediabetes and type 2 diabetes, highlighting potential diagnostic and prognostic utility in clinical diabetes care.
Introduction
Albumin truncation in health and disease
Albumin, the most abundant protein in plasma, plays a crucial role in various physiological functions. Extensive research conducted over decades has shed light on the relationship between the structure of human serum albumin (HSA) and its diverse biological functions. 1 –3 Throughout its circulation in human serum, HSA undergoes various chemical modifications, known as post-translational modifications (PTMs), including glycation, oxidation, and truncation. These modifications occur as a result of interactions with numerous reactive small molecules, which are either formed or increased under abnormal pathological conditions. 4 With regard to truncation, albumin in the circulation is subject to the action of proteases yielding truncated isoforms. 5 Both N-terminal and C-terminal albumin truncations have been documented. Three main albumin truncation isoforms have been identified in healthy individuals and also those with certain disease states, in previous studies. They are: (1) truncation of the last two N-terminal amino acid residues [Asp (D)-Ala (A) (HSA-DA)]; (2) truncation of the last C-terminal amino acid residue [Leu (L) (HSA-L)]; and (3) cysteinylation cum N-terminal truncation (CysHSA-DA). Mass spectrometry (MS) permits accurate identification and quantitation of the distinct albumin truncation isoforms and their structures.
From clinical standpoint, in patients with cirrhosis of liver, CysHSA-DA levels were increased. 5 No changes in other truncated isoforms (HSA-DA and HSA-L) were observed between healthy and cirrhosis patients. In patients with pancreatitis, levels of C terminal truncated isoform HSA-L were increased. This is most likely result of exposure of HSA to pancreas protease activity-carboxypeptidase A, which is found at elevated levels in plasma of individuals with pancreatitis. 6,7 The truncated form of HSA, lacking L585, exhibits a short half-life in humans, approximately 3.5 days.
Our recent “cross-sectional” study on various albumin molecular modifications in diabetes provided few important clinical and biological insights. 4 Toward further examining some of these propositions, in the present study of albumin truncation in diabetes, we evaluated albumin truncation longitudinal trends and correlations during contemporary diabetes therapy, over follow-up period up to 280 days (total 113 evaluations), in cohort of subjects with normal renal function and tried to elucidate their potential clinical implications.
Materials and Methods
Study design: “Real world” and pragmatic
This prospective longitudinal “real-world” interventional study was approved by institutional ethics committee and conducted following due informed consent/assent processes at Samatvam Diabetes Endocrinology Center (a specialty referral center), Bangalore, India.
Inclusion criteria
The key inclusion criteria included: (a) subjects of either sex; (b) age between 15 years and above; (c) “normal” renal function, defined as an estimated glomerular filtration rate (eGFR) greater than 60 mL/min/1.73 m2; (d) nonhypertensives or controlled hypertension; and (e) submission of written informed consent. The four subject groups studied were: Group A: Type 1 Diabetes (T1DM); Group B: Type 2 Diabetes (T2DM); Group C: Prediabetes Obesity (PDOB); and Group D: Healthy Controls (NORM). In this “real-world” exploratory study, subjects newly referred from diverse peripheral community primary care settings were enrolled consecutively (irrespective of their baseline glycemic control-HbA1c levels).
Exclusion criteria
The key exclusion criteria included: (a) history of one or more severe hypoglycemic episode within 6 months before screening; (b) history of diabetic ketoacidosis, or diabetes secondary to pancreatitis or pancreatectomy; (c) history of unstable/untreated proliferative diabetic retinopathy for which treatment is planned during the course of the study; (d) hemoglobin percentage <10 g/dL females and <11 g/dL males; (e) diagnosis of symptomatic coronary artery disease or any other clinically significant cardiovascular disease; major cardiovascular event in the previous 6 months (acute coronary syndrome-unstable angina, acute myocardial infarction, percutaneous transluminal angioplasty, coronary artery bypass grafting, hospitalization for heart failure, transient ischemic attack, stroke, peripheral vascular disease with gangrene, or critical limb ischemia); (f) concurrent hepatic dysfunction (defined as AST and/or ALT >3 times of the upper normal limit); (g) Ongoing, inadequately controlled thyroid disorder (e.g., subject with thyroid stimulating hormone [TSH] value that is either <0.2 or >10 m IU/L); (h) uncontrolled acute bronchial asthma, chronic obstructive pulmonary disease, pulmonary dysfunction requiring inhalation or systemic steroids; (i) pregnant/lactating women; (j) systemic or oral steroids, oral contraceptive pills or estrogen replacement therapy; (k) current diagnosis of malignancy or in past 5 years; (l) major systemic illness necessitating long term drug treatment (defined as more than 3 months); (m) major psychiatric illness, in which the patient cannot give valid consent; (n) physician deems the subject not suitable for participation in the study for other reasons.
Evaluations—clinical
Clinical evaluations included detailed medical history, physical examination, diabetes clinic guideline directed investigations, and evaluation for complications (chest x-ray, ultrasound abdomen and pelvis, fundus examination and photography, cardiac and other system evaluations- as per need), and medication review, at baseline and specific study visits. All subjects received medical care based on contemporary guidelines-driven standards. During follow-up visits, glycemic control, need for rescue therapy, and adverse events (if any) were reviewed.
Evaluations—albumin molecular modifications (mass spectrometry)
MS permitted accurate quantitation of: (a) glycated albumin (GA) total and its isoforms; (b) cysteinylated (Cys34) albumin (CA = HNA1) total and its isoforms; (c) di/tri-oxidized (Cys34) albumin (OA = HNA2) total and its isoforms; and (d) Truncated albumin (TA) isoforms (HSA-DA, HSA-L, CysHSA-DA). Magnitude of native HSA (HSA-SH unmodified: nonglycated, nonoxidized, and nontruncated) was also quantitated. In this study, healthy control subjects exhibited HSA-DA of 2.1 ± 0.2%, HSA-L of 2.5 ± 1.1%, and CysHSA-DA of 1.3 ± 0.2 (Mean ± SD).
Evaluations—biochemical metabolic
Biochemical evaluations included fasting blood glucose; renal function tests (serum creatinine; eGFR; urine albumin: creatinine ratio; serum cystatin c); serum uric acid; serum lipid profile, liver function tests (total protein, serum albumin, serum globulin); serum amylase and lipase; thyroid function tests (T3, T4, TSH); serum apo lipoproteins, lipoprotein (a), homocysteine; hemogram; urine routine; biomarkers of protein glycation (HbA1c; fructosamine, or glycated serum protein; GA), and biomarkers of inflammation (hs-CRP, serum iron, transferrin). Serum archiving was done at –80°C (Biobank) for both MS studies and future exploratory studies.
Comprehensive therapy and medication adjustments
The subjects underwent rigorous contemporary diabetes care protocols, which encompassed: (a) in-depth lifestyle counseling focusing on medical nutrition therapy and physical activity; (b) meticulous management of insulin regimens and titrations; (c) precise adjustments of oral diabetes medications; (d) administration of medications targeting hypertension, dyslipidemia, and cardiovascular prophylaxis; and (e) regular primary medical care to address any concurrent illnesses. In our study, none of the subjects received GLP-1 agonists. Among T2DM subjects, six were already on gliptin at baseline and the remaining three were initiated on gliptin during follow-up visits. 4
Analytical procedures
Glycated hemoglobin (HbA1c)
HbA1c levels were determined using a fully automated ion-exchange high-performance liquid chromatography (HPLC) system [Bio-Rad Variant II Turbo, certified by National Glycohemoglobin Standardization Program (NGSP)]. Results and chromatograms were captured and stored using Bio-Rad’s clinical data management (CDM) software. The intra-assay coefficient of variation ranged from 0.00% to 0.77%, while the inter-assay coefficient of variation ranged from 0.88% to 1.31%. 8
Glycated serum proteins (GSPs)
GSP, comprising GA and glycated globulin, was quantified using nitro blue tetrazolium (NBT) colorimetry. This method relies on the ability of GSP to reduce NBT, resulting in the formation of a purple-colored end-product under alkaline conditions. The rate of formazan formation is directly proportional to the concentration of GSP in the samples and the increase in absorbance (OD 530 nm) can be monitored using a spectrophotometer. A volume of 12.5 μL of human serum was mixed with 250 μL of carbonate buffer (0.2 mol/L, pH = 10.3) containing 0.25 mmol/L of NBT at 37°C. Absorbance was measured at 530 nm after 10 and 15 min of mixing and compared with identically treated standards of human serum samples. Absorbance was measured using the BioSystems BA400 robotic autoanalyzer from Spain. The intra-assay coefficient of variation ranged from 2.5% to 2.7%, while the interassay coefficient of variation ranged from 4.0% to 4.3%. 9,10
Albumin chemical modifications (mass spectrometry)
GA was quantified using liquid chromatography-electrospray ionization mass spectrometry (LC-ESI-MS). 11 Serum samples were centrifuged to obtain serum, from which 4 μL of diluted serum sample (1.5 μM) was injected into online LC connected to a Bruker ESI-Q-TOF mass spectrometer. Calibration was performed using a commercially available Agilent calibrator mix 0.1% trifluoroacetic acid (TFA) solution. Mass spectra were processed using data analysis software (version 4.4) provided by Bruker Daltonics (Germany). Baseline correction (0.8 Da) and smoothing using the Savitzky–Golay algorithm with a smoothing width (m/z) of 0.19 Da were conducted. Deconvolution (in the 60,000 to 85,000 Da range) was performed to determine the mass of neutral species of albumin and its modified isoforms. Manual verification of protein masses was conducted for major peaks. Each addition of 162 Da (representing glucose 180 Da minus 18 Da for water) to the albumin peak was attributed to glycation. Relative quantification of modified isoforms was calculated based on the mass intensity values of the protein peaks (see Fig. 1). 4
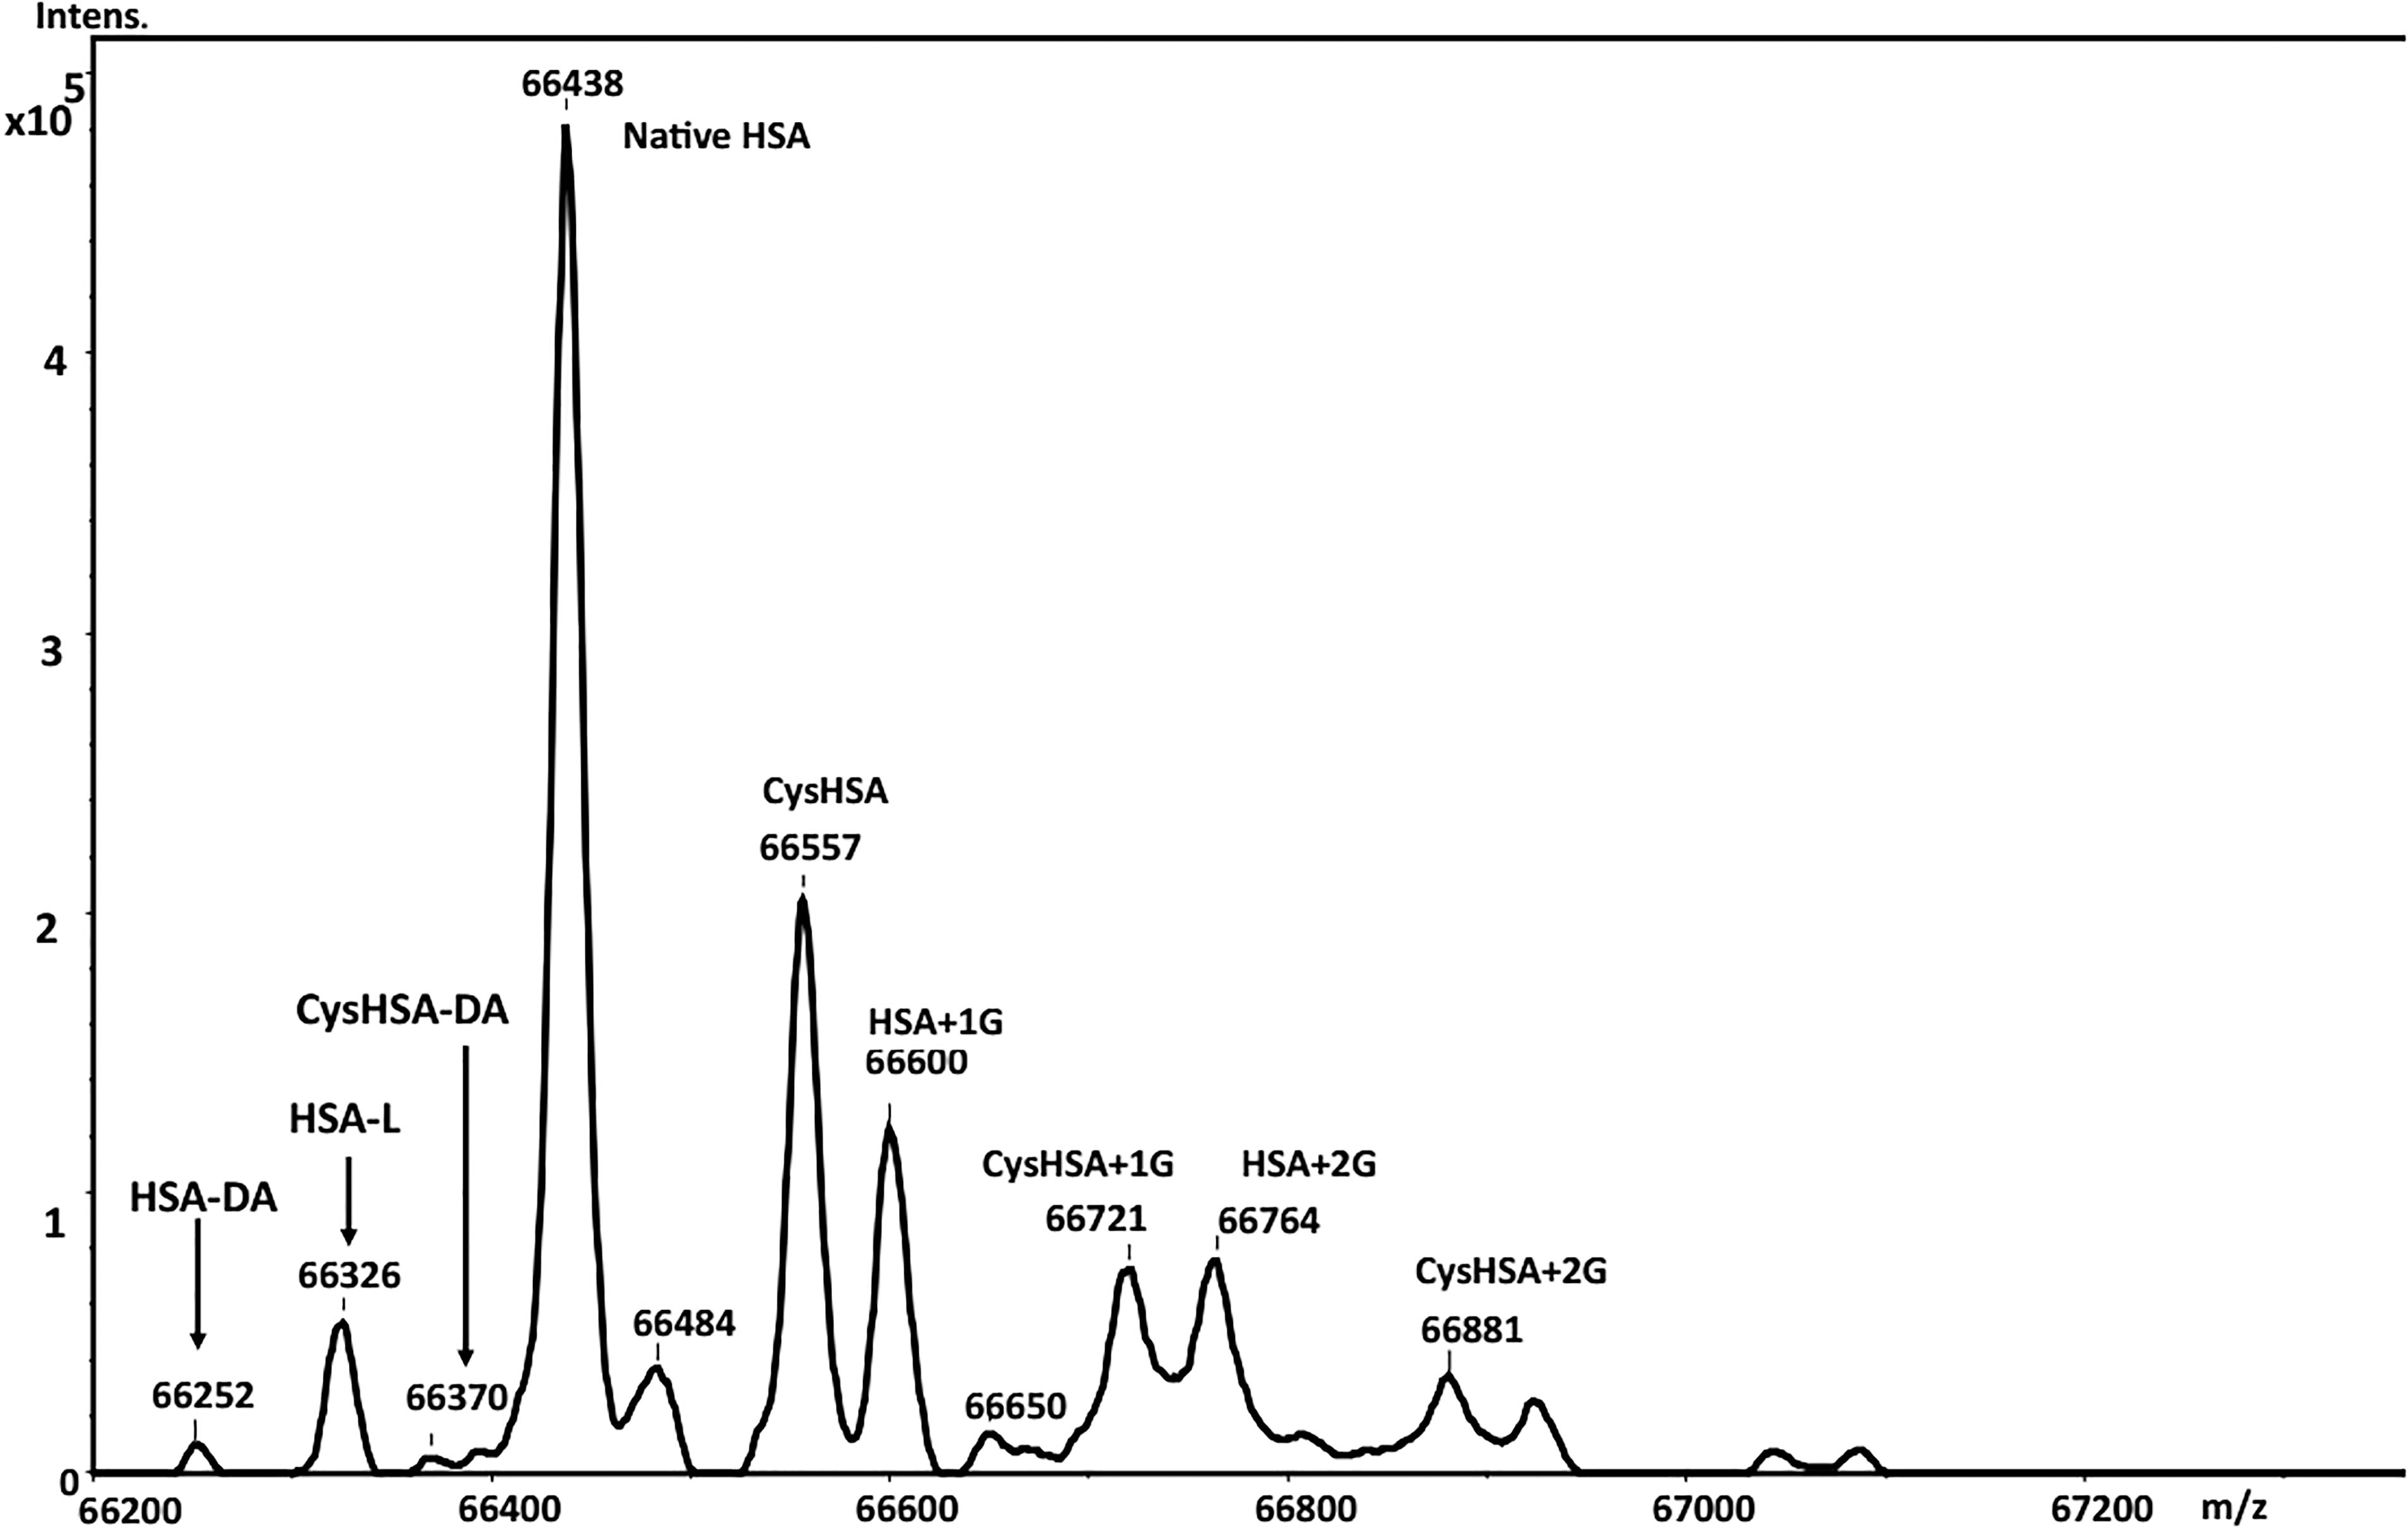
Quantitation of Truncated albumin (TA) isoforms (HSA-DA, HSA-L, CysHSA-DA). Mass spectrum of human serum albumin (HSA) from a representative healthy control (NORM) subject. Mass spectrometry permitted accurate quantitation of: (a) glycated albumin (GA) total and its isoforms, namely mono-(1G), di-(2G), and tri-(3G) glycation (HSA + 1G, HSA + 2G, HSA + 3G); (b) cysteinylated (Cys34) albumin (CA = HNA1) total and its isoforms (CysHSA, CysHSA + 1G, CysHSA + 2G, CysHSA + 3G); (c) di/trioxidised (Cys34) albumin (OA = HNA2) total and its isoforms (HSASO2H Sulfinic acid, HSASO3H Sulfonic acid); and (d) Truncated albumin (TA) isoforms (HSA-DA, HSA-L, CysHSA-DA).
Statistical analysis
Statistical analysis utilized two methods. First, all data were presented as mean ± SD, with the significance of differences between study groups assessed via one-way ANOVA using OpenEpi open-source software and GraphPad Prism. Second, regression analysis was conducted for both the entire cohort and subgroups using Microsoft Excel (2019).
Results
Clinical features (baseline) and therapy
We assessed a total of 31 subjects over a period of up to 280 days, comprising a total of 113 evaluations. Group A: Type 1 Diabetes (T1DM) [n = 9, with 26 evaluations; Baseline BMI = 20.0 ± 4.3 kg/m2; HbA1c = 12.7 ± 3.6%, 95% CI].
Group B: Type 2 Diabetes (T2DM) [n = 9, with 45 evaluations; Baseline BMI = 21.6 ± 4.2 kg/m2; HbA1c = 15.3 ± 2.5%, 95% CI].
Group C: Prediabetes Obesity (PDOB) [n = 6, with 35 evaluations; BMI = ≥30 kg/m2; Baseline BMI = 36.8 ± 4.2 kg/m2; HbA1c = 5.9 ± 0.5%, 95% CI; mean plasma glucose = 123 mg/dL].
Group D: Healthy Controls (NORM) [n = 7; Normal glucose tolerance (NGT), no obesity and normal blood pressure; Baseline BMI = 21.5 ± 4.5 kg/m2; HbA1c = 5.3 ± 0.2%, 95% CI; mean plasma glucose = 105 mg/dL].
Further information on baseline clinical characteristics, biomarker analyses, and associated comorbidities of the groups and details of longitudinal therapy for all the subjects have been described. 12 (Also, refer to Supplementary Data S1 of this article).
Diabetes (T2DM > T1DM) is associated with reduction (“deficiency”) of measured albumin truncation compared with healthy controls
Baseline markers of mean glycemia (HbA1c, GA, and GSP) and albumin truncation (HSA-DA, CysHSA-DA, and HSA-L) for each study group have been documented (Table 1). 4,12 All three key glycemic control biomarkers, HbA1c, GA, and GSP, showed significant elevation in both T1DM and T2DM groups compared to PDOB and NORM. The corresponding magnitudes of HSA-DA, CysHSA-DA, and HSA-L yielded novel information.
Baseline Markers of Mean Glycemia (HbA1c, GA, and GSP) and Albumin Truncation (HSA-DA, CysHSA-DA, and HSA-L) for Each Study Group. (Mean ± SD; Baseline n = 31)
GA, glycated albumin; GSP, Glycated serum proteins; HAS, human serum albumin; T1DM, type 1 diabetes; T2DM, type 1 diabetes; PDOB, prediabetes-obesity; NORM, healthy controls.
Hsa-DA
In T1DM, the decrease in HSA-DA was significant, while in T2DM, it was even more pronounced compared to the NORM group (p: NORM vs. T1DM = 3E-5; NORM vs. T2DM = 2E-08; T1DM vs. T2DM = 0.002). PDOB also showed a milder yet significant reduction compared to NORM (p = 0.004).
Cys HSA-DA
In T1DM, CysHSA-DA showed a significant decrease, while in T2DM, the decrease was even more pronounced compared to the NORM group (p: NORM vs. T1DM = 8E-7; NORM vs. T2DM = 1E-10; T1DM vs. T2DM = 0.09).
Hsa-L
In T1DM, there was a decrease observed in HSA-L, while in T2DM, the decrease was significant (p = NORM vs. T1DM = 0.09; NORM vs. T2DM = 6E-5; T1DM vs. T2DM = 1E-3).
Thus, in the T2DM group, there is a dramatic decrease (“deficiency”) in the measured quantity of truncated albumin isoforms, while in the T1DM group, there is a notable reduction. Severe “deficiency” of HSA-DA (and CysHSA-DA and HSA-L) appears to be pathognomonic of diabetes (especially type 2) with uncontrolled hyperglycemia.
Improvements in glycemic control and decrease of albumin glycation during diabetes therapy were associated with concomitant increase of albumin truncations toward the “healthy” normal ranges and vice versa (“mirror image” trends)
Serial changes in hemoglobin, serum protein, and albumin glycation: group analysis
In group analysis, the magnitude of baseline hemoglobin, albumin, and serum protein glycation (HbA1c, GA, and GSP) of the T1DM and T2DM subjects who participated in the longitudinal therapy study, along with their follow-up data (“real world”) during therapy up to 280 days are illustrated in Table 2 and Figure 2a, b, and c. Comparing baseline with follow-up data, there were improvements in mean HbA1c, GA, and GSP during therapy in both T1DM and T2DM, with higher and significant improvements in T2DM (p: HbA1c = 2E-5; GA = 2E-6, and GSP = 1E-6).

Magnitude of hemoglobin, albumin, and serum protein glycation (HbA1c, GA, and GSP) and albumin truncation (HSA-DA, CysHSA-DA, and HSA-L) in T1DM and T2DM subjects who participated in the longitudinal therapy study at baseline and during longitudinal therapy follow-up. (Baseline= first darker colored bar; Follow-up = second lighter colored bar). CysHSA-DA Baseline *T1DM and *T2DM= 0% (Undetectable). GA, glycated albumin; GSP, Glycated serum proteins; HAS, human serum albumin; T1DM, type 1 diabetes; T2DM, type 1 diabetes.
Magnitude of Hemoglobin, Albumin, and Serum Protein Glycation (HbA1c, GA, and GSP) and Albumin Truncation (HSA-DA, CysHSA-DA, and HSA-L) in T1DM and T2DM Subjects Who Participated in the Longitudinal Therapy Study at Baseline and During Longitudinal Therapy Follow-up. Mean ± SD
B = Baseline Day 0; n = 8. FU = Follow-up on longitudinal therapy up to 280 days; n = 53 evaluations.
p values baseline versus follow-up—effect of therapy.
GA, glycated albumin; GSP, Glycated serum proteins; HAS, human serum albumin; T1DM, type 1 diabetes; T2DM, type 1 diabetes; PDOB, prediabetes-obesity; NORM, healthy controls.
Serial changes in albumin truncation: group analysis
In group analysis, the magnitude of baseline albumin truncation isoforms (HSA-DA, Cys-HSA-DA, and HSA-L) of the T1DM and T2DM subjects who participated in the longitudinal therapy study, along with their follow-up data (“real world”) during therapy up to 280 days are illustrated in Table 2 and Figure 2d, e, and f. Comparing baseline with follow-up data, even in the relatively smaller number of subjects studied, decreases in GA during diabetes therapy, were accompanied by increases in all three truncated albumin isoforms (HSA-DA, Cys-HSA-DA, and HSA-L) in both T1DM and T2DM– more marked increases in T2DM, than in T1DM (p: HSA-DA: T2DM = 1E-5; CysHSA-DA: T1DM = 0.02, T2DM = 2E-5; HSA-L: T2DM = 0.02). These observations from group analysis in T1DM and T2DM indicate that diabetes therapy and improvements in glycemic control (and decreases of albumin glycation) are associated with concomitant and proportionate increases in albumin truncation. This appears to reflect the “return” of albumin truncation isoforms toward the normal (healthy) ranges.
Serial changes in albumin glycation and truncation during therapy: Individual subject analysis
Temporal relationships between the trends of albumin glycation (GA%) and albumin truncation (HSA-DA%, CysHSA-DA%, and HSA-L %) during the course of diabetes therapy in representative T1DM and T2DM subjects are illustrated in Figure 3a–f.
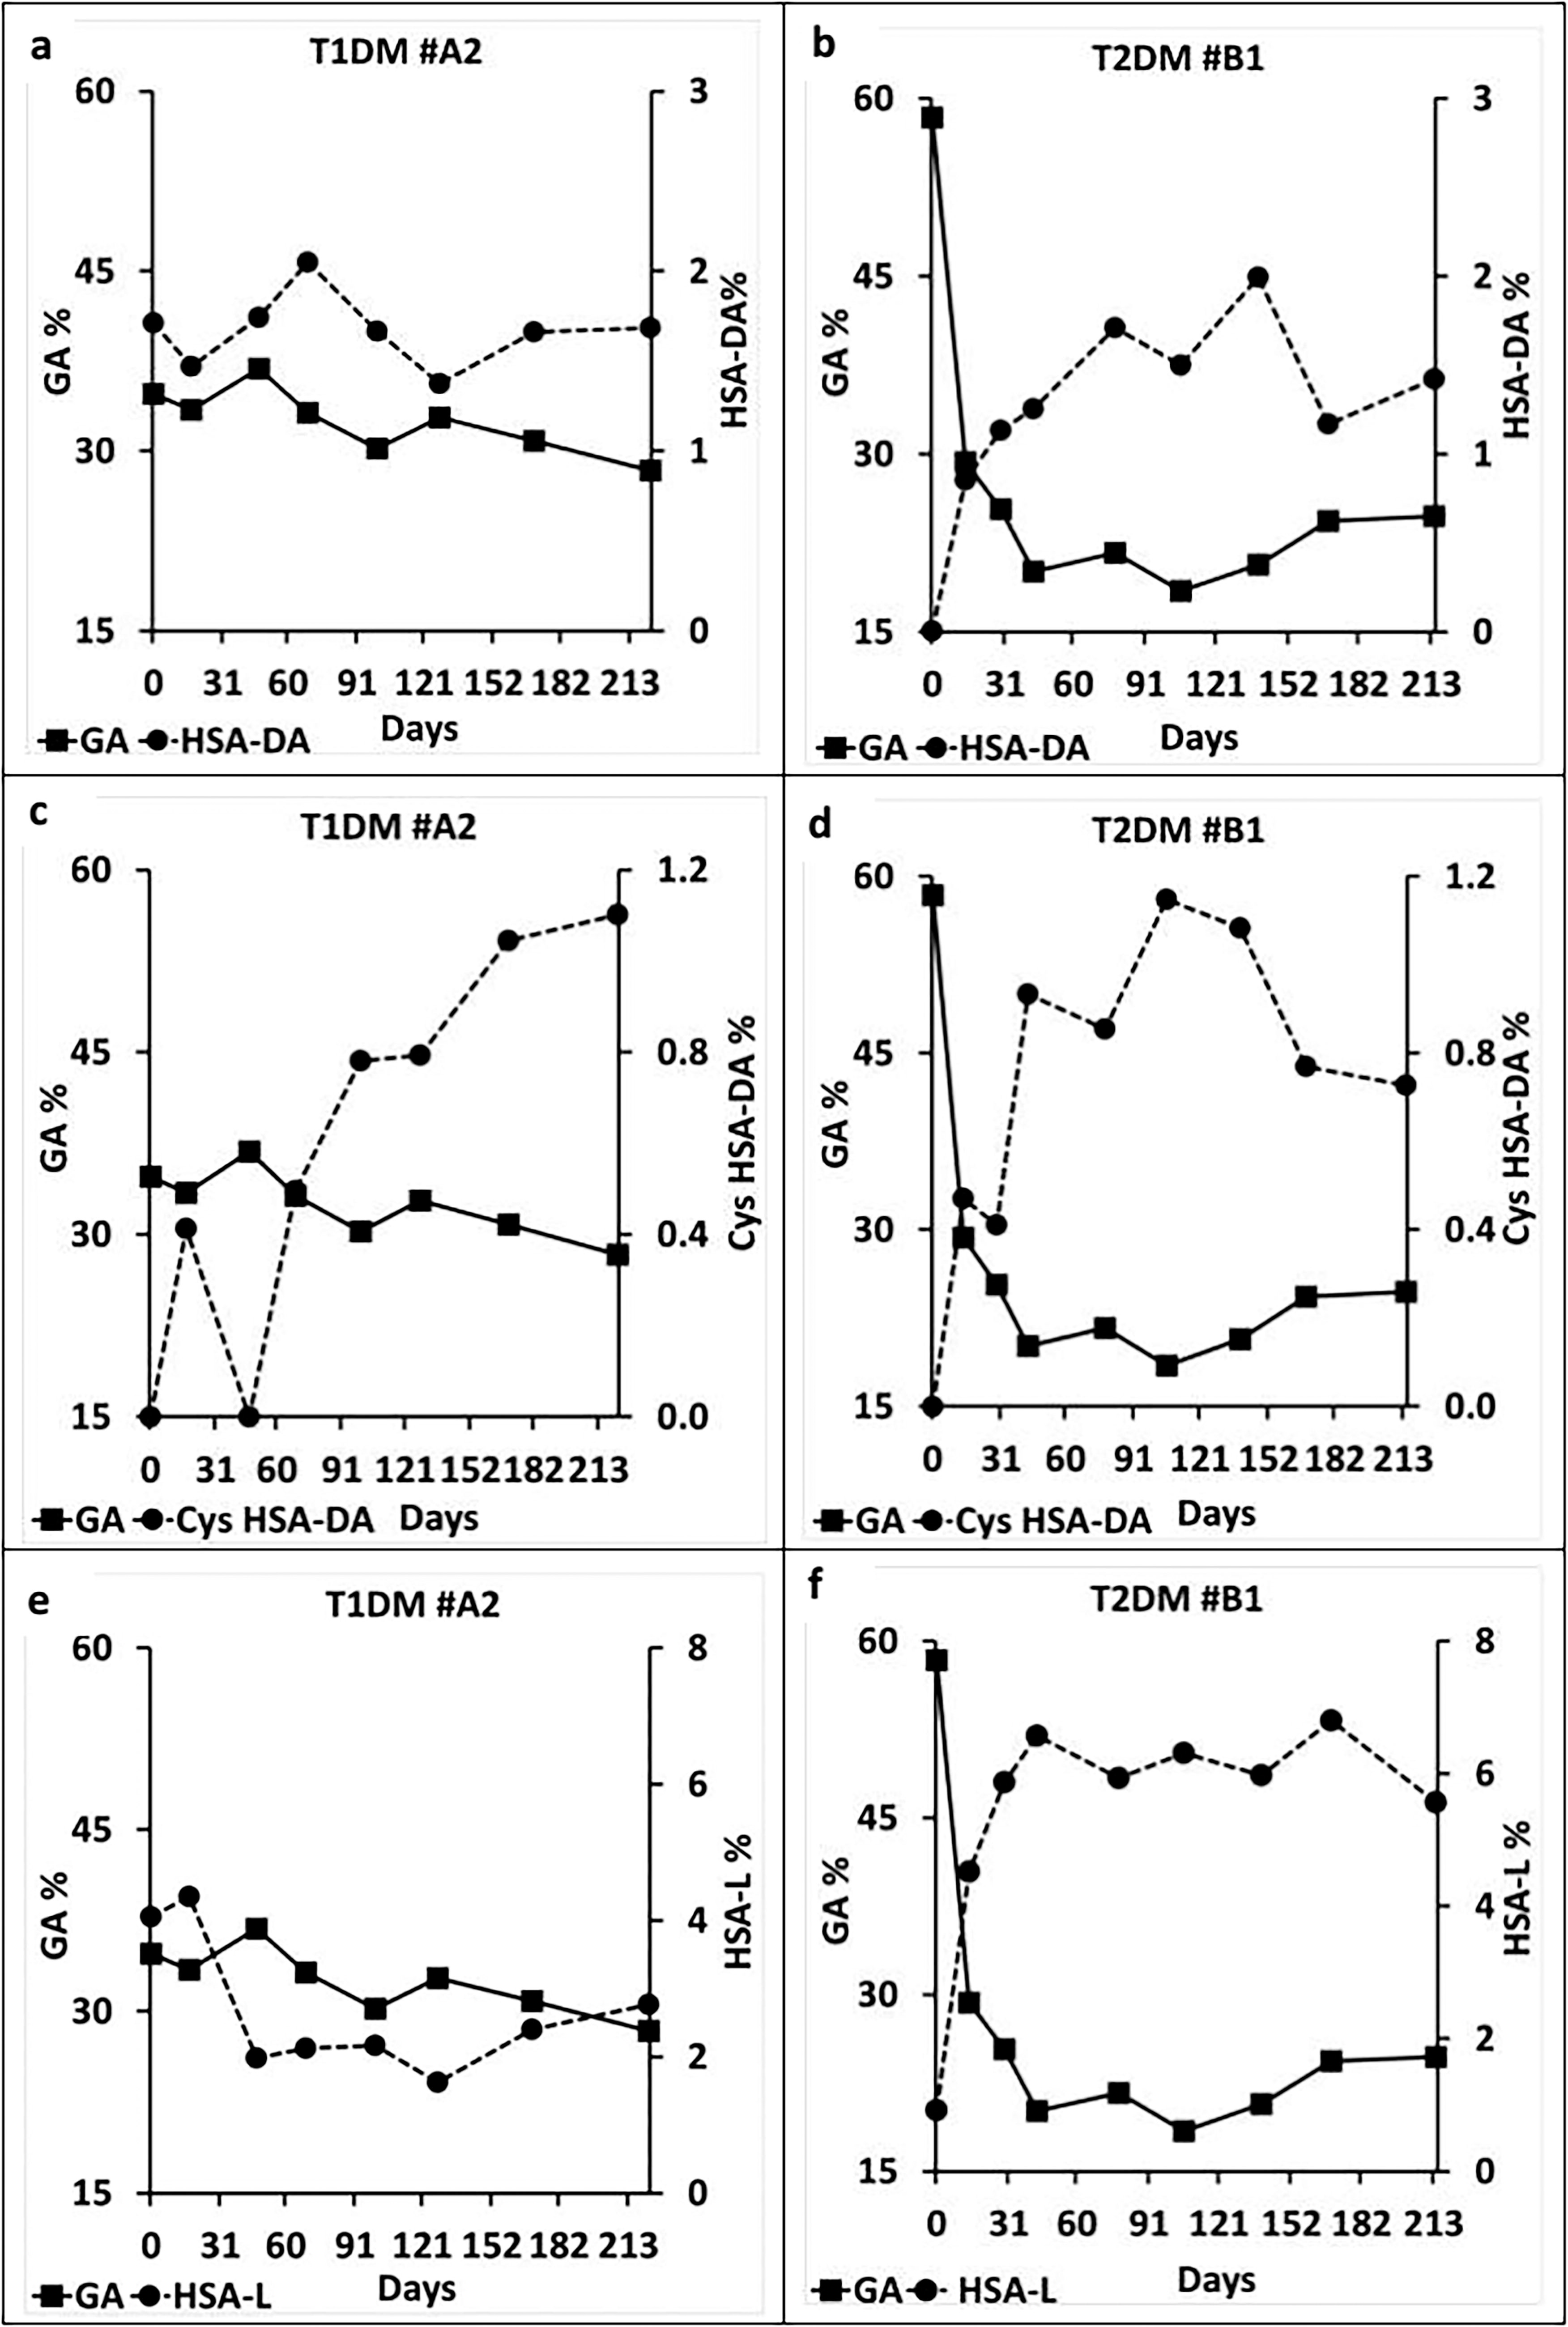
GA versus HSA-DA, CysHSA-DA, and HSA-L trends and trajectories of representative T1DM and T2DM subjects during longitudinal therapy study. (
The longitudinal trends and trajectories of GA (Total) and the various TA isoforms (HSA-DA, CysHSA-DA and HSA-L) represent good “mirror images” during the course of diabetes therapy in T1DM and T2DM (Fig. 3a–f). This inverse (“mirror image”) trend is more marked in T2DM (Fig. 3b, d, and f). Thus, with therapy associated improvements in mean glycemia and decreases in GA with diabetes therapy, there were prompt and consistent increases in all the TA isoforms. Conversely, during periods of worsening of mean glycemia and increases in GA during diabetes therapy, there were prompt and consistent decreases in all the TA isoforms.
However, a closer look at each of the “observation day” time points indicate few exceptions to this “mirror image” (inverse trend) rule, while comparing albumin glycation versus albumin truncation. In depth review of comprehensive albumin chemical modifications longitudinal trends for each subject, at each observation time point, has indicated that these rare exceptions (i.e., GA and TA trending in the same direction) are likely related to the corresponding relative magnitudes of albumin cysteinylation, at that particular time point. Our studies have suggested that: (a) besides albumin glycation, albumin cysteinylation also “inversely” influences the measured levels of albumin truncation, though at a relatively lesser magnitude (vide infra), and (b) albumin glycation can be discordant with albumin cysteinylation, in specific short- or long-term clinical situations (e.g., determined by the prevailing levels of insulin resistance and oxidative stress-intercurrent illnesses, drugs, lifestyle–body weight, physical activity, etc.). 12
Salient features of albumin truncation isoforms longitudinal trends, trajectories, and identifiable patterns during diabetes and prediabetes therapy for the entire cohort are summarized in Supplementary Figure S1 [Total GA%, HSA-DA%, CysHSA-DA%, and HSA-L%]. (Heat map analysis).
Albumin truncation correlated inversely with albumin glycation during diabetes therapy
There were strong and significant negative correlations between albumin truncation (HSA-DA, Cys-HSA-DA, and HSA-L) and albumin glycation (GA) for the entire cohort (All observations during the longitudinal therapy study: GA versus HSA-DA: R = −0.53, p = 1E-9; GA versus Cys-HSA-DA: R = −0.76, p = 3E-22; GA versus HSA-L: R = −0.53, p = 2E-9) (Table 3; Supplementary Figure S2), and in T1DM and T2DM groups.
Correlations Between Albumin Glycation and Albumin Truncation for Entire Cohort and 4 Study Groups
R: strengths of correlations. P: significance of correlations. All evaluations during every visit of the longitudinal therapy study Day 0 to Day 280; n = 113.
GA, glycated albumin; HAS, human serum albumin; T1DM, type 1 diabetes; T2DM, type 1 diabetes; PDOB, prediabetes-obesity; NORM, healthy controls.
Baseline (closed symbols) versus end of study (open symbols) albumin glycation and albumin truncation trends in individual T1DM and T2DM subjects (over up to 280 days follow-up) are shown in Figure 4. As expected, initiation or escalation of diabetes therapy led to improvement of glycemic control and decrease of GA. This was associated with concomitant increase in the magnitude of all the three albumin truncation isoforms (HSA-DA, CysHSA-DA, and HSA-L) toward their respective “healthy” normal ranges; (an isolated exception was observed with HSA-L).

Baseline (Day 0; n = 8; closed symbols) versus end of study (n = 8; open symbols; Rx = Therapy) albumin glycation and albumin truncation trends in individual T1DM (circles) and T2DM (squares) subjects (over up to 280 days follow-up). R: strengths of correlations. P: significance of correlations. [Normal reference ranges in healthy control (NORM) subjects: GA = 21.0 ± 2.9%; HSA-DA = 2.1 ± 0.2%, HSA-L = 2.5 ± 1.1%, and CysHSA-DA = 1.3 ± 0.2 (Mean ± SD)]. GA, glycated albumin; HAS, human serum albumin; T1DM, type 1 diabetes; T2DM, type 1 diabetes.
Albumin truncation versus albumin cysteinylation correlations
Also, there was significant negative (but relatively weaker) correlation between albumin truncation and albumin cysteinylation for HSA-DA for the entire cohort (All observations during the longitudinal therapy study: CA vs. HSA-DA: R = −0.32, p = 0.0006). (Table 3; Supplementary Table S1A and S1B; Supplementary Figure S2). In subgroup analysis (Table 3), the negative correlations between CA vs. HSA-DA and CA vs. HSA-L were strongest for PDOB (prediabetes obesity) (CA vs. HSA-DA: R = −0.45, p = 0.006; CA vs. HSA-L: R = −0.48, p = 0.004) and T2DM (CA vs. HSA-DA: R = −0.39, p = 0.007). This highlights the potential role of insulin resistance in inhibition of albumin truncation. (Mechanism: Our earlier data has indicated that insulin resistance increases oxidative stress and albumin oxidation/cysteinylation. 12 Increased albumin cysteinylation in turn appears to inhibit albumin truncation).
Discussion
Albumin truncation magnitude and trends in diabetes: Significance and potential clinical applications
To the best of our knowledge, ours is the first-ever study on using albumin truncation as a prognosis marker in diabetes therapy. Our observations indicated that diabetes (and prediabetes) was associated with significant reduction (“deficiency”) of measured albumin truncations. Albumin truncation reduction was more striking in T2DM compared to T1DM. Improvements in glycemic control and decrease of albumin glycation during diabetes therapy were associated with concomitant increase of albumin truncations toward the “healthy” normal ranges and vice versa (“mirror image” trends). Accordingly, albumin truncations correlated inversely with albumin glycation (and also to a lesser extent with albumin cysteinylation). Thus, the magnitude and trends of albumin truncation in diabetes likely reflect the severity of hyperglycemia (and also of insulin resistance). In T1DM, only one determining factor (namely hyperglycemia) is operative, whereas in T2DM both determining factors (namely hyperglycemia and insulin resistance) seem to influence the magnitude of albumin truncation; this is the likely explanation of the relatively more significant albumin truncation reduction in T2DM. The biological mechanisms and clinical implications of albumin truncation changes in diabetes and related disorders merits further in-depth evaluations.
HSA-DA as potential complementary biomarker during diabetogenesis and diabetes therapy
Our data suggest that measurements of HSA-DA (or its peptide fragment, by sensitive and specific immunoassays and point of care devices) could have potential diagnostic and prognostic value in clinical diabetes care. Serial monitoring of HSA-DA can have multiple clinical applications. HSA-DA “deficiency” can serve as very sensitive early biomarker during the evolution and progression of type 2 diabetes, even facilitating screening for and diagnosis of prediabetes. HSA-DA “deficiency” will increasingly worsen with increasing duration and severity of type 2 diabetes, and will get corrected toward the normal “healthy” range with improvement in glycemic control and better diabetes care. Increase in HSA-DA toward the “normal/healthy” range could reflect improvements in: (a) mean hyperglycemia and albumin (protein) glycation (T2DM and T1DM), and also (b) insulin resistance and albumin (protein) oxidation-cysteinylation (Prediabetes Obesity and T2DM). Thus, HSA-DA serving as a sensitive surrogate (indirect) diabetes care biomarker can complement traditional biomarkers like HbA1c, GSP, and GA, to facilitate monitoring of the efficacy of life style and pharmacologic interventions in prediabetes, type 2 diabetes, and type 1 diabetes. These propositions need to be investigated in larger number of subjects at various stages of type 2 diabetes spectrum, and more importantly through challenging long-term longitudinal cohort studies.
Albumin truncation variations in diabetes: Molecular mechanism(s)
Potential molecular mechanism(s) for albumin truncation variations [reduction (“deficiency”) and improvement] in diabetes has been provided in our earlier article. 4 Accordingly, the observed reduction of the MS measured levels of HSA-DA, CysHSA-DA, and HSA-L in T1DM and T2DM appears to be due to hyperglycemia and insulin resistance associated “dual” (glycation plus truncation) and “triple” (glycation, cysteinylation plus truncation) albumin molecular modifications. This results in shifting of these dual/triple modified truncated albumin isoforms toward higher molecular weight species in mass spectrum.
Conclusions
The “epiphenomenon” of albumin truncation (reflecting the severity of mean hyperglycemia and also insulin resistance) can possibly provide novel sensitive and complementary biomarkers (e.g., via simpler HSA-DA peptide fragment immunoassays) to monitor efficacy of diabetes therapy and also progression from “healthy” to prediabetes and type 2 diabetes, highlighting potential diagnostic and prognostic utility in clinical diabetes care.
Footnotes
Acknowledgments
Padma Bhushan Prof Padmanabhan Balaram (P.B.) (DST-YOS Chair Professorship at National Centre for Biological Sciences, Bengaluru, India) has been the primary mentor and guide for our research endeavors on albumin molecular modifications in diabetes and related disorders. He is our foundation and fountain of knowledge and inspiration. We gratefully acknowledge the help of the clinical staff at Samatvam: Science and Research for Human Welfare Trust, Bengaluru, India, and Ms. Sunitha Prakash at the mass spectrometry facility in the Biological Sciences Division, Indian Institute of Science, Bengaluru.
Authors’ Contributions
S.S., P.R.K., and N.B.: Designed the study and investigations. M.S.V. and S.S.: Carried out all the clinical protocols and investigations and generated clinical samples for analysis. N.K.: Performed mass spectrometry experiments. N.K. (with P.B.): Analyzed mass spectral data. M.S.V.: Compiled all the biochemistry, mass spectrometry, and clinical data, performed the statistical analysis, evaluated correlations, and identified clinical associations with S.S. and V.S. All authors (with P.B.) participated in data analysis and interpretation. All authors (with P.B.) contributed to the preparation and review of this article.
Author Disclosure Statement
No potential conflicts of interest relevant to this article were reported.
Funding Information
The authors thank the
Supplementary Material
Supplementary Data S1
Supplementary Figure S1
Supplementary Figure S2
Supplementary Table S1
References
Supplementary Material
Please find the following supplemental material available below.
For Open Access articles published under a Creative Commons License, all supplemental material carries the same license as the article it is associated with.
For non-Open Access articles published, all supplemental material carries a non-exclusive license, and permission requests for re-use of supplemental material or any part of supplemental material shall be sent directly to the copyright owner as specified in the copyright notice associated with the article.
