




Abstract
Background:
The role of the triglyceride-glucose (TyG) index in determining the effect of obesity on blood pressure (BP) in patients without diabetes remains unclear. We examined the association between body mass index (BMI), the TyG index, resting BP, and hypertension in Korean adults.
Methods:
We used the baseline data (4206 males and 4724 females aged 40–69 years) from the Korean Genome and Epidemiology Study conducted from 2001 to 2002. The primary outcomes were the TyG index, BMI, resting BP, and hypertension. The demographic characteristics, health behaviors, levels of fasting blood glucose, insulin resistance (IR) markers, lipoprotein lipids, and liver enzymes were included as covariates.
Results:
The TyG index was significantly associated with higher IR marker levels, poor lipoprotein-lipid profiles, elevated hepatic liver enzyme levels, elevated BP, and hypertension. Logistic regression analysis showed that individuals living with obesity had a higher risk of hypertension compared to individuals with underweight. Individuals in the second, third, and fourth quartiles of the TyG index had a higher risk of hypertension compared with those in the first quartile (odds ratio = 1). Mediation analysis showed that BMI has an indirect effect on diastolic and systolic BP through the TyG index.
Conclusion:
Our study findings indicate that the TyG index plays a pathological intermediary role between obesity and increased BP in individuals without diabetes, implying its clinical value in assessing the impact of obesity on hypertension risk.
Introduction
Hypertension, defined as high blood pressure (BP), is a serious health condition that increases the risk of cardiovascular disease (CVD), renal disorders, brain diseases, and other illnesses. 1 It is the leading cause of mortality, with many living patients from low- and middle-income countries. 2 Obesity has become a global pandemic in recent decades, and it is linked to an increased risk of type 2 diabetes (T2D) and CVD, including hypertension. 3 The pathological link between obesity and hypertension has been consistently reported in previous epidemic studies. 4,5
The triglyceride-glucose (TyG) index has emerged as a reliable proxy biomarker for insulin resistance (IR). 6 The TyG index outperformed the homeostasis assessment model for IR (HOMA-IR) and HOMA of beta-cell function in predicting metabolic syndrome. 7 The clinical importance of the TyG index in predicting the risk of T2D was observed in Asian populations. 8,9 In addition, IR is a biological mechanism that underpins elevated BP and hypertension in people without diabetes. 10
The TyG index, as a biomarker of IR, is significantly associated with hypertension, 11 suggesting that it may play a pathological intermediary role between the two health conditions. A recent meta-analysis of 21 cohort studies involving 20,403 individuals highlighted the association between the TyG index and CVD morbidity and mortality. 12 Therefore, a comprehensive investigation of the intricate and interrelated relationships among obesity, the TyG index, and hypertension is necessary. This study aimed to investigate the mediating effect of the TyG index on the relationship between obesity and resting BP in middle-aged and older Korean adults.
Materials and Methods
Study design and data source
This study involved a secondary analysis of the baseline survey data from the Korean Genome and Epidemiology Study (KoGES) conducted from 2001 to 2002. The participants aged 40–69 years (4758 males and 5272 females) were registered residents of the Ansan (urban) and Ansung (rural) areas in Gyeonggi Province, Republic of Korea. Recruitment was conducted via mail, phone, or home visits. For this analysis, as illustrated in Figure 1, data from 10,030 participants were initially obtained. Participants with diabetes (n = 675) or no available information about their health conditions (n = 4) were excluded. Those with missing data on demographic characteristics (n = 111), health behaviors (n = 116), blood chemistry results (n = 96), body fat measurements (n = 64), or other relevant variables were excluded (n = 34). Hence, only 8930 participants (4206 males and 4724 females) were included in the final analysis. T2D was defined as a fasting blood glucose (FBG) level of ≥126 mg/dL, a hemoglobin A1C (HbA1c) level of ≥6.5%, or the use of antidiabetic medication(s). Detailed information regarding the KoGES design and procedure is available elsewhere (http://www.kdca.go.kr/research/KoGES/data sharing). This study was approved by the Institutional Review Board of Sungkyunkwan University (approval no. SKKU 2023-07-038) and conducted under the Declaration of Helsinki. Informed consent was obtained from all participants.
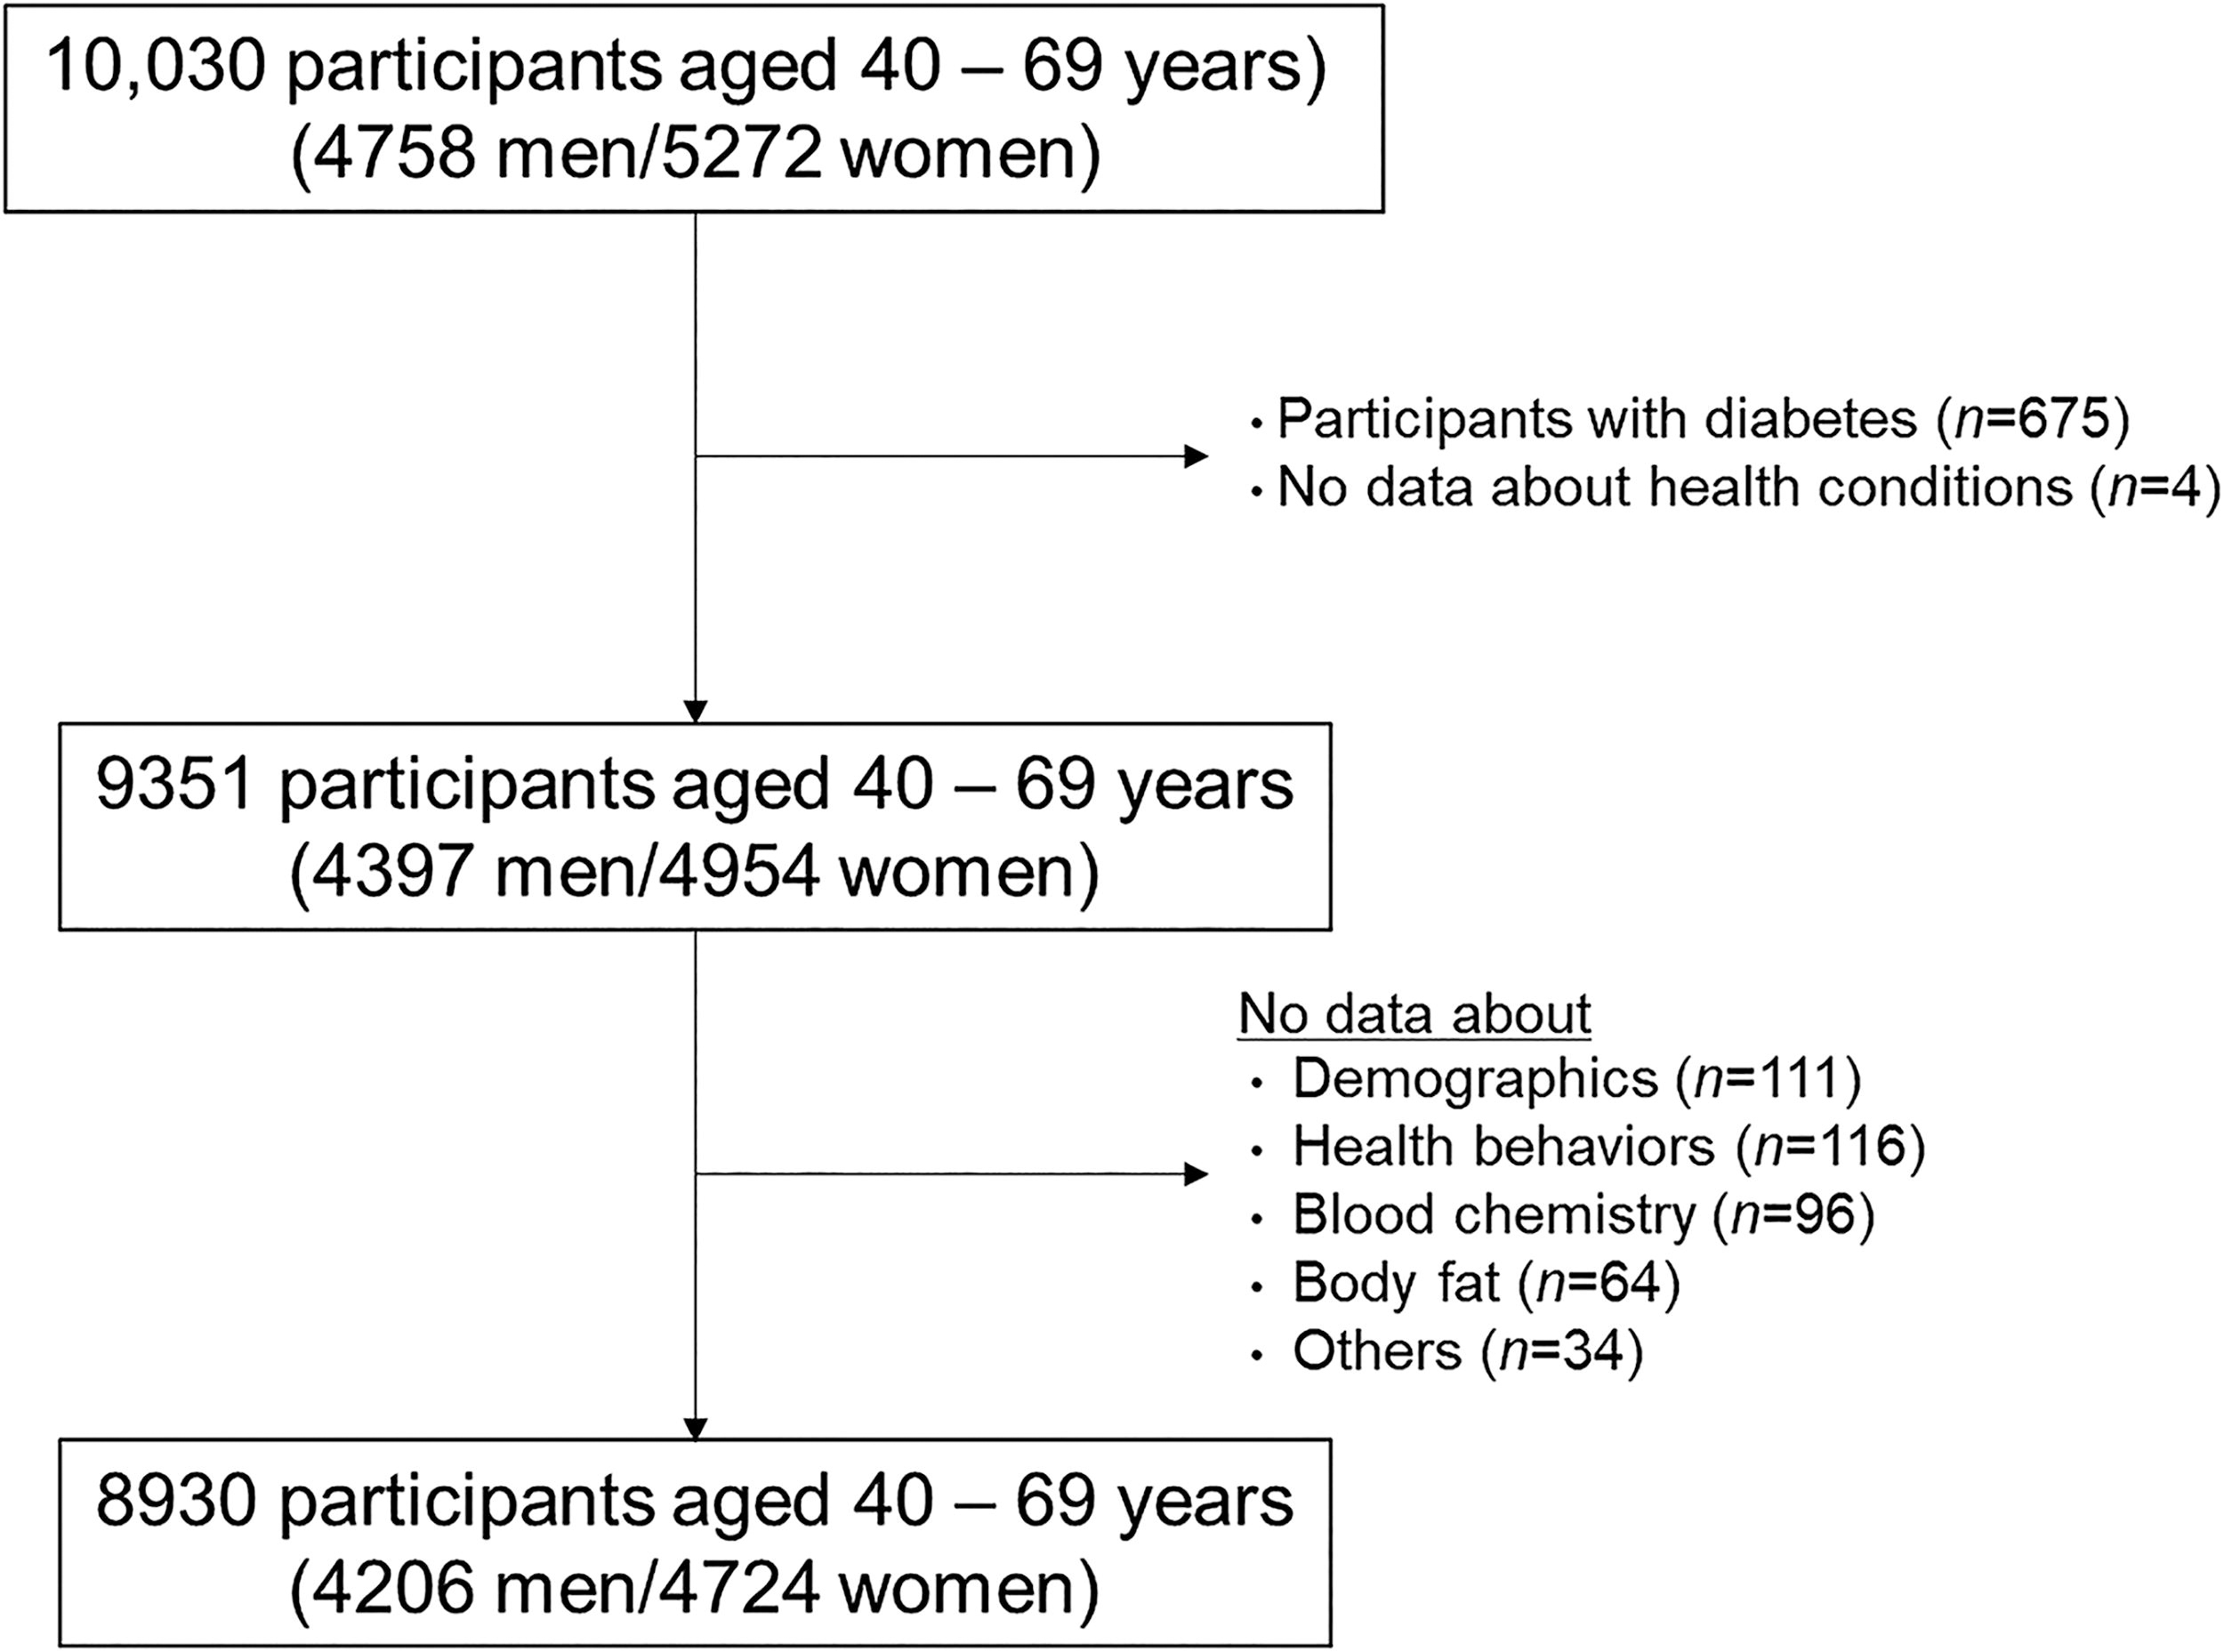
Selection procedure for study participants.
Measurement of blood pressure and definition of hypertension
Diastolic BP (DBP) and systolic BP (SBP) were measured three times in a sitting position after approximately 5 min of rest, with a 1-min interval between each measurement, using a mercury sphygmomanometer (CK-101; Chin Kou Medical Instrument Co. Ltd., Taipei, Taiwan). The final value was determined by calculating the average of the last two measured values. Hypertension was defined as an SBP of 140 mmHg or higher, a DBP of 90 mmHg or higher, a physician-diagnosed hypertension, or the use of antihypertensive medication(s).
Blood chemistry measurement
The levels of the following parameters were measured after 8 h of fasting using a Hitachi 7600–110 Chemistry Analyzer (Hitachi Co., Tokyo, Japan): FBG, insulin, total cholesterol (TC), high-density lipoprotein cholesterol, triglycerides (TGs), aspartate aminotransferase (AST), and alanine aminotransferase (ALT). The HOMA-IR was calculated as follows: HOMA-IR = (fasting insulin [μU/mL] × FBG [mg/dL]/405). The TyG index was calculated as follows: TyG index = ln (fasting TG [mg/dL] × FBG [mg/dL]/2).
Covariates
Data on smoking status, alcohol consumption, education, and marital status were obtained through interviews. Waist circumference (WC) (cm) was measured with a tape measure in the horizontal plane at the midpoint between the lowest rib and the iliac crest. Height and weight were measured to the nearest 0.001 m and 0.1 kg, respectively, using a wall-mounted extensometer and a scale, with participants wearing light clothes. Body mass index (BMI) (kg/m2) was calculated by dividing weight (kg) by height (m2). Percent body fat was assessed with a bioelectrical impedance analyzer (InBody 3.0, Biospace, Korea). Physical activity (PA) was assessed by using an international PA questionnaire.
Statistics
Quantile-quantile plots were used to confirm the normality of the data distribution. All variables were expressed as the means and standard deviations. Categorical variables were expressed as counts and percentages (%), and group comparisons were performed using the chi-square test. Student’s t-tests and one-way analysis of variance with contrasts were performed to assess the mean differences and linear trends in the measured parameters, respectively. Logistic regression analysis was used to estimate the odds ratios (ORs) of BMI and TyG index for hypertension. Statistical significance was evaluated using a P-value of 0.05 using SPSS-PC (version 27.0; IBM Corporation, Armonk, NY, USA). In addition, the Hayes’ process macro in SPSS-PC was used to evaluate the role of the TyG index on the association between BMI and resting BP. Bias-corrected bootstrapping (n = 10,000) and 95% confidence intervals were used to evaluate the statistical significance of the mediation model.
Results
The descriptive statistics of study participants are provided in Table 1. The prevalence of hypertension was approximately 13.9% in the study population and was higher in females than in males. Hypertensive individuals were older, had lower educational attainment, consumed less alcohol, smoked less, were more likely to live alone, and had higher BMI, WC, percent body fat, FBG, TC, and TG, and lower HDLC levels compared with normotensive individuals. As expected, the hypertensive individuals had higher FBG, insulin, HbA1c, HOMA-IR, TyG, ALT, AST, and C-reactive protein (CRP) levels compared with normotensive individuals.
Descriptive Statistics of Study Participants by Hypertension Status
Smoking status was divided into three categories: never smoking (never smoked more than 100 cigarettes in their lifetime and do not currently smoke), past smoking (smoked more than 100 cigarettes in their lifetime but did not smoke within the last 28 days), or current smoking (smoked more than 100 cigarettes in their lifetime and within the last 28 days). 13
Physical activity was assessed by using an international physical activity questionnaire and defined as the average amount of time (min per week) spent on moderate (3–5.9 METs) and/or vigorous-intensity (>6.0 METs) work and/or leisure-time activities. We then combined moderate physical activity (MPA) and vigorous PA (VPA) into moderate-to-vigorous (MVPA) by using the following formula: MPA (min per week) + (2 × VPA [min per week]). 14
BMI, body mass index; WC, waist circumference; BP: blood pressure; HDL, high-density lipoprotein; ALT, alanine transaminase; AST, aspartate transferase; HbA1c, hemoglobin A1C; CRP: C-reactive protein; TyG, triglycerides-glucose index; HOMA-IR: homeostasis model assessment of insulin resistance.
The mean differences of all measured variables across the TyG index distribution are summarized in Table 2. The levels of obesity-related parameters (i.e., BMI, WC, and percent body fat), resting BP (DBP and SBP), FBG, TC, TG, liver enzymes (ALT and AST), CRP, HbA1c, insulin, and HOMA-IR increased linearly, while the HDLC levels decreased linearly according to the TyG index (from low to high). In addition, the prevalence of hypertension increased linearly with higher TyG index values.
Comparison of Measured Risk Factors across Triglycerides-Glucose (TyG) Index Distribution
Physical activity was assessed by using an international physical activity questionnaire and defined as the average amount of time (min per week) spent on moderate (3–5.9 METs) and/or vigorous-intensity (>6.0 METs) work and/or leisure-time activities. We then combined moderate physical activity (MPA) and vigorous PA (VPA) into moderate-to-vigorous (MVPA) by using the following formula: MPA (min per week) + (2 × VPA [min per week]). 14
BMI, body mass index; WC, waist circumference; BP: blood pressure; HDL, high-density lipoprotein; ALT, alanine transaminase; AST, aspartate transferase; HbA1c, hemoglobin A1C; CRP: C-reactive protein; TyG, triglycerides-glucose index; HOMA-IR: homeostasis model assessment of insulin resistance.
The risk of hypertension according to BMI and TyG index values is outlined in Table 3. Overweight (OR = 3.051) and obese individuals (OR = 6.173) had a higher risk for hypertension compared with underweight individuals. The higher odds of hypertension in overweight and obese individuals remained significant (OR = 2.390 and OR = 3.526, respectively) even after controlling for all measured covariates. Similarly, individuals in the second, third, and fourth quartiles of the TyG index had a higher risk of hypertension (OR = 2.336, OR = 3.919, and OR = 6.200, respectively) compared with those in the first quartile (OR = 1). The higher odds of hypertension in the second, third, and fourth quartile groups remained significant (OR = 1.638, OR = 2.171, and OR = 2.600, respectively), even after controlling for all covariates.
Logistic Regression Analysis of Hypertension Risk by Body Mass Index (BMI) and Triglycerides-Glucose (TyG) Index
Underweight was defined as a BMI of <18.5 kg/m2, normal weight as a BMI of ≥18.5–22.9 kg/m2, overweight as a BMI of ≥23.0–24.9 kg/m2, and obesity as a BMI of ≥25.0 kg/m2 according to the Korean Society for the Study of Obesity. 15
Model 1: crude odds ratio (OR).
Model 2: OR after adjusting for demographics, including age, gender, marriage, education, drinking, and smoking.
Model 3: OR adjusting for model 2 plus moderate-to-vigorous physical activity and percent body fat.
Model 4: OR adjusting for model 3 plus BMI (for the TyG index distribution) or TyG index (for BMI categories).
As illustrated in Figure 2, a mediation analysis was conducted to determine the causal association among BMI, the TyG index, and resting BP. Results showed that BMI has an indirect effect on DBP (β = 0.1674, SE = 0.0142, 95% CI: = 0.1395–0.1950) and SBP (β = 0.2794, SE = 0.0224, 95% CI: = 0.2345–0.3238) through its association with the TyG index. In addition, BMI has a direct effect on DBP (β = 0.5718, SE = 0.0385, 95% CI: = 0.6762–0.8273) and SBP (β = 0.9438, SE = 0.0600, 95% CI: = 0.8261–1.0615) in the presence of the mediator.
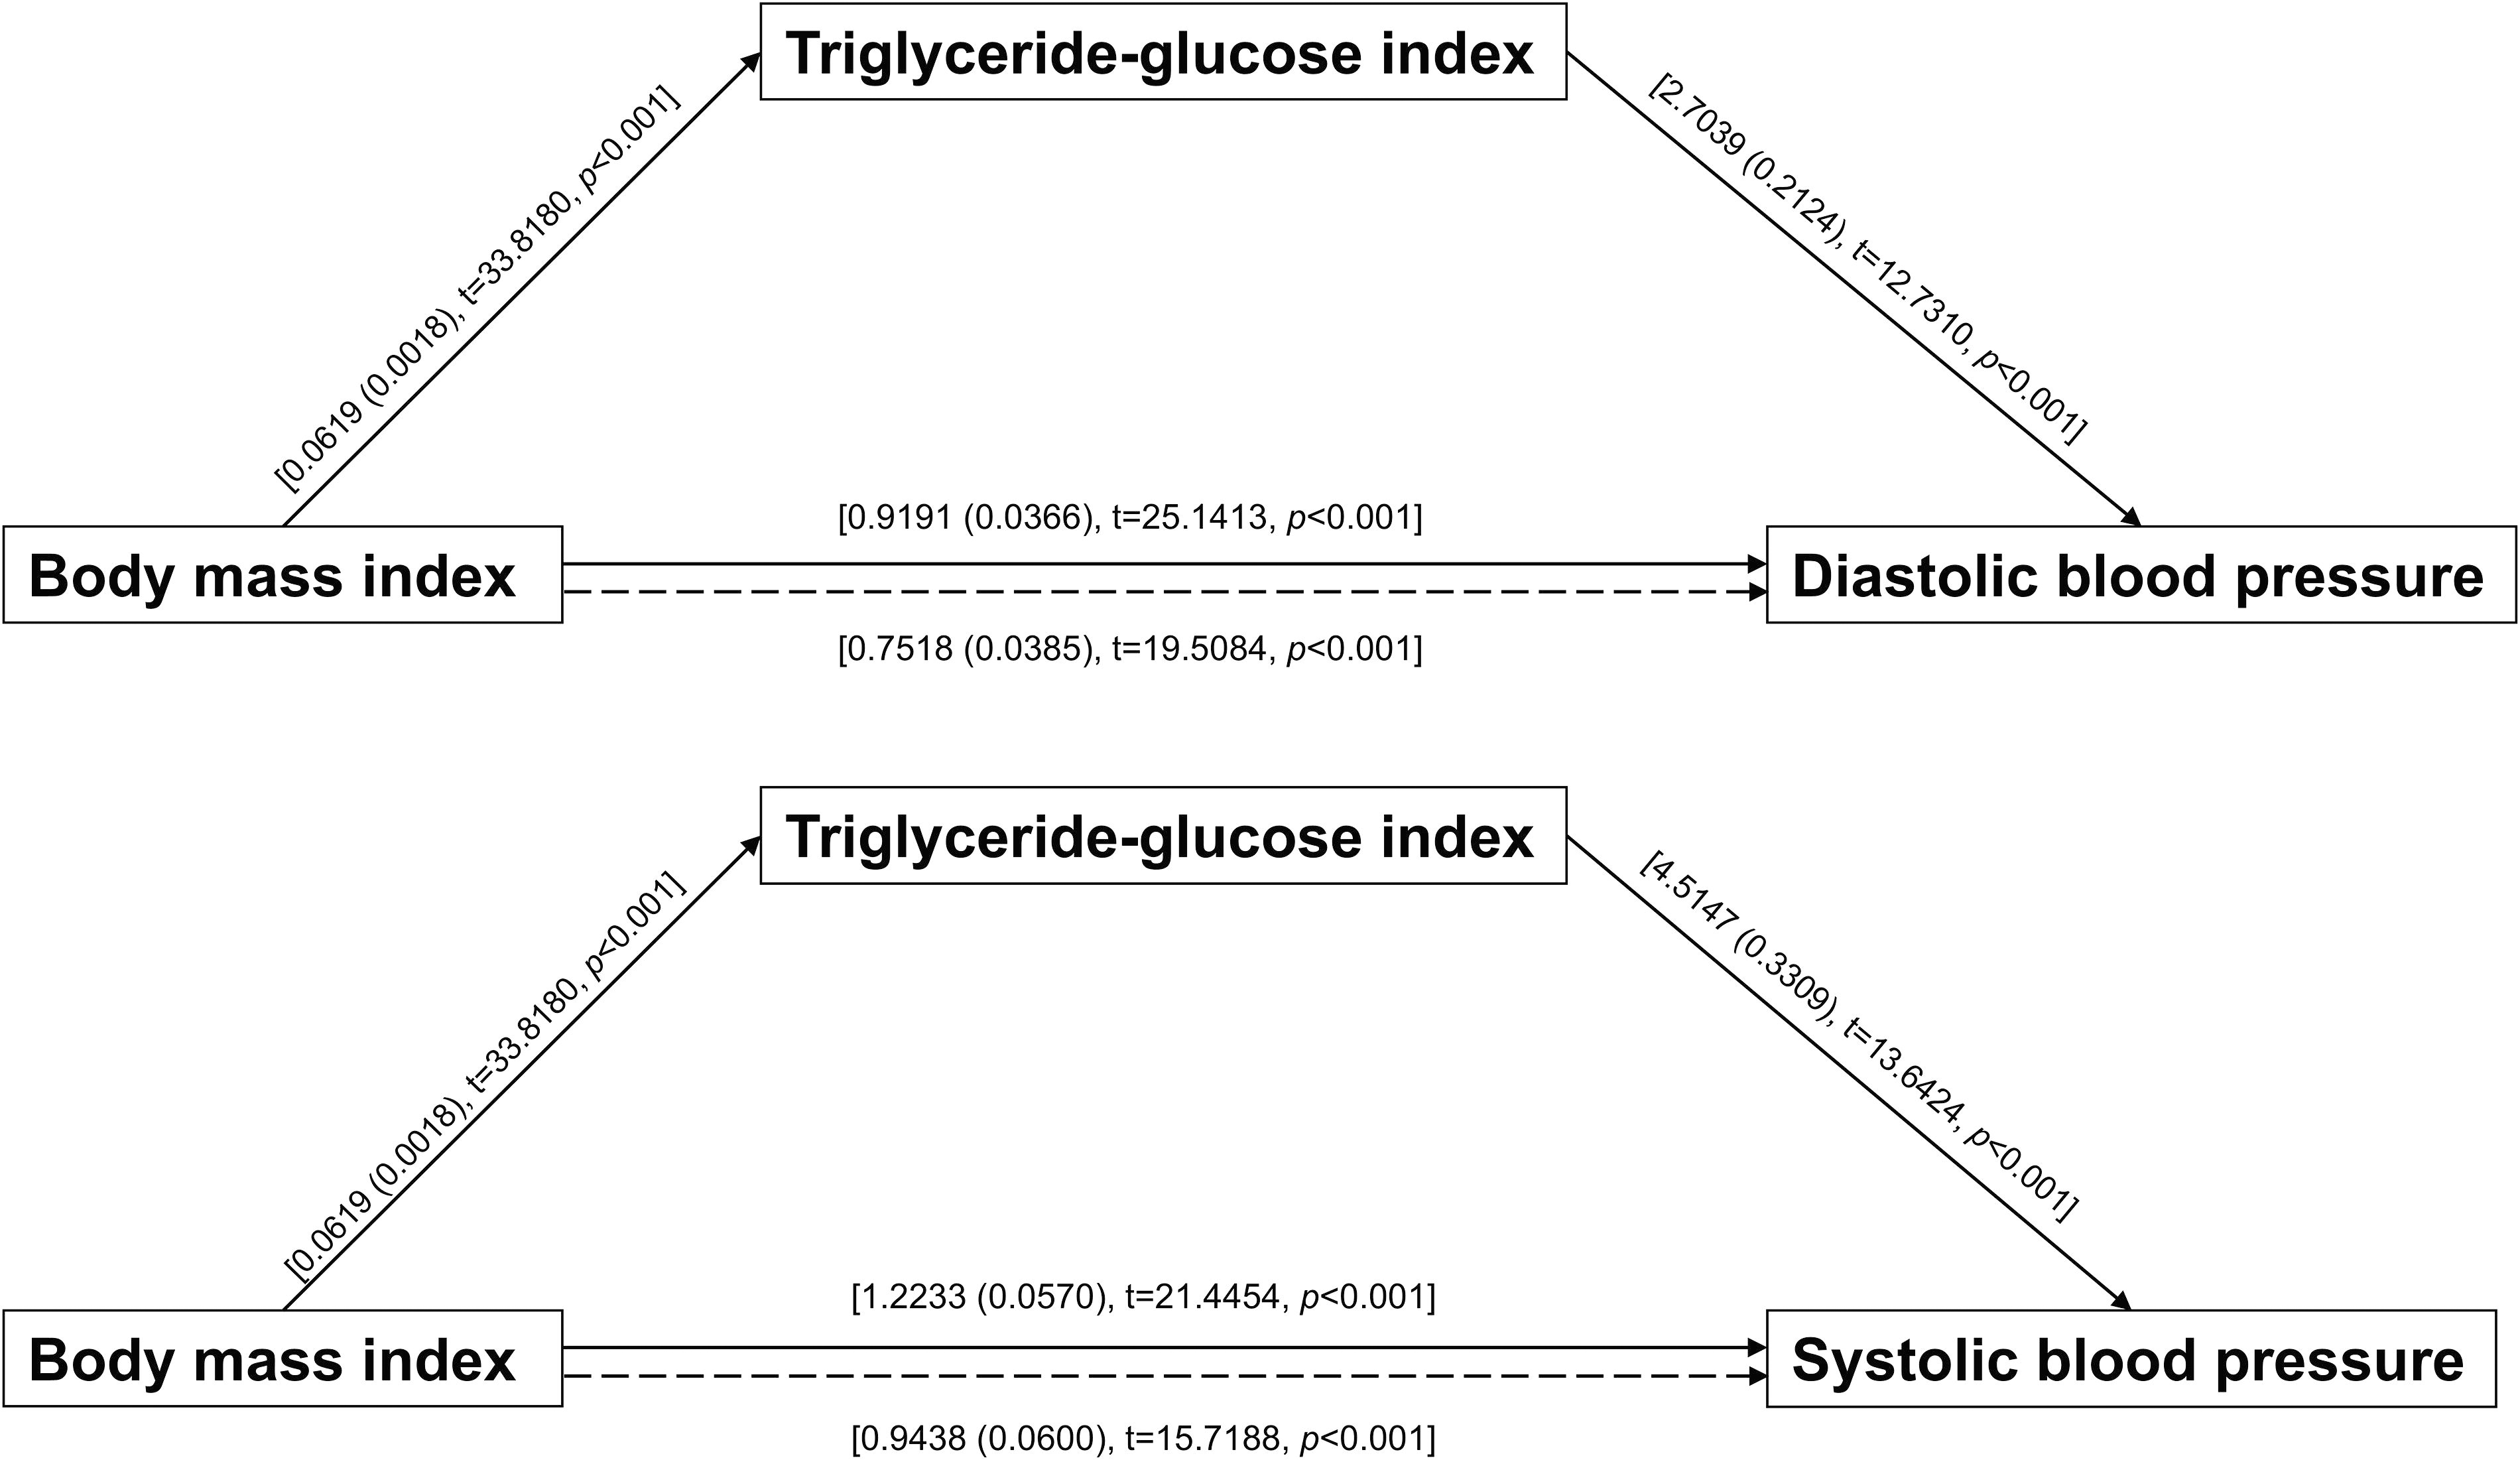
The association between body mass index and resting blood pressure: mediating effect of triglyceride-glucose index.
Discussion
This study examined the association between obesity, IR, resting BP, and metabolic risk factors in 8930 Korean adults who participated in the 2001–2002 KoGES. 16 The TyG index was significantly and positively associated with obesity indices, elevated blood glucose levels, higher resting BP, and unfavorable profiles of metabolic risk factors. The prevalence of hypertension showed a linear increase with rising BMI and TyG index levels. Mediation analysis revealed an indirect effect of BMI on resting BP through the TyG index, indicating its potential role as a pathological intermediary between obesity and hypertension.
The pathological link between obesity and IR has been documented in a cohort study of noninstitutionalized American adults aged ≥20 years 17 and a multicenter Brazilian cohort of civil servants aged 35–74 years. 15 A recent meta-analysis has extensively reviewed and summarized the association among BMI, IR, and metabolic risk factors. 18 Obesity is a well-established and modifiable risk factor for high BP or hypertension and accounts for many cases of primary hypertension. 19
The mechanisms by which obesity and IR are pathologically linked to hypertension involve interactions between the renal, metabolic, and neuroendocrine systems. They include the overactivation of the sympathetic nervous system, inflammation, the activation of the renin-angiotensin-aldosterone system, enhanced sodium reabsorption by the kidneys, hypervolemia, endothelial dysfunction, oxidative stress, dyslipidemia, and structural and functional renal changes. 19 –22 Furthermore, obesity and obstructive sleep apnea are frequently co-occurring, with sympathetic activity caused by intermittent hypoxia serving as another mechanism for blood pressure elevation. 23
The association between obesity, the TyG index, and hypertension observed in this study is consistent with the findings of previous studies. Obesity is recognized as an independent risk factor for hypertension in children, adolescents, 24 and adults. 25 In a 7-year follow-up study of 2618 normotensive Chinese adults aged 18–98 years, Cai et al. 26 showed that BMI changes were an independent predictor of hypertension onset. In a cross-sectional study involving 5098 overweight and obese Chinese patients who underwent hospital-based physical examinations, Li et al. 27 reported that impaired glucose tolerance, hepatic steatosis, and dyslipidemia significantly contributed to the risk of hypertension in an additive or synergistic manner.
In addition to obesity, the TyG index was significantly and positively correlated with the incidence of prehypertension or hypertension. This was demonstrated by a retrospective cohort study of 3413 non-hypertensive Chinese adults aged ≥ 19 years who participated in the China Health and Nutrition Survey between 2009 and 2015, 28 a 13-year prospective cohort study of 1113 non-hypertensive Mexican adults aged ≥ 20 years, 29 and a retrospective study of 15,450 normotensive Japanese individuals who participated in a hospital-based physical examination. 30 In a cross-sectional study of 10,937 individuals without diabetes who participated in the National Health and Nutrition Examination Survey between 2001 and 2020, Sawaf et al. 31 reported that a higher TyG index was associated with a higher risk of hypertension, coronary heart disease, and stroke. In a population-based study of 3413 Chinese adults aged 18 years who participated in the 2009–2015 China Health and Nutrition Survey, Wang et al. 32 demonstrated that obesity and the TyG index were positively and additively related to hypertension risk.
In this study involving non-diabetic Korean adults, we found an indirect effect of obesity on hypertension through the TyG index. In support of our findings, a prospective cohort study involving 4081 Chinese adults aged ≥35 years who were not taking antihypertensive, hypoglycemic, or lipid-lowering medications reported that the TyG index was significantly and positively related to hypertension incidents. 33 In that study, temporal relationship analysis revealed that BMI preceded the TyG index. The mediation analysis suggested that baseline BMI indirectly influences hypertension risk through its impact on the TyG index. Evidence suggests that the TyG index may have a pathological connection with chronic health conditions and hypertension. For example, a hospital-based study of 840 patients with obstructive sleep apnea syndrome (OSAS) showed that the TyG index mediated the effect of OSAS on hypertension risk. 34 Collectively, these findings suggest that obesity contributes to the pathology of hypertension, both directly and indirectly, by inducing IR.
This study has limitations. First, the cross-sectional study design limited our ability to draw causal conclusions regarding the current findings. Therefore, prospective cohort studies are necessary to confirm these relationships. Second, the KoGES data were obtained from residents of two urban (Ansan) and rural (Ansung) areas, which may have underrepresented the general Korean population, limiting the generalizability of our study findings.
Conclusion
In summary, this study examined the association between obesity, the TyG index, and resting BP in a sample of nondiabetic Korean adults. Results showed that BMI and the TyG index contributed to an increased risk of hypertension in this study population. Causal relationship analysis revealed that the TyG index mediated the impact of BMI on resting BP, highlighting the clinical importance of the index in determining obesity-related hypertension risk as a pathological intermediary between exposure and outcome.
Footnotes
Data Availability Statement
All data used in this study are available from the corresponding author (
Ethics of Approval Statement
This study was approved by the Institutional Review Board of Sungkyunkwan University (approval no. SKKU 2023-07-038) and conducted under the Declaration of Helsinki. Informed consent was obtained from all participants.
Authors’ Contributions
S.K.: Conceptualization, writing of the original draft, methodology, review and editing, and data curation. M.K. and J.K.: Writing of the original draft, review and editing, and data curation. H.K.: Writing of the original draft, methodology, data curation, formal analysis, and review and editing.
Author Disclosure Statement
The authors (S.K., M.K., J.K., and H.K.) declare that they have no competing financial interests or personal relationships that may have influenced the work reported in this study.
Funding Information
This work was supported by the Ministry of Education of the Republic of Korea and the National Research Foundation of Korea (NRF-2023S1A5B5A16075250) and the Basic Science Research Program through the National Research Foundation of Korea (NRF) funded by the Ministry of Education (RS-2024-00463501).