




Abstract
Background and Aims:
Visceral adipose tissue (VAT) is a key cardiometabolic risk factor. This study evaluates the association between VAT and adiposity indices and identifies reliable predictors of increased VAT.
Methods:
This cross-sectional study utilized data from 4696 participants in the National Health and Nutrition Examination Survey 2011–2018. VAT was measured via dual-energy X-ray absorptiometry. Adiposity indices included body mass index (BMI), waist circumference (WC), lipid accumulation product, visceral adiposity index, body shape index, body roundness index, and metabolic score for visceral fat (METS-VF). Correlation analysis, receiver operating characteristic curve analysis, and multivariate adaptive regression splines (MARS) modeling evaluated the performance of indices and identified key predictors of VAT.
Results:
All adiposity indices were significantly correlated with VAT (P < 0.001). Among them, METS-VF demonstrated the highest predictive performance for increased VAT (>130 cm2) followed by WC. Optimal cutoff values for METS-VF were 7.1 [areas under the curve (AUC): 0.887, 95% confidence interval (CI): 0.873–0.899] in men and 7.5 (AUC: 0.904, 95% CI: 0.891–0.916) in women. For WC, the cutoff values were 99.5 cm (AUC: 0.866, 95% CI: 0.851–0.879) in men and 96 cm (AUC: 0.883, 95% CI: 0.869–0.896) in women. MARS modeling identified race, age, WC, BMI, glucose, high-density lipoprotein cholesterol, and triglycerides as significant predictors of VAT, achieving an R 2 of 75.2%.
Conclusion:
METS-VF demonstrated the highest predictive value among the indices evaluated for predicting increased VAT. It may serve as a valuable tool in assessing visceral obesity and associated cardiometabolic risks.
Introduction
Obesity is one of the most significant risk factors for cardiometabolic diseases, yet traditional methods of assessing it have limitations. For decades, body mass index (BMI) has been widely used as a simple and practical tool to diagnose obesity. However, BMI does not differentiate between lean body mass and adipose tissue, which are critical for understanding obesity-related risks. 1
The importance of fat distribution in determining these risks was first highlighted by Vague, laying the groundwork for future research in this area. 2 Subsequently, the widespread use of imaging methods such as dual-energy X-ray absorptiometry (DEXA), computed tomography (CT), and magnetic resonance imaging (MRI) enabled researchers to quantitatively evaluate different compartments of abdominal fat. 3 These studies revealed a strong association between visceral adipose tissue (VAT) and cardiometabolic diseases, whereas subcutaneous fat was found to have a weaker correlation with cardiometabolic risk. 4,5 In a well-designed study involving 89 men with obesity, Ross et al. investigated whether subcutaneous fat added additional risk beyond visceral fat using MRI. 6 They found no significant association between abdominal subcutaneous fat, controlled for VAT, and insulin resistance-related parameters. Consequently, research has predominantly focused on predicting VAT.
Although waist circumference (WC) is practical and shows a stronger correlation with VAT than BMI, it cannot differentiate between subcutaneous and visceral fat in the abdominal region and is influenced by changes in subcutaneous fat. 7 To address this limitation, the concept of hypertriglyceridemic WC was developed. 8 This concept builds on the complex phenotype of visceral obesity, which includes adipose tissue storage dysfunction and ectopic triglyceride deposition in various areas, including the liver.
Since the early 2000s, numerous formulas have been developed to predict visceral obesity-related risk, either based on the hypertriglyceridemic waist concept or by considering a healthy body shape. These include the lipid accumulation product, which reflects lipid overaccumulation; the visceral adiposity index (VAI), a gender-specific indicator of visceral fat function; a body shape index (ABSI), which assesses body shape by incorporating WC, BMI, and height; the body roundness index (BRI), a measure of body fat distribution; and the metabolic score for visceral fat (METS-VF), a comprehensive score that evaluates visceral fat and its metabolic impact. 9 –13 However, studies examining the relationship of these formulas with VAT remain limited.
In this study, we aimed to analyze the relationship between DEXA-measured VAT and various adiposity indices using National Health and Nutrition Examination Survey (NHANES) data from 2011 to 2018 and compare the performance of these indices in predicting increased VAT.
Materials and Methods
Data collection
This study utilized data from the NHANES, conducted by the National Center for Health Statistics (NCHS). The NCHS Research Ethics Review Board approved the collection and public release of NHANES data, ensuring adherence to ethical standards and the protection of participant privacy (http://www.cdc.gov/nchs/nhanes/). 14
Study population
Data for this study were drawn from four NHANES cycles conducted between 2011 and 2018. Participants met the following inclusion criteria: (1) age ≥20 years, (2) availability of complete data for calculating adiposity indices, and (3) availability of VAT data. The flowchart depicting the inclusion and exclusion process for the study group is presented in Figure 1.
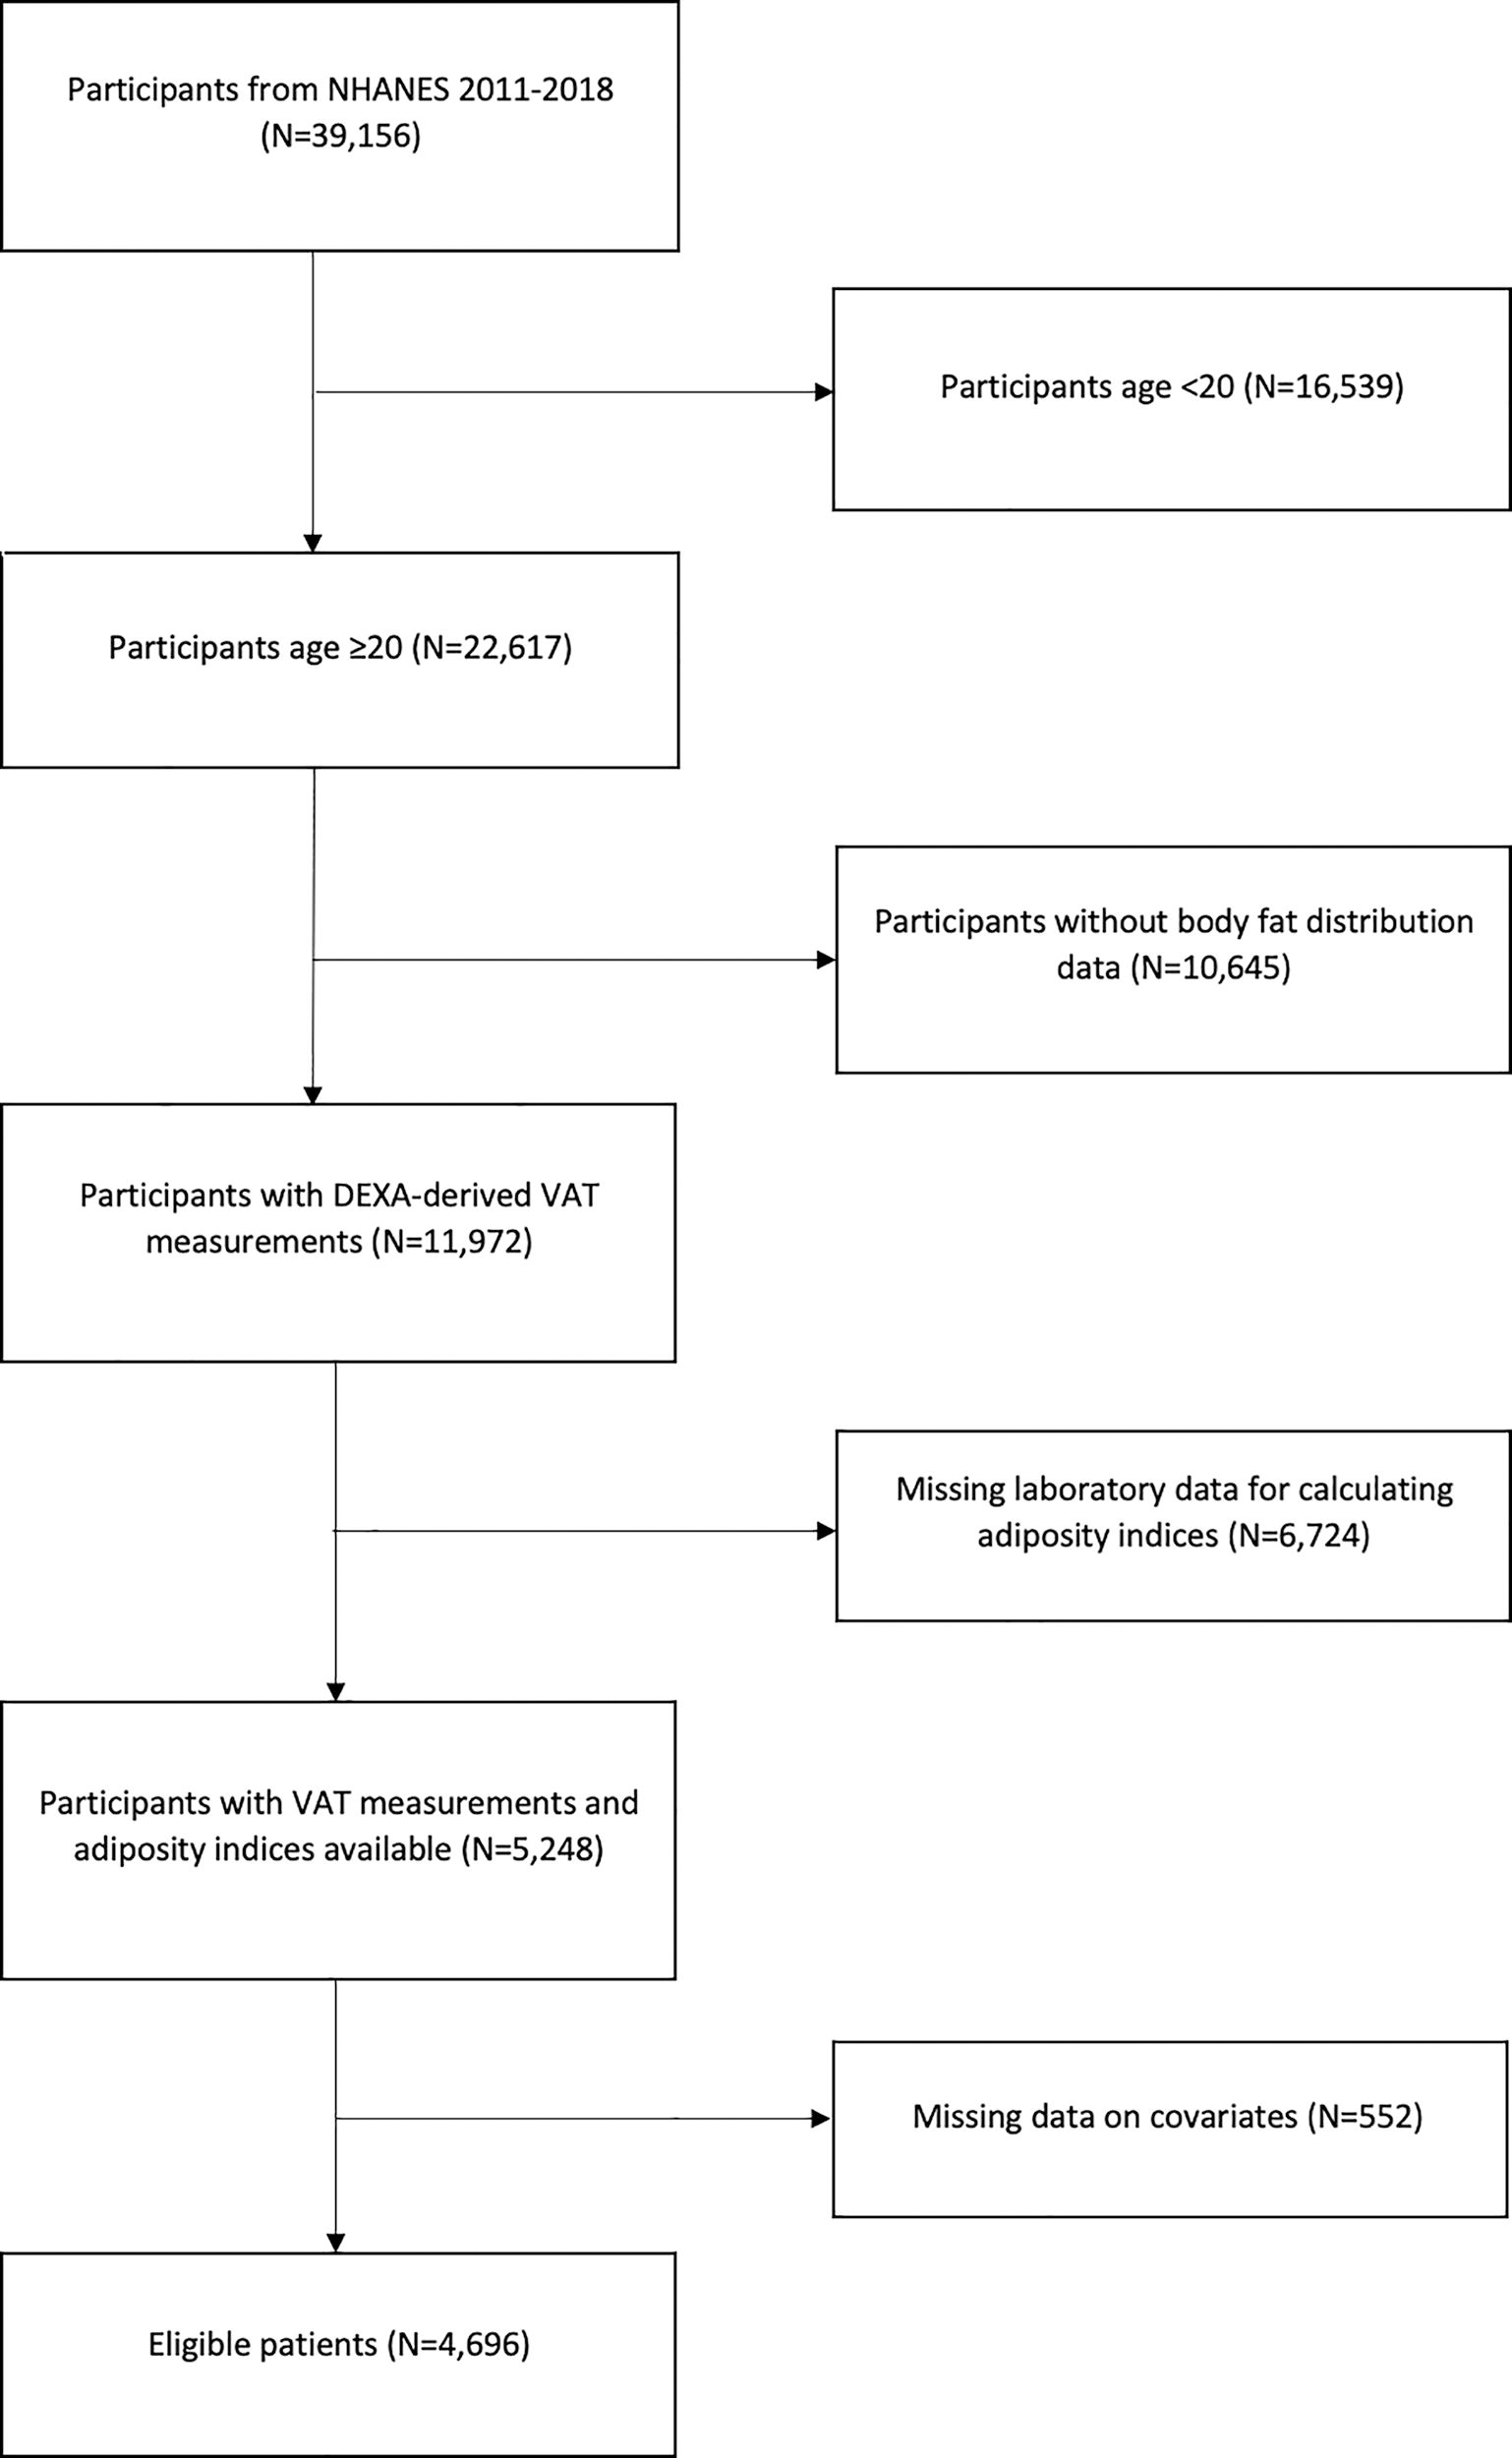
Flow diagram for inclusion and exclusion.
VAT measurement
VAT was measured at the L4−L5 intervertebral space through DEXA scans using Hologic APEX 4.0 software. For this analysis, VAT values are reported in square centimeters (cm2). Although CT and MRI are considered the gold standard for VAT measurement, these imaging modalities are not available in NHANES. Nevertheless, previous studies have shown that DEXA provides a comparable assessment of visceral fat to these methods. 15,16
Calculating adiposity indices
Tg, triglyceride, HDL-C, high-density lipoprotein cholesterol
*Binary response variable (male = 1, female = 0)
Co-variates
The NHANES surveys encompass a wide range of data, including demographic information, anthropometric measurements, lifestyle habits, and chronic diseases. In this study, the demographic variables analyzed included age, sex, race, education level, and the poverty-to-income ratio (PIR). PIR was categorized into three groups: <1.3, 1.3 − 3.5, and >3.5 based on the ratio of household income to the poverty threshold.
Anthropometric measurements included height, weight, and WC. Lifestyle factors examined were smoking status, alcohol consumption, and physical activity level. Smoking status was determined using two questions: “Have you smoked at least 100 cigarettes in your entire life?” and “Do you now smoke cigarettes?” Based on the responses, participants were classified as current, former, or never smokers.
Physical activity levels were assessed using the Global Physical Activity Questionnaire. 18 The weekly metabolic equivalent (MET) was calculated based on the suggested MET scores provided by NHANES. A MET score of 8 was assigned to vigorous work and vigorous recreational activities, while a score of 4 was assigned to moderate work, moderate recreational activities, walking, and bicycling. The total physical activity was calculated using the formula:
Physical activity (MET-min/week) = weighting factor* × weekly frequency × duration of each physical activity.
*The MET score assigned to each activity type, as defined above.
Health status was determined from physician diagnosis records or self-reported conditions, including diabetes, hypertension, hypercholesterolemia, and coronary artery disease (CAD).
Performance of adiposity indices in predicting VAT magnitude
Adiposity indices were compared in terms of their correlations with VAT, their ability to estimate the variance of VAT quantity, and their performance in identifying increased VAT. Cutoff values corresponding to increased VAT (>130 cm2) were determined, stratified by sex and race.
Developing a multivariate adaptive regression splines model to predict VAT magnitude
A multivariate adaptive regression splines (MARS) model was developed to predict VAT using variables such as age, gender, BMI, WC, glucose, HDL-C, Tg, glycated hemoglobin (HbA1c), race, education, marital status, smoking, physical activity, and co-morbidities (e.g., diabetes, hypertension, CAD).
Goodness of fit measures
Some important criteria used in comparing the models in this study are Akaike Information Criterion (AIC), root mean squared error (RMSE), and R 2 values. AIC evaluates model complexity and penalizes overfitting; lower values indicate a better fit. RMSE quantifies prediction errors, with lower values reflecting higher accuracy. R 2 explains the variance in the dependent variable; higher values indicate stronger explanatory power.
Statistical analysis
Descriptive statistics for the variables were presented in tables as mean, standard deviation, quartiles (25th, median, 75th), and frequencies (n, %). Comparisons between two groups involving a categorical and a continuous variable were performed using the independent samples t-test. For comparisons across more than two groups, the one-way analysis of variance (ANOVA) test was applied, and significant differences were further analyzed using Tukey’s post hoc test.
The association between adiposity indices and VAT was evaluated using Pearson correlation analysis. The predictive performance of adiposity indices for VAT was assessed through univariate regression analysis. The ability of these indices to identify increased VAT was compared using receiver operating characteristic (ROC) analysis. Statistical significance for the comparison of areas under the curves (AUCs) from different adiposity indices was determined using the DeLong method.
All statistical analyses were conducted using SPSS version 26.0 (IBM Corp., Armonk, NY, USA), and the ROC analysis was performed using MedCalc version 13.0 for Windows (MedCalc Software, Mariakerke, Belgium). A type I error rate of 0.05 was maintained throughout the study.
Results
Baseline characteristics
Data from 4696 participants aged 20 years and older were included in this analysis. Participants had a mean age of 39.6 ± 11.5 years, a mean BMI of 28.9 ± 6.9 kg/m2, and a mean VAT value of 104.3 ± 57.6 cm2. Of the participants, 50.5% were male. The majority of participants were non-Hispanic White (37.2%), followed by non-Hispanic Black individuals (20.8%). Hypertension was reported in 19.5% of participants, and 7.5% had a diagnosis of diabetes. Detailed characteristics of all participants are presented in Tables 1 and 2.
Descriptive Statistics of Continuous Variables
ABSI, a body shape index; BMI, body mass index; BRI, body roundness index; HbA1c, glycated hemoglobin; HDL, high-density lipoprotein; IQR, interquartile range; LAP, lipid accumulation product; METS-VF, metabolic score for visceral fat; SD, standard deviation; VAI, visceral adiposity index.
Comparison of Visceral Adipose Tissue Levels Across Demographic, Lifestyle, and Clinical Variables
PIR, poverty-to-income ratio; VAT, visceral adipose tissue.
Bold values represent statistically significant results.
VAT distribution by demographics and clinical variables
Men had significantly higher mean VAT values compared with women (P < 0.001). Among racial groups, Mexican Americans had the highest mean VAT, while non-Hispanic Black participants and those classified as “Other Races” had the lowest mean VAT compared with other groups (P < 0.001 for all). Participants with higher education levels (above high school), hypertension, hyperlipidemia, diabetes, heart failure, or CAD had significantly higher VAT levels (P < 0.001 for all). In terms of smoking status, participants who had never smoked had lower VAT values compared with current and former smokers, with former smokers showing higher VAT than current smokers (P < 0.001). The associations between demographic characteristics, lifestyle behaviors, chronic conditions, and VAT levels are summarized in Table 2.
Correlations and predictive models
All adiposity indices showed a significant positive correlation with VAT (P < 0.001 for all). Similarly, VAT was positively associated with age, glucose, and triglyceride levels, while a significant negative correlation was observed with HDL-C (P < 0.001 for all). Among the indices, WC and METS-VF showed the strongest correlations with VAT. BMI and the BRI showed strong correlations, whereas the ABSI and the VAI had weaker correlations. The correlation coefficients and the relationships between VAT and these variables are presented in Table 3.
Simple Correlations of Continuous Variables with Visceral Adipose Tissue Magnitude
Bold values represent statistically significant results.
A MARS model included a total of 20 basis functions, capturing the main and interaction effects of seven predictors. The significant contributors to the model were race, age, WC, BMI, glucose, HDL-C, and Tg. The main and interaction effects, along with their coefficients and the structure of the basis functions in the final model, are shown in Fig. 2. The MARS-derived model achieved the highest explanatory power, with an R 2 value of 75.2%, while WC and METS-VF demonstrated moderate explanatory performance. The performance of adiposity indices in explaining VAT levels is summarized in Table 4.

Main and interaction effects, coefficients, and basis function structure of the MARS model developed for visceral adipose tissue prediction. MARS, multivariate adaptive regression splines.
Predictive Performance of Adiposity Indices for Visceral Adipose Tissue Magnitude Using Simple Linear Regression
Coefficient of determination.
AIC, Akaike’s information criterion; BMI, body mass index (kg/m2); MARS, multivariate adaptive regression splines; RMSE, root mean square error; WC, waist circumference (cm).
Predictive performance of adiposity indices
The predictive abilities of adiposity indices for increased VAT were also examined after stratification by sex (Fig. 3). METS-VF had the highest AUC in both men [AUC: 0.887 (0.873–0.899)] and women [AUC: 0.904 (0.891–0.916)], followed by WC [men: 0.866 (0.851–0.879); women: 0.883 (0.869–0.896)]. In men, the optimal METS-VF cutoff was 7.1, with a sensitivity of 82.7% and a specificity of 78.1%. For WC, the optimal cutoff was 99.5 cm, with a sensitivity of 83.1% and a specificity of 72.9%. In women, the METS-VF cutoff was 7.5, with a sensitivity of 89.3% and a specificity of 78%, while the WC cutoff was 96 cm, with a sensitivity of 88.8% and a specificity of 72.2% (Table 5).
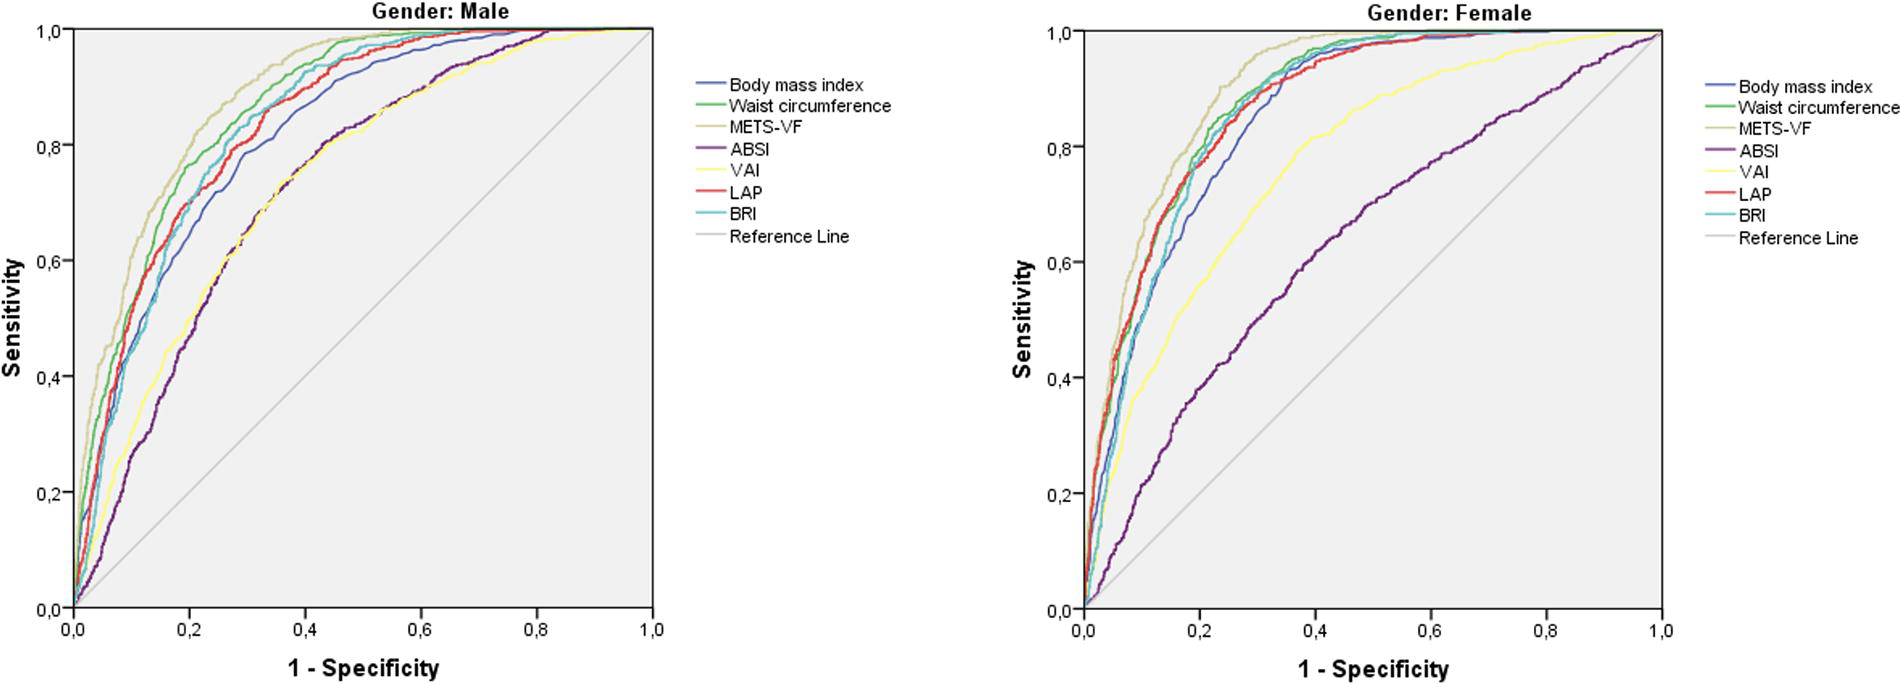
Predictive abilities of adiposity indices for increased visceral adipose tissue after stratification by gender.
Optimal Cutoff Values, Area Under the Curve, Sensitivity, Specificity, and P Values of Adiposity Indices for Predicting Increased Visceral Adipose Tissue
AUC, areas under the curve; CI, confidence interval.
Bold values represent statistically significant results.
When comparing AUCs, METS-VF was superior to all other indices in predicting increased VAT in both sexes (Table 6). Similarly, when stratified by race, METS-VF consistently had the highest AUC across all racial groups, followed by WC (Table 7).
P Values Obtained as a Result of Comparing the AUC Values of the Adiposity Indices
Bold values represent statistically significant results.
Predictive Performance (Area Under the Curve and 95% Confidence Intervals) of Adiposity Indices for Increased Visceral Adipose Tissue, Stratified by Race
Values in parentheses indicate the 95% CIs for the AUC.
Discussion
In our study, all currently used adiposity indices for assessing obesity-related cardiometabolic risk were significantly associated with VAT levels. Among these indices, METS-VF demonstrated superior performance in predicting increased VAT across both genders compared with all other indices. In the model developed using a dataset, which outperformed existing indices in predicting VAT, race, age, WC, and BMI were identified as the most impactful variables contributing to the model’s predictive capacity.
The association between abdominal obesity and cardiometabolic diseases has been well-documented in numerous studies spanning over three decades. 19,20 Following Vague’s seminal work highlighting the importance of fat distribution, 2 the waist-to-hip ratio (WHR) was initially prioritized. However, it became evident that the WHR could not adequately predict visceral obesity, as it yielded similar results for individuals with both high gluteal and abdominal fat and those with low levels of both. 21 Consequently, WC, which more directly reflects abdominal fat accumulation, gained prominence. Indeed, WC has been shown to have a stronger association with VAT compared with both WHR and BMI. 22,23 Similarly, in our study, WC was strongly correlated with VAT and was a more robust predictor of excessive VAT compared with BMI.
METS-VF is a recently developed complex formula that incorporates not only WC but also age, gender, additional anthropometric measurements, and metabolic parameters. 13 It was shown to strongly predict VAT levels measured via DEXA in the cohort used for its development and was subsequently validated in a separate cohort using MRI measurements. Unlike most adiposity indices (except for BRI), which have not been examined for their association with VAT during either development or validation stages, METS-VF’s demonstrated success in predicting VAT in our study likely stems from this robust methodology. Studies in various populations have also confirmed that METS-VF is strongly correlated with VAT in both apparently healthy individuals and morbidly obese populations. 24,25
In our study, the relatively lower performance of ABSI and VAI aligns with the findings of our previous research on the Turkish population. 26 While ABSI was initially developed as a measure strongly associated with premature mortality, subsequent studies have demonstrated that its association with cardiometabolic diseases is weaker compared with other adiposity surrogates. 27,28 VAI, despite its widespread use for predicting obesity-related cardiometabolic risk, has limitations stemming from its development in a healthy, non-obese cohort and the use of MR-measured VAT values in only 26 participants. 10 These factors hinder the generalizability of VAI to diverse populations and its ability to provide quantitative VAT predictions. Indeed, some studies have shown that VAI has a reduced ability to predict VAT and cardiovascular outcomes compared with traditional surrogates. 29,30
Our study also found a moderate yet significant association between VAT and age. In the MARS model developed from our dataset, both race and age emerged as determinants of VAT levels. The model indicated a more pronounced increase in VAT levels after the age of 32. Studies examining the relationship between age and VAT using CT measurements support this finding, although prospective studies are needed to define specific age thresholds. 31,32 Our study also found that the differences in VAT values among racial groups, with Mexican Americans and Whites having higher VAT values and Blacks having lower VAT values, are consistent with previous studies. 33,34 These findings align with the higher prevalence of diabetes observed in Mexican Americans in the United States population, supporting the established relationship between visceral fat and insulin resistance. 35
The optimal METS-VF cutoff value for predicting increased VAT was determined to be 7.1 in men and 7.5 in women. In the study that developed METS-VF, a VAT threshold of 100 cm2 was used, yielding a cutoff value of 7.2. A study conducted on morbidly obese individuals used a VAT threshold of 163 cm2 and found a cutoff value of 7.3. In our study of an apparently healthy population, we previously identified cutoff values of 6.4 in men and 6.5 in women for a VAT threshold of 130 cm2. These differences in cutoff values are largely attributable to variations in the reference VAT thresholds. Thresholds for increased VAT associated with cardiometabolic risk vary widely in the literature, ranging from 70 to 165.9 cm2, depending on the population characteristics, particularly race/ethnicity. 36 For instance, thresholds determined for Asian populations are typically lower than those for Caucasian populations. 37 In some studies, women have been found to have lower VAT thresholds than men, while in others, the thresholds are equivalent across genders. 38,39
In our study, we used a threshold of 130 cm2, as identified by Onat et al., who associated this value with increased cardiometabolic risk in both genders. 40 While it is well-established that women, particularly premenopausal women, have lower visceral fat levels than men, 3 this does not justify adopting a lower VAT threshold for women. The higher prevalence of cardiovascular disease in men is largely explained by their greater visceral fat accumulation. As Lemieux et al. demonstrated, after adjusting for VAT, the differences in cardiometabolic risk factors between men and women largely disappear. 41 This indicates that the observed disparity in cardiovascular risk is primarily due to differences in visceral fat magnitude rather than inherent gender-related factors. Therefore, using the same VAT threshold for both genders is a more rational and consistent approach.
The main strength of this study is the ability to present cutoff values for adiposity surrogates across five distinct racial groups, which represent a substantial portion of the global population. This was enabled by the NHANES sampling methodology, ensuring that our findings are both diverse and representative. However, there are some limitations. First, due to the extended study period, the complex calculation of adiposity indices, and the potential for errors in both anthropometric and biochemical measurements, the results may be prone to inaccuracies. Second, certain variables, such as smoking status and medical history, were based on self-reported data, which could lead to recall bias. Third, we did not adjust the comparison of adiposity indices for potential variables that could influence VAT. However, since all the significant contributors to VAT in our dataset—gender, BMI, WC, glucose, HDL-C, and TG—are already included in the formula of at least one of the adiposity indices being compared, such adjustments would contradict the purpose of the comparison. In addition, the variable with the strongest contribution to VAT prediction, race, was addressed by performing subgroup analyses within racial categories. However, it remains possible that certain unmeasured co-variates influencing VAT may have been omitted.
To conclude, this study found that VAT, a major risk factor for cardiometabolic diseases, varies significantly across demographic groups. METS-VF showed the highest predictive value among the indices evaluated, followed by WC. While the practicality of WC measurement remains important, these findings underscore the potential utility of METS-VF in clinical practice. Furthermore, they encourage comprehensive studies in diverse populations to further explore the association between METS-VF and visceral fat accumulation.
Footnotes
Authors’ Contributions
C.T.: Conceptualization (lead), writing—original draft (lead), methodology (equal), writing—review and editing (equal). H.A.: Formal analysis (lead), conceptualization (supporting), writing—original draft (supporting), methodology (equal), writing—review and editing (equal).
Author Disclosure Statement
There is no conflict of interests to disclose.