




Abstract
Purpose:
The relationship between regional fat and obstructive sleep apnea (OSA) remains poorly understood. This study seeks to explore the link between regional fat and OSA, utilizing data from the National Health and Nutrition Examination Survey (NHANES).
Methods:
This cross-sectional analysis used NHANES 2015–2018 data. OSA symptoms were assessed through sleep questionnaires. Regional fat mass (FM) was measured using dual-energy X-ray absorptiometry, including trunk, arm, leg, android, gynoid, and abdominal FM. The fat mass index (FMI) was calculated by dividing FM by the square of height. Logistic regression evaluated the association between regional FMI and OSA, with univariate and stratified analyses to identify potential effect modifiers.
Results:
A total of 3,099 participants were included, with 1,595 classified into the OSA group. Significant associations were found between OSA and several regional FMIs, including trunk, arm, leg, android, gynoid, and abdomen. These associations were consistent in males, and in females, leg and gynoid FMI were not linked to OSA. Stratified analyses by race revealed significant associations between OSA and regional FMI indices (trunk, arm, leg, android, gynoid, and abdominal FMI) in non-Hispanic Whites and between OSA and trunk, android, and abdominal FMI in other Hispanics. No associations were observed in the Mexican American or non-Hispanic Black groups. Stratification by body mass index (BMI) indicated distinct profiles: obese individuals (BMI ≥30) showed associations limited to trunk, arm, android, and abdominal FMIs, while nonobese participants (BMI <30) displayed broader associations encompassing all regional FMIs. Both univariate and stratified analyses highlighted abdominal FMI as the strongest predictor of OSA.
Conclusion:
Higher regional FMI, particularly abdominal fat, is associated with an increased risk of OSA, with stronger associations observed in male, White, and nonobese populations.
Introduction
Obstructive sleep apnea (OSA) is a sleep-related breathing disorder characterized by repeated partial or complete obstruction of the pharyngeal airway. Its primary symptoms include snoring, awakenings, breathing pauses, and excessive daytime sleepiness. 1,2 Untreated OSA is associated with severe complications and higher mortality rates, 3,4 posing a significant threat to both individual and global health. A study utilizing advanced statistical modeling techniques reveals that nearly 1 billion adults aged 30–69 worldwide may have OSA, with an estimated 425 million suffering from moderate to severe cases. 5 In addition to its impact on personal health, the economic cost of OSA is substantial, affecting productivity and public safety both directly and indirectly across individuals, families, and societies. 6 –8
Obesity is the most commonly known risk factor for OSA, 1 and excessive fat deposition may play a mechanistic role in the development and progression of OSA. Fat in the neck region is believed to directly compress the upper airway 9 ; accumulation of fat within the thoracic cavity imposes mechanical restrictions on lung expansion, thus reducing lung capacity 10 ; accumulation of abdominal fat may lead to reduced longitudinal tracheal traction, which increases tracheal pull, thereby narrowing the upper airway. 11 However, the specific contributions of different patterns of obesity to the development and severity of OSA remain insufficiently understood.
The traditional anthropometric indices used in OSA research include body mass index (BMI), waist and neck circumferences, neck–waist ratio, waist–hip ratio, and skinfold measurements. These indices have limited accuracy in determining fat distribution. 12,13 Studies have shown that the fat mass index (FMI) is a more accurate reflection of body fat as it is not influenced by other body components, such as lean body mass. 14 –16 Our objective is to investigate the relationship between regional fat distribution and OSA using FMI, with data sourced from the National Health and Nutrition Examination Survey (NHANES) dataset.
Materials and Methods
Data source
This cross-sectional study utilized the publicly accessible NHANES dataset, which does not require further approval from an ethics review board. NHANES is a nationally representative survey conducted by the National Center for Health Statistics in the United States. It employs a stratified multistage probability sampling design to evaluate the relationships between nutrition, health promotion, and disease prevention. The survey, conducted biennially, encompasses demographics, dietary intake, examinations, laboratory tests, and questionnaire components. For more information about the NHANES database, visit http://www.cdc.gov/nhanes.
Study participants
Participants were drawn from the NHANES datasets covering the period from 2015 to 2018. Of the initial cohort of 19,225 individuals, 11,498 were excluded because of the absence of dual-energy X-ray absorptiometry (DXA) data, and 2,542 were omitted because of missing OSA data. Furthermore, 2,086 participants were excluded because of incomplete covariate data. Consequently, the final analysis comprised 3,099 participants, as illustrated in Fig. 1.
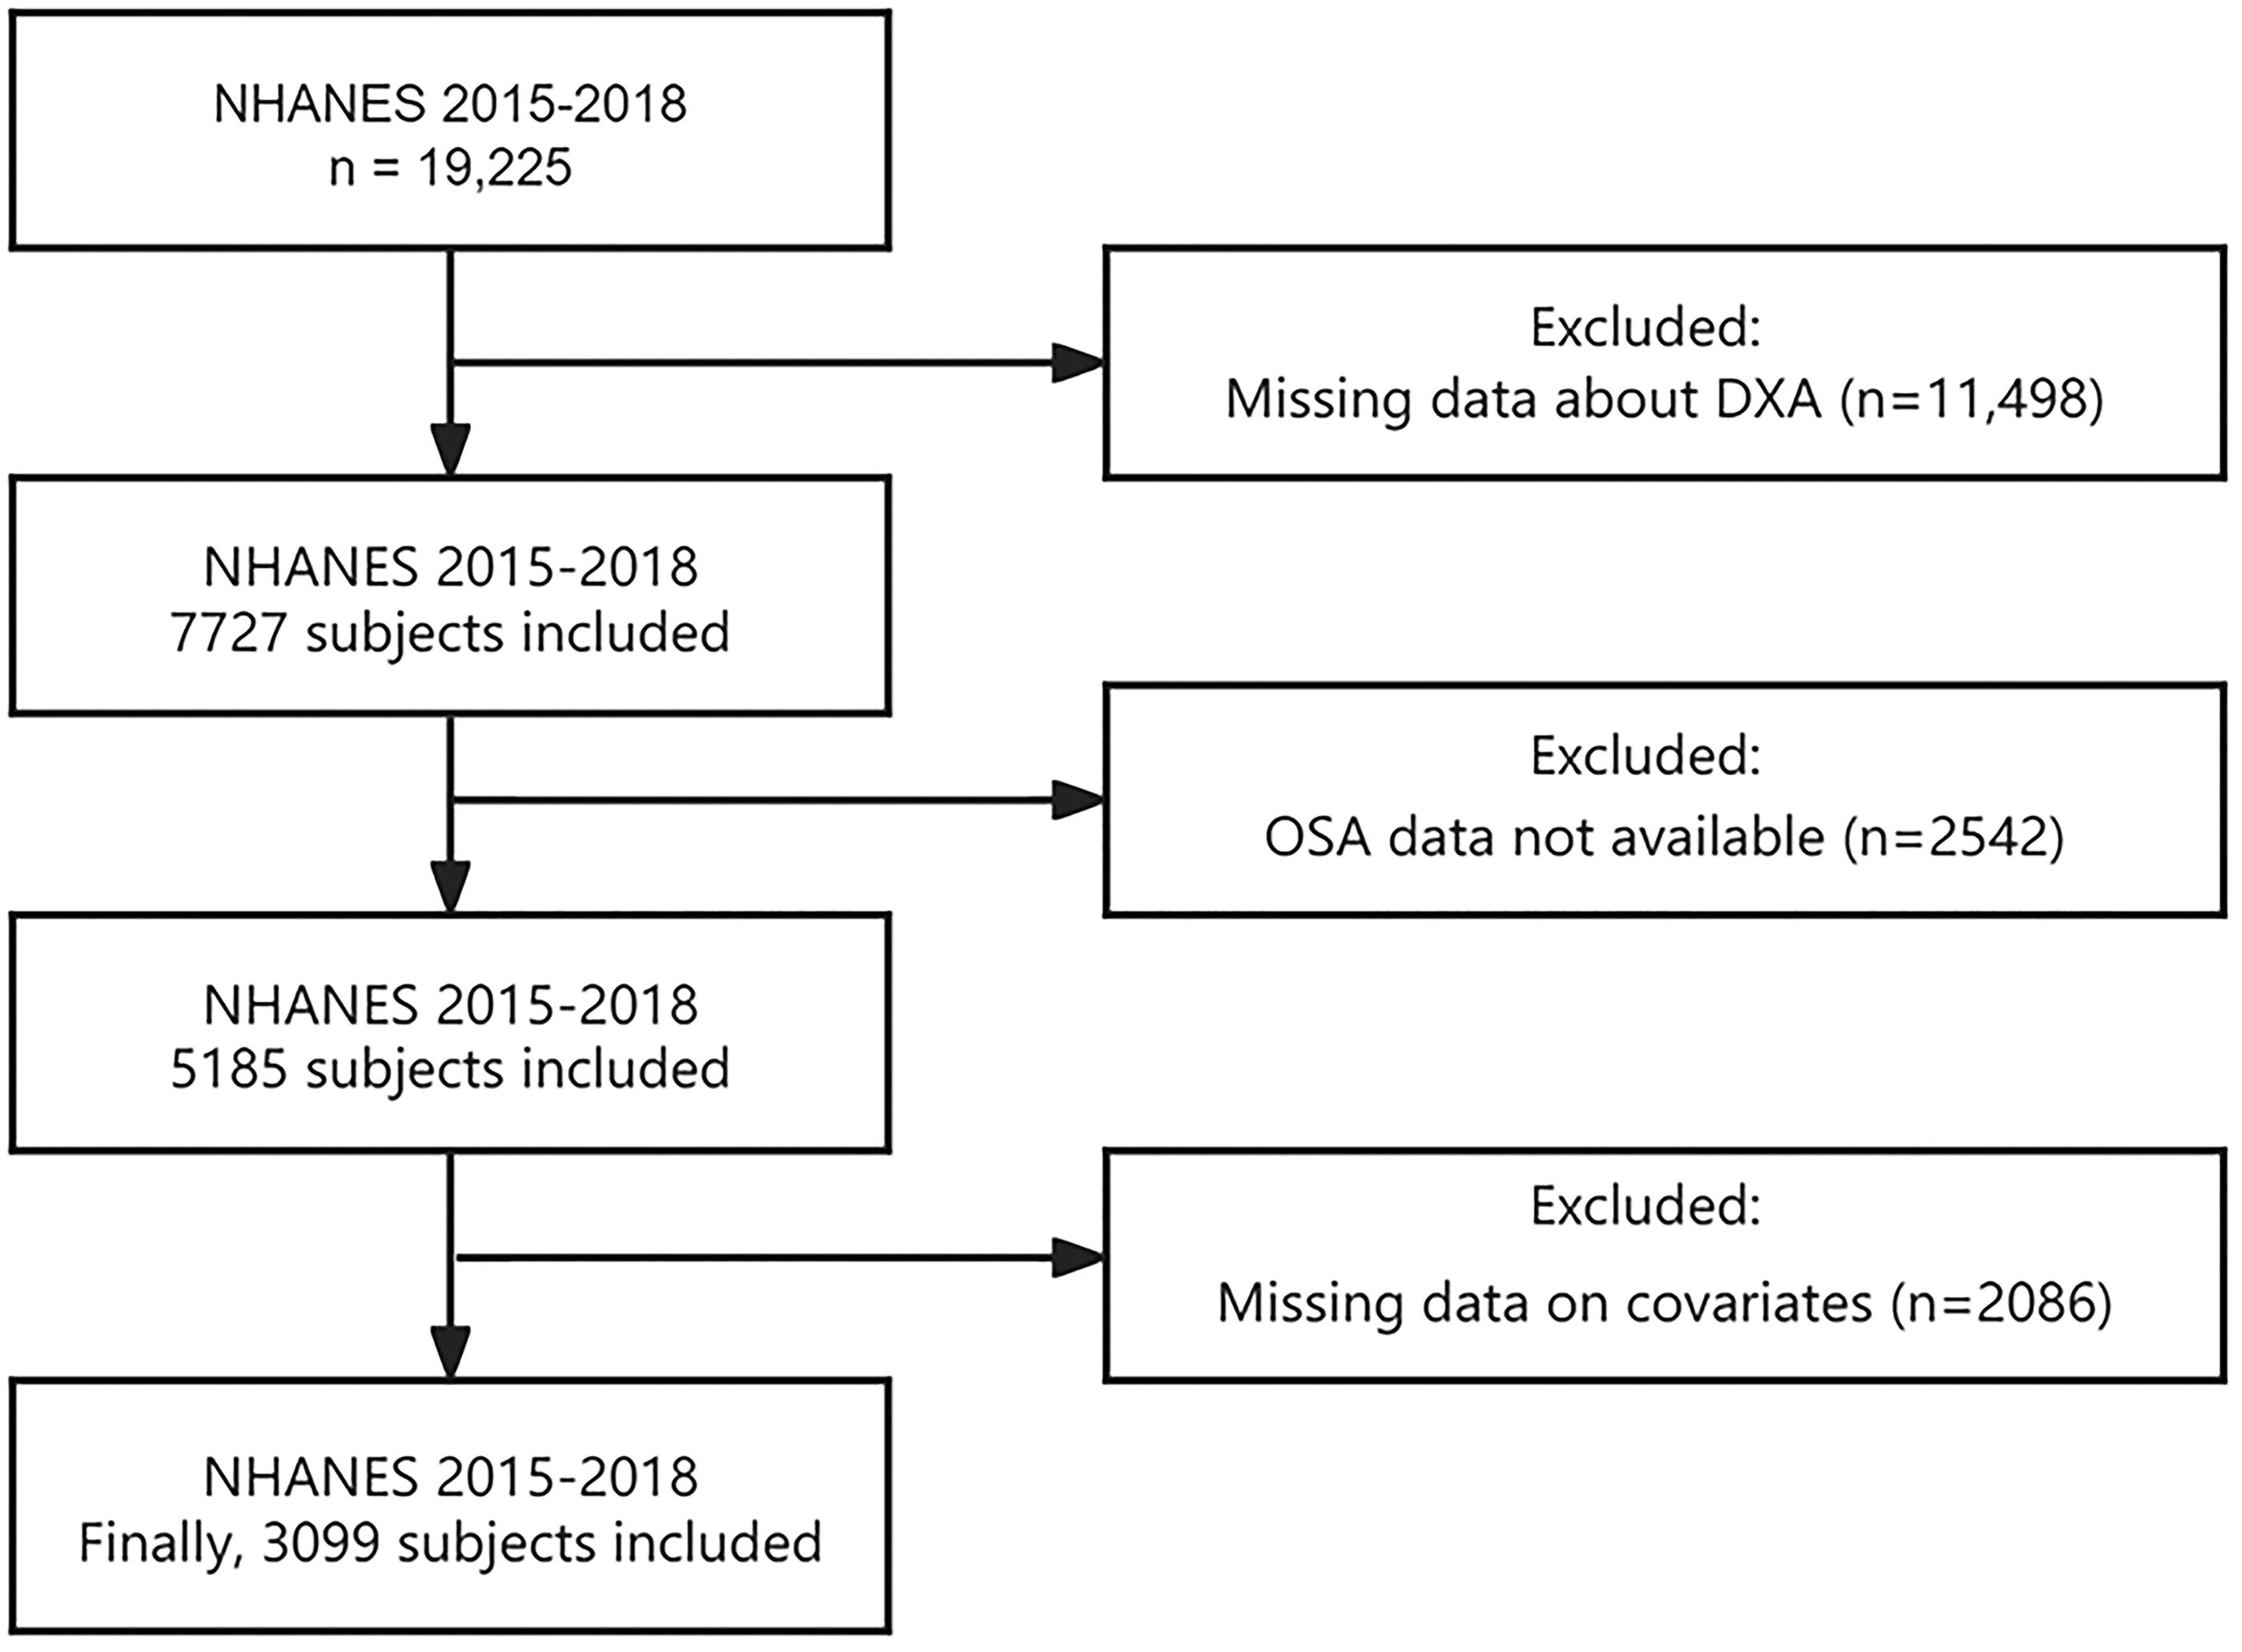
Participant flow chart.
Obstructive sleep apnea
Based on prior research, a diagnosis of OSA can be established if an individual responds “yes” to at least one of the following three NHANES questions 17 : (1) Severe daytime sleepiness despite sleeping at least 7 hours per night, with 16–30 incidents reported; (2) Three or more instances of gasping, grunting, or apneas per week; (3) Snoring occurring three or more times per week.
Fat mass index
Whole-body DXA scans are conducted by trained operators on participants aged 8–59, excluding pregnant women; those who self-report the use of radiographical contrast agents (barium) in the past 7 days; and those who self-report a weight over 450 pounds or a height exceeding 6′5″. The scans use the Hologic Discovery A densitometer (Hologic, Inc., Bedford, Massachusetts, USA). All DXA scans require quality control and analysis to measure soft tissue and bone at various body sites. The current analysis includes fat mass (FM) for the left and right arms, left and right legs, trunk, android, gynoid, and abdominal fat. Arm and leg FM are defined as the sum of the bilateral limb FM. FMI is calculated by dividing the FM (in kilograms) by the square of the height (in meters).
Covariates
In accordance with clinical judgment and previous research, 18,19 the following covariates were included: age (years), gender (male/female), race/ethnicity (non-Hispanic White, non-Hispanic Black, Mexican American, other Hispanic, other), educational attainment (less than high school, high school graduate, some college, or higher), marital status (married/living with a partner, living alone), poverty–income ratio (PIR; calculated as family income divided by the U.S. Department of Health and Human Services poverty threshold specific to household size and survey year), BMI, total cholesterol (TC), and high-density lipoprotein (HDL) levels. Smoking status was categorized into three groups: never (fewer than 100 cigarettes lifetime), former (more than 100 cigarettes lifetime but currently abstinent), and current (more than 100 cigarettes lifetime and currently smoking). Drinking status was classified as drinking four to five or more alcoholic beverages per day. Diabetes and hypertension were self-reported by participants who had been diagnosed by medical professionals.
Statistical analysis
In analyzing NHANES data, this study adhered to the guidelines outlined by NHANES. Interview weights were incorporated into all analyses to ensure nationally representative estimates. To account for standard errors related to the complex survey design, the study utilized primary sampling unit variables and stratification variables.
Descriptive and regression analyses were conducted using weighted samples. Continuous variables, assuming normal distribution, are presented as means ± standard deviations, while categorical variables are reported as counts and weighted percentages. Independent t tests or chi-squared tests were employed to analyze baseline information between the control and OSA groups. Multivariable logistic regression models were used to examine the association between regional FMI and OSA. Three models were constructed: Model 1 was adjusted for age, gender, and race; Model 2 included additional adjustments for education level, PIR, and marital status; Model 3 further accounted for BMI, TC, HDL, smoking status, drinking status, diabetes, and hypertension. Subgroup analyses stratified by gender, race, and BMI were also performed, presented using Model 3. Effect sizes are reported as odds ratios (OR) with corresponding 95% confidence intervals (CI).
All statistical analyses were conducted using R software (version 4.3.2). Statistical significance was determined by a P value <0.05.
Results
Participant weighted baseline characteristics
The study included 3,099 individuals who met the criteria, representing a weighted population of 80,880,482. Baseline characteristics of the participants, categorized by the presence or absence of OSA, are summarized in Table 1. The OSA group, consisting of 1,595 individuals with a mean age of 41 ± 11 years, comprised 41% females and 59% males. This group exhibited significantly higher localized fat indices compared with the non-OSA group. Significant differences were observed between OSA and non-OSA participants in terms of age, gender, race, marital status, educational level, BMI, TC, HDL, smoking status, drinking status, hypertension, and diabetes, with the exception of PIR (P < 0.05).
Weighted Baseline Characteristics
BMI, body mass index; FMI, fat mass index; HDL, high-density lipoprotein; OSA, obstructive sleep apnea; PIR, poverty–income ratio; TC, total cholesterol.
Weighted associations between regional FMI and OSA in the entire study population
Three sets of weighted logistic regression models were employed to evaluate the relationships between OSA and regional FMI, as presented in Table 2. All models demonstrated a significant positive association between OSA and FMI across the specified body regions. In the fully adjusted multivariable regression models, the associations were as follows: trunk FMI (OR = 1.26, 95% CI = 1.12–1.42, P = 0.001), arm FMI (OR = 1.95, 95% CI = 1.29–2.97, P = 0.005), leg FMI (OR = 1.21, 95% CI = 1.05–1.40, P = 0.014), android FMI (OR = 3.08, 95% CI = 1.77–5.34, P < 0.001), gynoid FMI (OR = 1.53, 95% CI = 1.08–2.15, P = 0.020), and abdominal FMI (OR = 4.09, 95% CI = 1.90–8.78, P = 0.002). The associations with abdominal FMI were particularly pronounced (Table 2).
Associations Between Regional Fat Mass and OSA in the Entire Study Population
Model 1 is adjusted for age, gender, and race. Model 2 includes adjustments for age, gender, race, education level, PIR, marital status. Model 3 accounts for age, gender, race, education level, PIR, marital status, BMI, TC, HDL, smoking status, drinking status, diabetes, and hypertension.
CI, confidence interval; OR, odds ratio.
Subgroup analyses
Subgroup analyses were performed to explore potential variations in associations based on gender, race, and BMI.
Gender-stratified analysis
In the gender-stratified analysis, as shown in Table 3, trunk FMI (OR = 1.33, 95% CI = 1.11–1.60, P = 0.005), arm FMI (OR = 3.07, 95% CI = 1.69–5.57, P = 0.001), leg FMI (OR = 1.44, 95% CI = 1.12–1.84, P = 0.008), android FMI (OR = 3.56, 95% CI = 1.59–7.94, P = 0.005), gynoid FMI (OR = 2.13, 95% CI = 1.19–3.81, P = 0.015), and abdominal FMI (OR = 6.45, 95% CI = 2.21–18.90, P = 0.003) were significantly associated with OSA in males. In females, significant associations were observed with trunk FMI (OR = 1.25, 95% CI = 1.07–1.45, P = 0.007), arm FMI (OR = 1.76, 95% CI = 1.05–2.95, P = 0.035), android FMI (OR = 2.97, 95% CI = 1.45–6.08, P = 0.006), and abdominal FMI (OR = 3.52, 95% CI = 1.31–9.49, P = 0.017), and no significant associations were found for leg FMI and gynoid FMI (all P > 0.05).
Associations Between Regional FMI and OSA by Gender
Race-stratified analysis
In the race-stratified analysis, trunk FMI (OR = 1.33, 95% CI = 1.09–1.63, P = 0.009), arm FMI (OR = 2.51, 95% CI = 1.19–5.29, P = 0.019), leg FMI (OR = 1.30, 95% CI = 1.02–1.66, P = 0.039), android FMI (OR = 3.80, 95% CI = 1.54–9.33, P = 0.007), gynoid FMI (OR = 1.81, 95% CI = 1.02–3.21, P = 0.042), and abdominal FMI (OR = 5.46, 95% CI = 1.59–18.80, P = 0.011) were significantly associated with OSA among non-Hispanic Whites. For other Hispanics, significant associations were noted for trunk FMI (OR = 1.36, 95% CI = 1.06–1.74, P = 0.02), android FMI (OR = 3.24, 95% CI = 1.25–8.42, P = 0.02), and abdominal FMI (OR = 4.95, 95% CI = 1.20–20.50, P = 0.031). No significant relationships were observed in the Mexican American and non-Hispanic Black groups (all P > 0.05) (Table 4).
Associations Between Regional FMI and OSA by Race
BMI-stratified analysis
In individuals with BMI ≥30, trunk FMI (OR = 1.18, 95% CI = 1.05–1.33, P = 0.01), arm FMI (OR = 1.49, 95% CI = 1.06–2.10, P = 0.026), android FMI (OR = 2.13, 95% CI = 1.24–3.66, P = 0.01), and abdominal FMI (OR = 2.60, 95% CI = 1.12–6.05, P = 0.029) were positively associated with OSA, whereas leg/gynoid FMI showed non-significant trends. In contrast, among those with BMI <30, all regional FMIs exhibited stronger significant associations: trunk (OR = 1.37, 95% CI = 1.15–1.63, P = 0.002), arm (OR = 3.11, 95% CI = 1.40–6.94, P = 0.009), leg (OR = 1.32, 95% CI = 1.02–1.71, P = 0.036), android (OR = 5.16, 95% CI = 2.19–12.2, P = 0.001), gynoid (OR = 1.78, 95% CI = 1.02–3.13, P = 0.045), and abdominal FMI (OR = 6.25, 95% CI = 2.25–17.40, P = 0.002), with abdominal fat demonstrating the highest risk elevation in both subgroups (Table 5).
Associations Between Regional FMI and OSA by BMI
Discussion
This cross-sectional study analyzed data from a comprehensive, nationally representative community survey conducted in the United States, examining the association between body fat and OSA in a diverse population. To the best of our knowledge, this is the first study to report an association between body fat distribution and OSA within the general U.S. population. We analyzed the regional FMI for the trunk, arm, leg, android, gynoid, and abdominal regions. After controlling for a variety of potential confounding factors, our results indicate that regional FMI in all the aforementioned areas is associated with OSA, with abdominal FMI showing the most significant correlation. This association persists across subgroup analyses by gender, race, and BMI. Stratified analysis further revealed that the relationship between abdominal FMI and OSA is more pronounced in males, the White population, and nonobese population.
Our findings share similarities with those of other studies in this field. In a Mendelian randomization study using data from large genome-wide association studies, 20 excessive fat in both limbs and trunk was shown to increase OSA risk. However, this study’s fat measurements were limited to trunk and limbs, and these findings were exclusively based on European-ancestry populations. In an exploratory ancillary study of individuals with sleep disorders, Tan et al. observed associations between FM of trunk and android regions with OSA. However, this research was restricted to overweight or obese male participants. 21 Degache et al. found that specific regional fat distribution is a prognostic factor for the severity of OSA. However, this research was confined to between-group comparisons in elderly subjects aged >65 years. 22 Notably, a longitudinal study by Martin et al. demonstrated no effect of central FM on OSA. The study participants were recruited from a cross-sectional community-based survey of a homogenous group of elderly subjects enrolled through strict inclusion criteria, and therefore, the findings may not be fully representative of clinical populations, requiring particular caution in result extrapolation. 23 Our results showed that both central and peripheral FMI are associated with OSA, and central fat has a more significant impact on OSA than peripheral fat. Central obesity not only increases intra-abdominal pressure, reduces lung volume, and raises the likelihood of upper airway collapse 24 but also leads to an increase in visceral fat, which secretes various inflammatory and adipokines, contributing to systemic inflammation and oxidative stress, affecting upper airway muscle activity, promoting fat tissue growth around the upper airway, thereby increasing the risk of OSA. 25,26
Beyond the general association between fat distribution and OSA, our findings further reveal significant gender-specific patterns in this relationship. To explore potential effect modification by gender, we conducted gender-stratified analyses. The results suggested that the association between fat distribution and OSA was more pronounced in males, with the direction and magnitude of effects aligning with the primary findings. However, for females, the relationship between leg and gynoid FMI and OSA did not reach statistical significance. This discrepancy may originate from sexually dimorphic adiposity distribution patterns. Specifically, females tend to distribute fat around the buttocks and thighs, whereas males typically accumulate excess fat more centrally in the abdominal area. 27 This correlates with higher insulin resistance in males than in females. 28 However, this pattern changes after menopause in females, where fat storage becomes more centralized, and metabolic risks become more similar to those of males. 29 In addition, our results suggest that regardless of gender, an increase in central fat is a significant contributing factor to the pathogenesis of OSA, a finding also confirmed by a clinical cohort study of 96 patients with OSA (M/F = 60/36). 30
Previous studies have rarely addressed the differences in OSA symptoms and regional fat across ethnicities. Our ethnicity-stratified analyses revealed differential adiposity–OSA associations across racial/ethnic groups: In non-Hispanic Whites, there was a clear association between OSA and the FMI in the trunk, arm, leg, android, gynoid, and abdominal areas. While comparable effect sizes emerged for trunk/android/gynoid FMI in other Hispanics, the specific patterns of fat distribution may differ from those of non-Hispanic Whites. However, no statistically significant associations were detected in Mexican Americans or non-Hispanic Blacks. Genetic differences among ethnicities may lead to different patterns of fat accumulation and distribution, 29,31 which could affect the pathogenesis of OSA. In addition, lifestyle, dietary habits, and socioeconomic status may vary among ethnic groups, 32,33 potentially influencing fat distribution and its impact on OSA.
Our BMI-stratified analyses revealed a critical paradox: while regional adiposity universally predicted OSA risk across BMI categories, the magnitude exhibited profound obesity-status dependency. Notably, nonobese individuals exhibited markedly stronger associations between abdominal/android fat accumulation and OSA risk compared with obese counterparts, with the magnitude of association nearly doubling across key fat compartments, suggesting that regional fat distribution could be a more critical determinant of OSA risk than overall adiposity in nonobese populations. We posit that this phenomenon may stem from limited adipose expandability in nonobese individuals, leading to preferential deposition of visceral/ectopic fat that exerts disproportionate mechanical and metabolic effects. Supporting this perspective, a cross-sectional study by Lin et al. found that higher FM in the trunk, calf, and arms was associated with increased risks of metabolic abnormalities, particularly in nonobese populations not classified as obese by BMI. This underscores the importance of assessing fat distribution beyond BMI for preventing metabolic syndrome. 34
This study has certain advantages, as body fat was measured using the gold-standard DXA, and as an important epidemiological study in the United States, NHANES has strict quality control procedures for data collection, making the conclusions quite reliable. In addition, the study adjusted for potential sociodemographic and lifestyle confounders to achieve more robust results. We used a weighted sample analysis to test the associations, making the results more generalizable. However, this study still has the following limitations: (1) Because of its cross-sectional design, it cannot observe the dynamic changes in body indices. (2) DXA screening was only conducted on adolescents and middle-aged adults, so the results cannot be generalized to older adults. (3) We diagnosed OSA based on some typical symptoms found in the NHANES questionnaire, such as daytime sleepiness, apnea, and snoring. Recall or self-report bias becomes a limitation of using questionnaires to collect information, but using the NHANES database, there are multiple studies on OSA. 35 –37
This large-scale population study demonstrates that regional fat distribution, particularly abdominal adiposity, is independently associated with OSA risk, with the abdominal FMI exhibiting superior predictive capacity across demographic subgroups. The differential associations observed by gender (male-specific universal associations vs. female-selective patterns), race (strongest in non-Hispanic Whites), and obesity status (enhanced effects in nonobese individuals) collectively suggest that OSA pathogenesis involves fat compartment-specific mechanisms interacting with population characteristics. Crucially, the identification of abdominal fat accumulation as a consistent risk determinant, even in nonobese individuals, underscores its potential utility as a screening biomarker for OSA susceptibility beyond conventional BMI thresholds. These findings advocate for incorporating regional adiposity assessment into OSA risk stratification frameworks, particularly in populations where traditional obesity metrics may fail to capture true metabolic risk.
Footnotes
Acknowledgments
We utilized data from the NHANES database. We gratefully acknowledge the National Center for Health Statistics for providing this public resource.
Authors’ Contributions
T.W. and G.Z. proposed the theme of this study, performed methodology and formal analysis, completed the writing of the original draft. L.T., Y.O., and H.L. were responsible for investigation and validation and also coordinated all works. X.Z. and Y.C. conducted data collection and visualization. J.P. supervised and checked the article writing and arranged funding acquisition. All authors are responsible for all aspects of the study, ensuring that any issues related to the accuracy and completeness of any part of the work are appropriately investigated and addressed.
Data Availability
Ethical Approval
The ethics review for this study was approved by the National Center for Health Statistics Institutional Review Board. The methods used in this study were conducted in accordance with relevant guidelines and regulations, including the Declaration of Helsinki. All individuals provided written informed consent prior to participating in the study. For more details, please refer to  .
.
Author Disclosure Statement
No conflicting financial interests exist.
Funding Information
This work was supported by grants from the National Key Research and Development Program of China (grant no. 2022YFC2503902).