
Abstract
A sol-gel microarray system was developed for a protein interaction assay with high activity. Comparing to 2-dimensional microarray surfaces, sol-gel can offer a more dynamic and broad range for proteins. In the present study, this sol-gel–integrated protein array was used in binding affinity analysis for aptamers. Six RNA aptamers and their target protein, yeast TBP (TATA-binding protein), were used to evaluate this method. A TBP-containing sol-gel mixture was spotted using a dispensing workstation under high-humidity conditions and each Cy-3–labeled aptamer was incubated. The dissociation constants (Kd) were calculated by plotting the fluorescent intensity of the bound aptamers as a function of the TBP concentrations. The Kd value of the control aptamer was found to be 8 nM, which agrees well with the values obtained using the conventional method, electric mobility shift assay. The sol-gel–based binding affinity measurements fit well with conventional binding affinity measurements, suggesting their possible use as an alternative to the conventional method. In addition, aptamer affinity measurements by the sol-gel–integrated protein chip make it possible to develop a simple high-throughput affinity method for screening high-affinity aptamers.
Introduction
To develop simplified and direct affinity measurement methods, others have recently reported the dissociation constant measurement of aptamers by surface plasmon resonance (Wang et al., 2007) and kinetic capillary electrophoresis (Yunusov et al., 2009) analysis. Although both methods can monitor the aptamer–protein binding affinity in real-time with a simplified and direct procedure, the low throughput of these methods is a considerable disadvantage for screening large number of candidate aptamers.
Previously, a sol-gel–based protein array was developed for protein–protein or antigen–antibody interaction assays. A comparison with the 2-dimensional microarray system showed that sol-gel can immobilize proteins with a broad range up to milligram level with high activity (Kim et al., 2006; Kwon et al., 2008). Therefore, the sol-gel–integrated protein microarray appears to be ideal for measuring affinity, because sol-gel can house proteins with different concentration ranges. In addition, the same protein arrays produced can be used for high-throughput measurements of a large number of aptamers screened.
In this study, this sol-gel material was used to immobilize the target protein, TATA-binding protein (TBP), and RNA aptamers (TBPapt 12, 15, 16, 18, 24, and 26) that were selected from a previous study (Kim et al., 2006; Lee et al., 2007; Park et al., 2009). As the 3-dimensional nanoporous structure of the sol-gel droplets can allow rapid diffusion, the introduced aptamers can interact with the immobilized TBPs within a few seconds, because labeled aptamers travel along the network of channels (Kim et al., 2006; Lee et al., 2007; Park et al., 2009). Therefore, it is expected that the binding affinity can be deduced from the aptamer–protein interaction results under conditions in which different amounts of protein are immobilized in the microarray (see Supplementary Fig. S1; Supplementary Data are available online at www.liebertonline.com/nat). This system allows quantitative binding measurements of the aptamer–target interactions in a high-throughput manner and can be potentially applied to automatic processes as a part of the SELEX lab-on-a-chip system.
Materials and Methods
Protein preparation
The yeast TBP (yTBP) expression system was a generous gift from John T. Lis (Cornell University, Ithaca) (Fan et al., 2004; Shi et al., 2007). The His-tagged recombinant full-length 6 × His-tagged yTBP proteins (∼25 kDa) were purified from BL21-DE3 cells using a Ni-charged affinity resin and minicolumn (Qiagen).
RNA aptamer synthesis
The selected individual aptamers against TBP were transcribed using a MEGAshortscript kit (Ambion). Briefly, after polymerase chain reaction amplifying the aptamer template construct, 1 μg of the amplified DNA templates was transcribed in vitro to RNA according to the manufacturer's protocol. After transcription, the RNA aptamer transcripts were purified after the DNase treatment for 20 minutes at 37°C.
End labeling of RNA aptamer
The RNA aptamer was incubated for 4 hours at 37°C with 100 μM Cy3-dUTP (E-biogen), 50 μM terminal deoxynucleotidyl transferase (TdT) (Fermentas), 1 × TdT buffer [200 mM potassium cacodylate, 25 mM Tris/HCl (pH 6.6), 4 μM bovine serum albumin, and 5 mM CoCl2], 0.5 mM deoxynucleotide triphosphate, and 10 unit RNase inhibitor (Roche). The reaction was quenched by adding ethylenediaminetetraacetic acid. The labeled RNA was extracted using a phenol/chloroform/isoamylalchol treatment and recovered by ethanol precipitation in the presence of 0.3 M sodium acetate.
Microarray preparation
Sol-gel materials were used to immobilize the proteins according to the manufacturer's recommendations (SolB complete kit; PCL, Inc.; www.pclchip.com). In detail, using the sol-gel formulation (SolB I 25%, SolB II 7.5%, SolB III 5%, SolB H 12.5%, and SolB S 12.5%), the 5 different concentrations of TBP described in Fig. 1 were mixed with the SolB reagents and arrayed with the controls (R: reference control with Cy-3 dUTP) using a noncontact microdispensing instrument [SolB Desktop Arrayer (PCL, Inc.); sciFLEXARRAYER (Scienion)] under high-humidity conditions (∼60%, 20°C). Arraying was performed in 8-mm-diameter wells of a 96-well plate and cured for 16 hours to allow gelation according to the manufacturer's recommendation. The final arrayed sol-gel microdroplet volume was calculated using autodrop volume detection software (Scienion). The morphology of the sol-gel spot was observed by optical microscopy (KH-770; HIROX Company).

Affinity measurement assay
After cleaning and blocking the wells (5% skim milk), 4 μM of each Cy-3–labeled RNA aptamers was incubated in 1 × binding buffer [12 mM 4-(2-hydroxyethyl)-1-piperazineethanesulfonic acid (HEPES) (pH 7.9), 150–200 mM NaCl, 1–10 mM MgCl2, and 1 mM dithiothreitol (DTT)] for 1 hour in each well and washed 3 times for 15 minutes with washing buffer (1 × binding buffer with 0.2% Tween 20). The resulting plate chip well was scanned and analyzed using a 96-well fluorescence scanner and the appropriate software program (FLA-5100 and multigauge; Fuji). The background intensity was subtracted from the signal intensity of each spot (LAU/mm2).
Results and Discussion
For the aptamer binding affinity test, 5 different TBP concentrations (from 0 to 800 nM) were used to measure the Kd of the aptamers. The TBP-containing sol-gel mixture was prepared and 8 duplicate TBP-containing sol-gels were arrayed along with the 2 negative controls (without protein) and 2 reference controls (R; reference positioning, with Cy-3–labeled antibody) within the 8-mm-diameter wells of 96-well microtiter plates using a noncontact piezoelectric liquid dispenser, as described in the Materials and Methods section (Fig. 1A). The 3-dimensional nanostructured composite prepared by the sol
The selected aptamers (TBPapt 12, 15, 16, 18, 24, and 26; Table 1) were transcribed and labeled at the C-terminus with Cy-3 dUTP as described in the Materials and Methods section. Each Cy-3–labeled aptamer in the binding buffer was added to the individual TBP arrayed well after soaking and blocking of the wells and incubated for 1 hour at room temperature. After washing 3 times with a washing buffer, the resulting plate chip well was scanned and analyzed using a 96-well fluorescence scanner and the appropriate software program, as described in the Materials and Methods section (Fig. 1A, binding assay feature). The background intensity was subtracted from the signal intensity of each microdroplet.
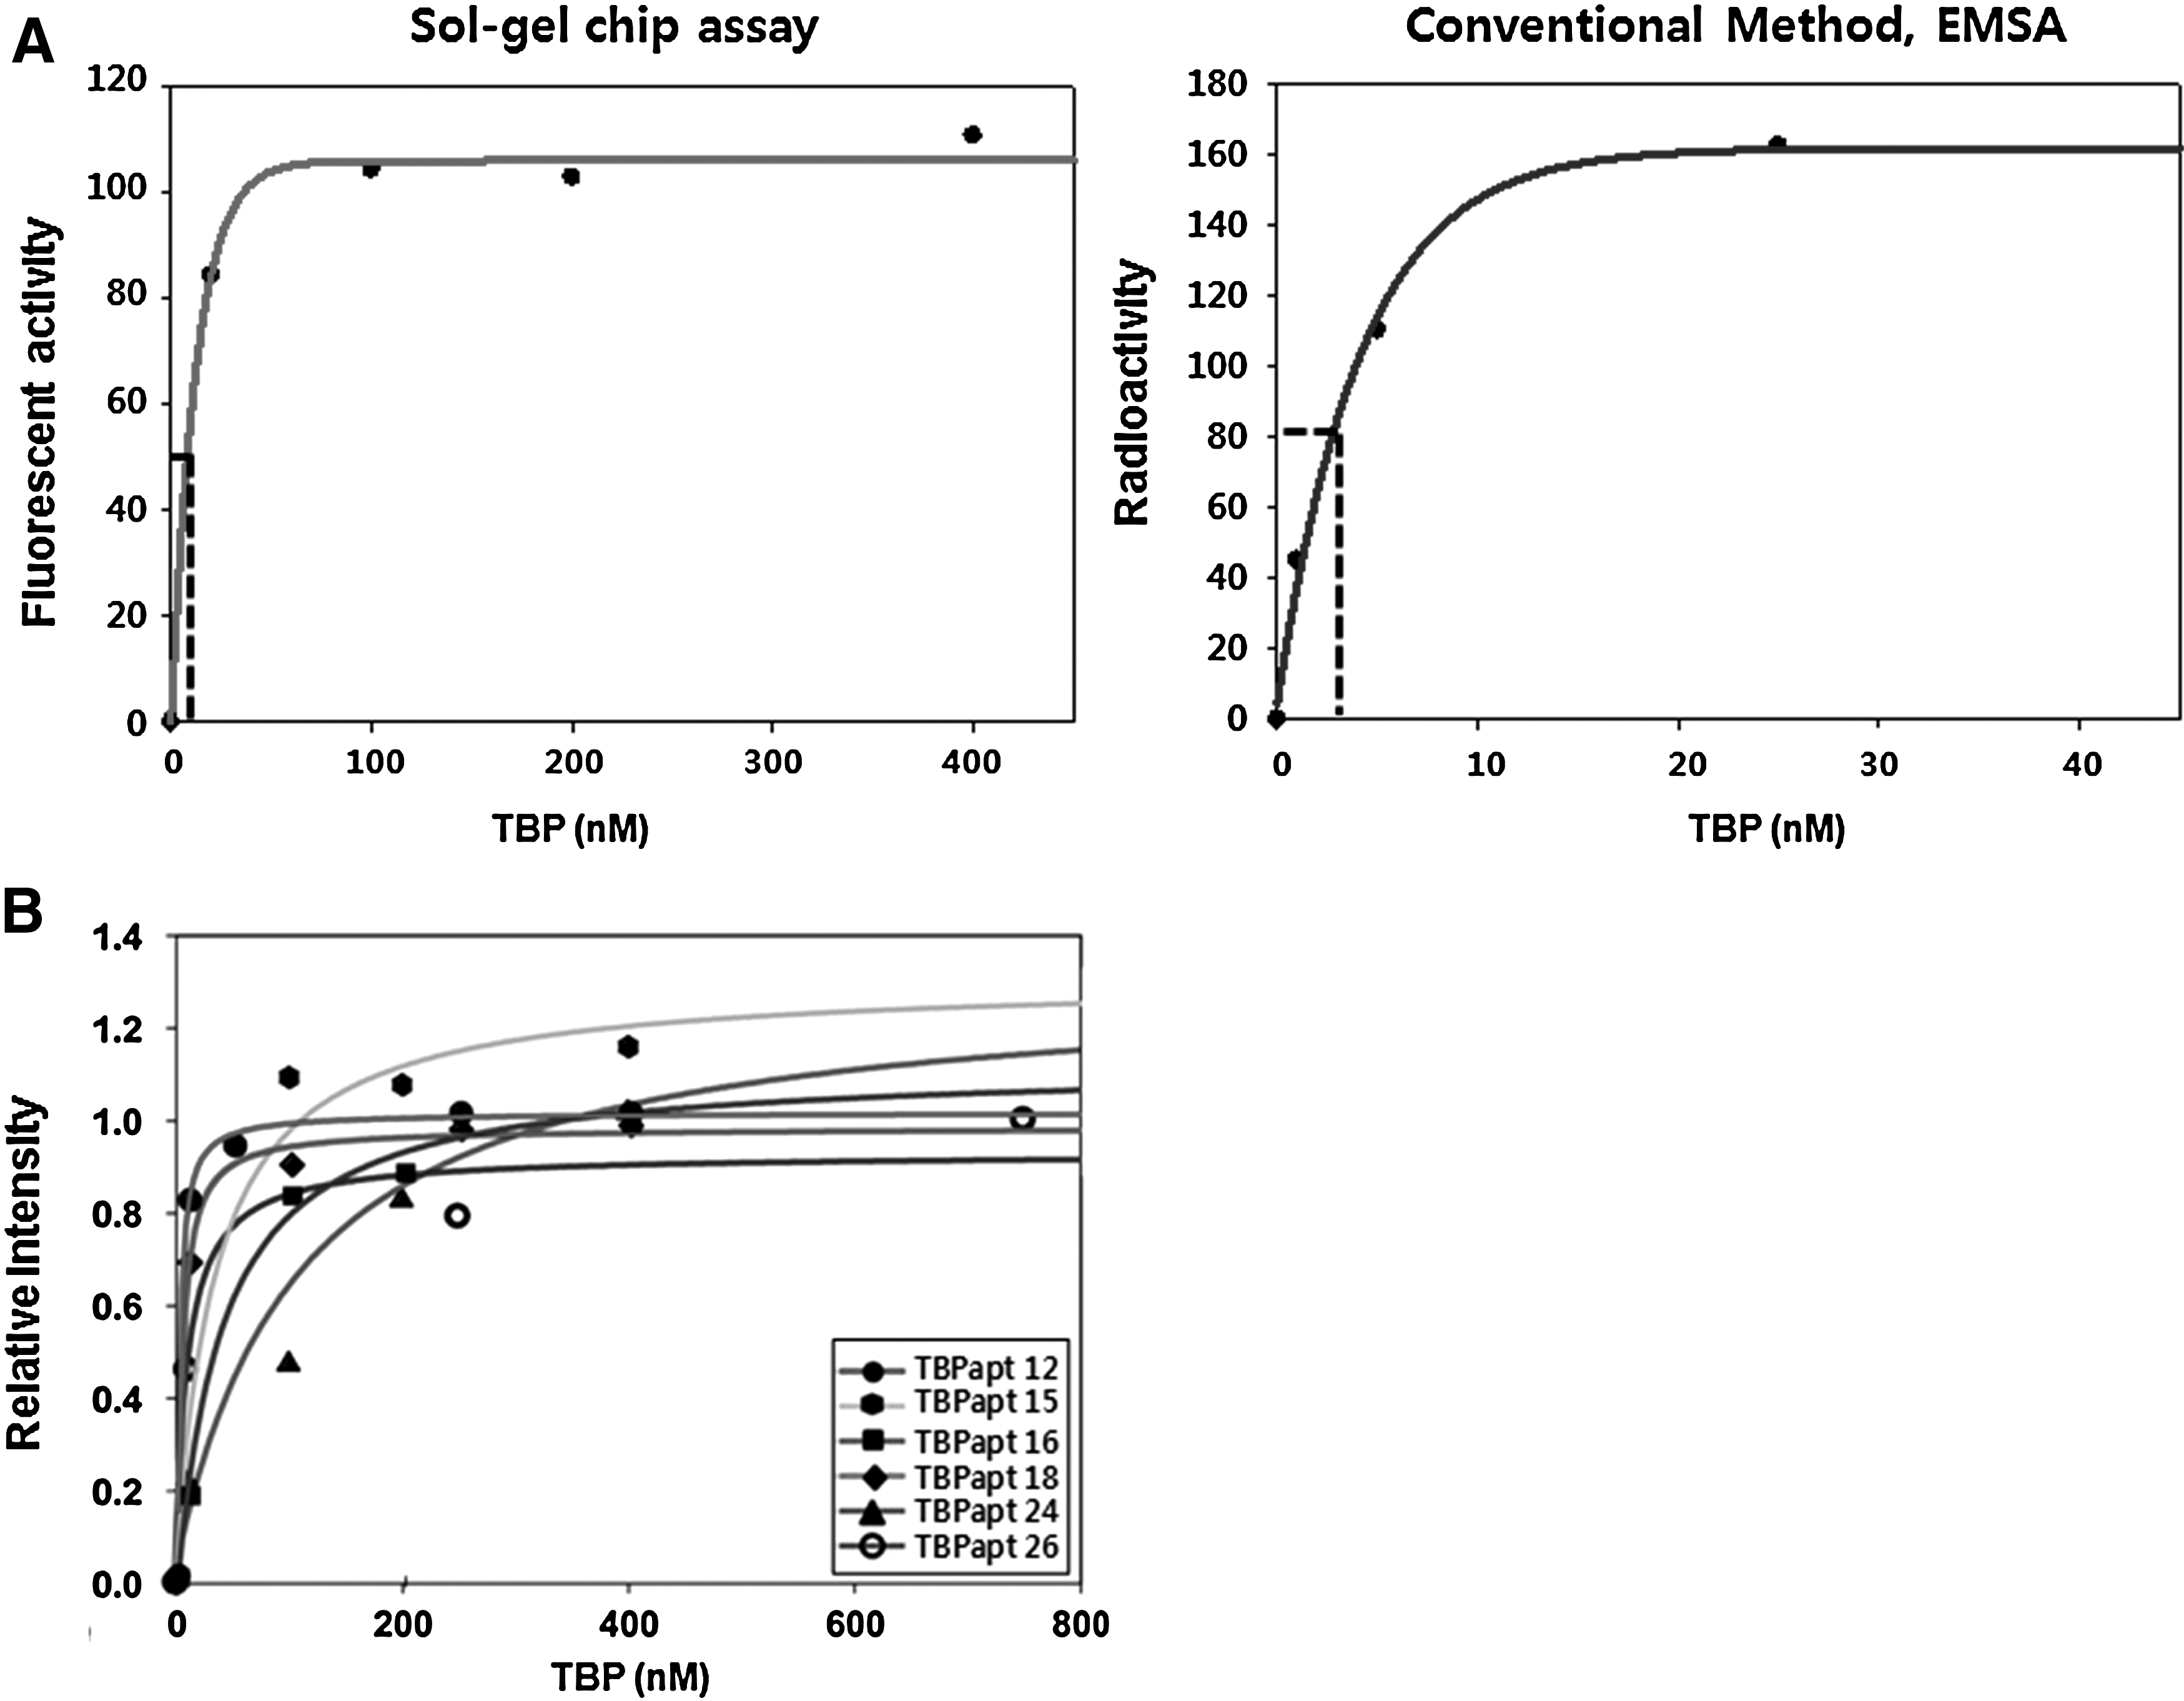
Each aptamer sequence is flanked by 2 constant regions that use a reverse transcription and amplification step in the Systematic Evolution of Ligands by Exponential Enrichment process. The affinities (Kd) were measured in duplicate based on sol-gel–integrated protein chip assay and the average values are plotted, as shown in Fig. 2B.
The dissociation constants (Kd) were calculated by plotting the fluorescent intensity of the bound aptamers as a function of the TBP concentration, and the specific binding data were then fitted to the following nonlinear regression equation (Xu et al., 1996) using Sigmaplot 10.0 software:
where y is the total binding (fluorescent intensity in sol-gel), Bmax is the maximum fluorescent binding activity, and Kd is the dissociation constant.
As shown in Fig. 2 and Table 1, the dissociation constants (Kd) of all aptamers were in the nanomolar range, with TBPapt 12 showing the highest affinity (Kd ∼2.7 nM). In the case of TBPapt 16, the binding affinity previously measured by EMSA ranged from 3 to 10 nM (Fan et al., 2004), and the sol-gel–integrated assay showed a binding affinity of ∼8 nM Kd (Fig. 2A). This suggests that the sol-gel–based binding affinity measurements fit well with conventional binding affinity measurements, suggesting their possible use as an alternative to the conventional method.
Binding affinity of the aptamers to TBP.
Aptamer candidates isolated from SELEX show affinity and specificity over a wide range against the applied target. The target binding affinity and functional activity of individual members should be characterized and aptamers with the highest affinity can be used as capturing ligands in molecular imaging, drug discovery, or biosensor studies. The sol-gel–integrated protein chip system in the present study allows easy measurement of the binding affinities of several tens of aptamer candidates isolated using the SELEX process simultaneously. The approach described herein can be also used to set up an automatic workstation because of the mechanical operability from the start (sol-gel spotting) to finish (affinity analysis) of the overall procedure. Therefore, a highly integrated automatic system can be extended further to realize high-throughput aptamer affinity analysis against a large number of proteins simultaneously.
Footnotes
Acknowledgments
The authors acknowledge funding from National Research Laboratory from National Research Foundation and Ministry of Knowledge, Economy, and Industrial Technology Development (10032113–2010-13). J.-Y. A. acknowledges the support of the National Research Foundation (Grant No. KRF-2008-532-D00003/2009-353-D00004). This work was partially supported by R&D Program of MKE/KEIT (10035501).
Author Disclosure Statement
No competing financial interests exist.
References
Supplementary Material
Please find the following supplemental material available below.
For Open Access articles published under a Creative Commons License, all supplemental material carries the same license as the article it is associated with.
For non-Open Access articles published, all supplemental material carries a non-exclusive license, and permission requests for re-use of supplemental material or any part of supplemental material shall be sent directly to the copyright owner as specified in the copyright notice associated with the article.