
Abstract
N6-Isopentenyladenosine (iPA), a member of the cytokinin family of plant hormones, exerts remarkable inhibition on tumor cell proliferation and apoptosis in several tumor cell lines. In this study, we report that iPA is able to inhibit the proliferation and promotes apoptosis in HCT-15 human colon cancer cells in a dose-dependent manner with a concentration of 2.5 μM, which causes 50% inhibition of cell viability. The cell cycle analysis by flow cytometry showed that iPA-induced growth arrest could be associated to apoptosis. Moreover, suppression of clonogenic activity occurs after exposure to iPA at a concentration of 2.5 μM for HCT-15.
Introduction
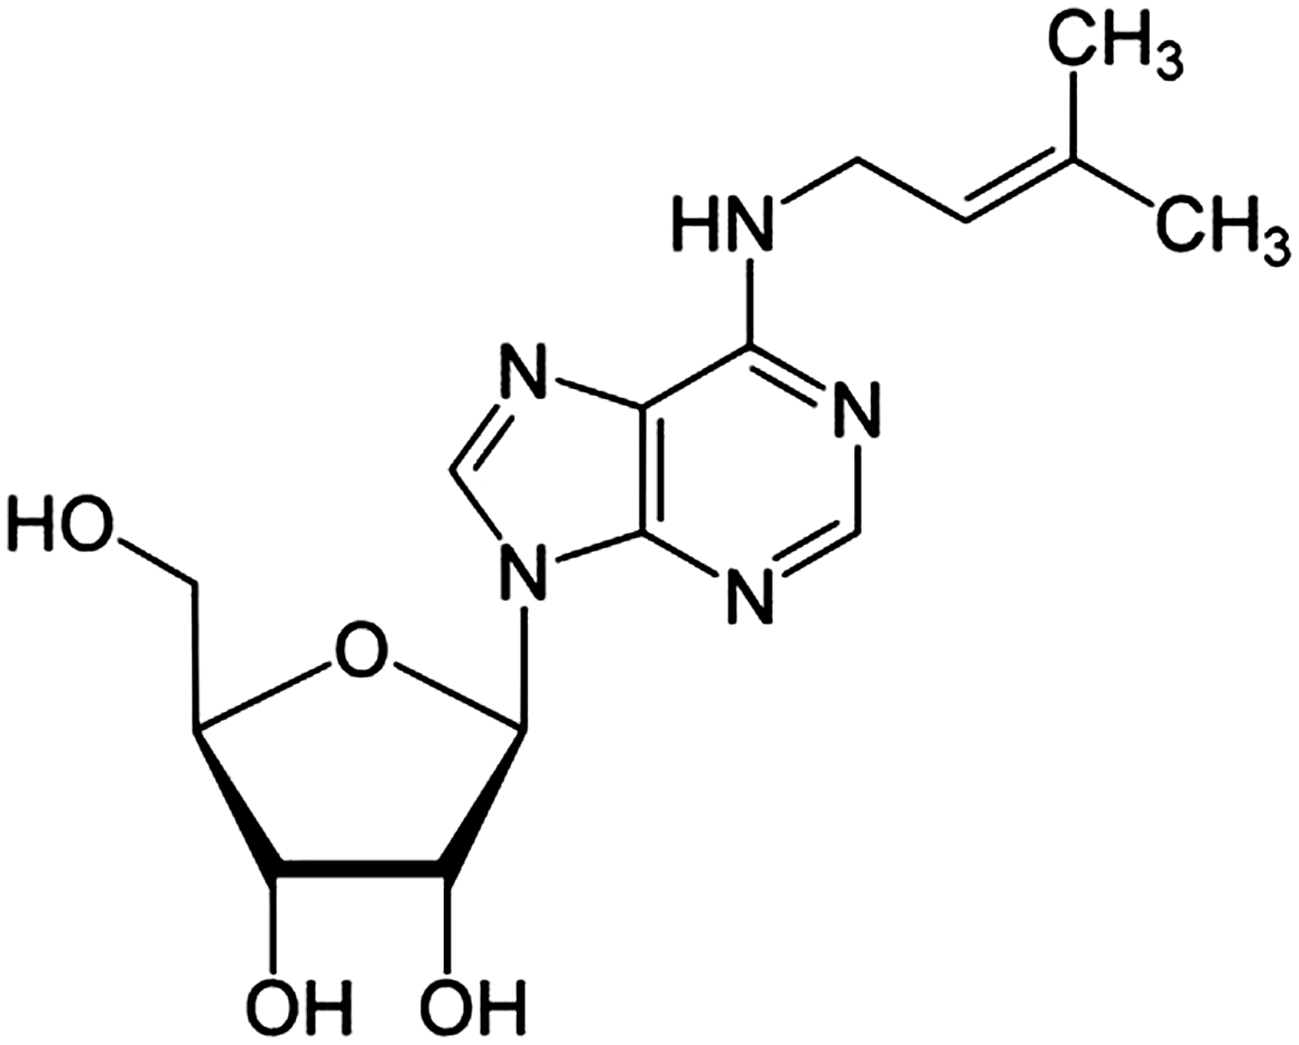
Structure of N6-isopentenyladenosine (iPA).
Many biological effects, both in plants and animal systems, also including antitumor effects on human and murine cells can be attributed to iPA. Recently, we demonstrated that iPA inhibits the growth of MCF-7 breast cancer cells in a dose-dependent manner with interference on cell cycle, which showed that iPA-induced growth arrest could be associated to apoptosis (Rajabi et al., 2010). iPA has been reported to induce differentiation of human leukemia cells (Ishii et al., 2002), to inhibit proliferation of a Kras- transformed rat thyroid cell line (Laezza et al., 2006) and to exert anti-leukemic activity against a mouse leukemia cell line (Chang and Hacker, 1982). Laezza et al. (1997) demonstrated that iPA influenced cAMP-dependent organization of the microfilaments in a thyroid cell line (FRTL-5 cells) by decreasing cAMP levels, subsequently by inhibiting DNA synthesis. Spinola et al. (2007) have shown that iPA exerts potent in vitro antitumor activity on human epithelial cancer cells. This inhibition of cell growth is paralleled by the upregulation of genes involved in arresting cell cycle, as demonstrated by gene expression profile of iPA-treated cancer cells (Colombo et al., 2009). It has been also described that the iPA apoptotic effects on a human carcinoma colon cancer cell line DLD was mediated by a sustained phosphorylation and activation of c-Jun N-terminal kinase (JNK) that caused, in turn, an increase of c-Jun phosphorylation (Laezza et al., 2009). The above controversial observations on the apoptotic mechanism of iPA led us to continue our studies on iPA activity. We present in this report our results on the dose-dependent cell cycle arrest and apoptogenic effect of iPA on HCT-15 colon cancer cell line.
Materials and Methods
Reagent
Trypsin, trypan blue, antibiotic and antimycotic agent, fetal bovine serum (FBS), sulforhodamine B (SRB), and dimethyl sulfoxide (DMSO) were purchased from Sigma Chemical Co. Chemicals and solvents for iPA synthesis were from Sigma-Aldrich Italia. Sterile flasks of 25 and 75 cm2, sterile and lidded polypropylene culture tubes, sterile microplates with 24 and 96 wells, and sterile cryo-tubes were obtained from SPL Life Science Co.
Chemical synthesis of iPA
iPA was prepared following the methods described by Robins (Robins et al., 1967). Briefly, reaction of adenosine with isopentenyl bromide affords iPA in 40%–50% overall yield. An alternative procedure required more expensive compounds such as 6-chloropurine riboside and isopentenylamine, but pure iPA can be prepared in 82%–85% yield.
Cell line and culture
Human colon cancer cell line HCT-15 was supplied from the American Type Cell Culture Collection and maintained in the standard medium and grown as a monolayer in Dulbecco's modified Eagle's medium (DMEM) containing 10% FBS, 2 mM glutamine, 100 U/mL penicillin, and 100 g/mL streptomycin. Cultures were maintained at 37°C with 5% CO2 in a humidified atmosphere and were passaged weekly using 0.25% trypsin.
In vitro evaluation of cytotoxic activity
Cell viability or growth activity of iPA in vitro was evaluated by the SRB assay (Rajabi et al., 2010). iPA stock solutions (10 mM in DMSO) were prepared and stored at 4°C and were diluted with DMEM to 0.1–1 mM range at room temperature before experiment. The final percentage of DMSO in the reaction mixture was less than 1% (v/v). Cancer cells (2×10³ cells/well) were plated in 5 multiple in the 96-well plates and incubated in medium for 24 hours. Serial dilutions of individual compounds were added. The microtiter plates were incubated at 37°C, 5% CO2, 95% air, and 100% relative humidity for 72 hours before addition of iPA. The assay was terminated by the addition of 50 μL of cold trichloroacetic acid (final concentration, 10% trichloroacetic acid postal) and incubated for 60 minutes at 4°C. The plates were washed 5 times with tap water and air-dried. SRB solution (50 μL) at 0.4% (w/v) in 1% acetic acid was added to each of the wells, and plates were incubated for 30 minutes at room temperature. The residual dye was removed by washing 5 times with 1% acetic acid. The plates were air-dried or under hood. Bound stain was subsequently eluted with 10 mM trizma base, and the absorbance was read on an ELISA plate reader at a wavelength of 540 nm and used as a relative measure of viable cell number. The percentage of growth inhibition was calculated by using the equation: percentage growth inhibition (1−At/Ac)×100, where At and Ac represent the absorbance in treated and control cultures, respectively. IC50 was determined by interpolation from dose–response curves.
Evaluation of cell morphology
HCT-15 cells plated at about 20,000 cells/well on chamber-slides (8 wells) were treated with 0, 1, 5, and 10 μM of iPA for 72 hours. After rinsing in phosphate-buffered saline (PBS), cells were fixed in methanol 100% and photographed using a Nikon camera attached to the microscope.
Cell cycle analysis
Apoptosis and cell cycle profile were assessed by flow cytometry. HCT-15 cells were plated at a density of 5×10⁵ cells/well on 6-well plates. Treated cells with iPA at concentration of 5 μM for 72 hours were harvested, rinsed in PBS, suspended in 600 μL of PBS containing 1% FBS, fixed by 1.4 mL 80% ethanol, and stored at −20°C in fixation buffer. Then, the pellets were suspended in 1 mL of fluorochromic solution [0.08 mg/mL propidium iodide (PI) in 1×PBS] at room temperature in the dark for 60 minutes. The DNA content was analyzed by FACScan flow cytometer (Beckman Counter, cytomics FC 500) and CellQuest software (Becton Dickinson). The population of apoptotic nuclei (subdiploid DNA peak in the DNA fluorescence histogram) was expressed as the percentage in the entire population.
Clonogenic assays
HCT-15 cells were plated at a density of 700 cells/well in 12-well plates and treated with 0, 1, 2.5, 5, 10, and 50 μM for 14 days. Plates were rinsed in PBS and colonies were methanol-fixed and stained with 10% Giemsa and were counted under a light microscope.
Results
Cytotoxic evaluation in vitro and cell shape study
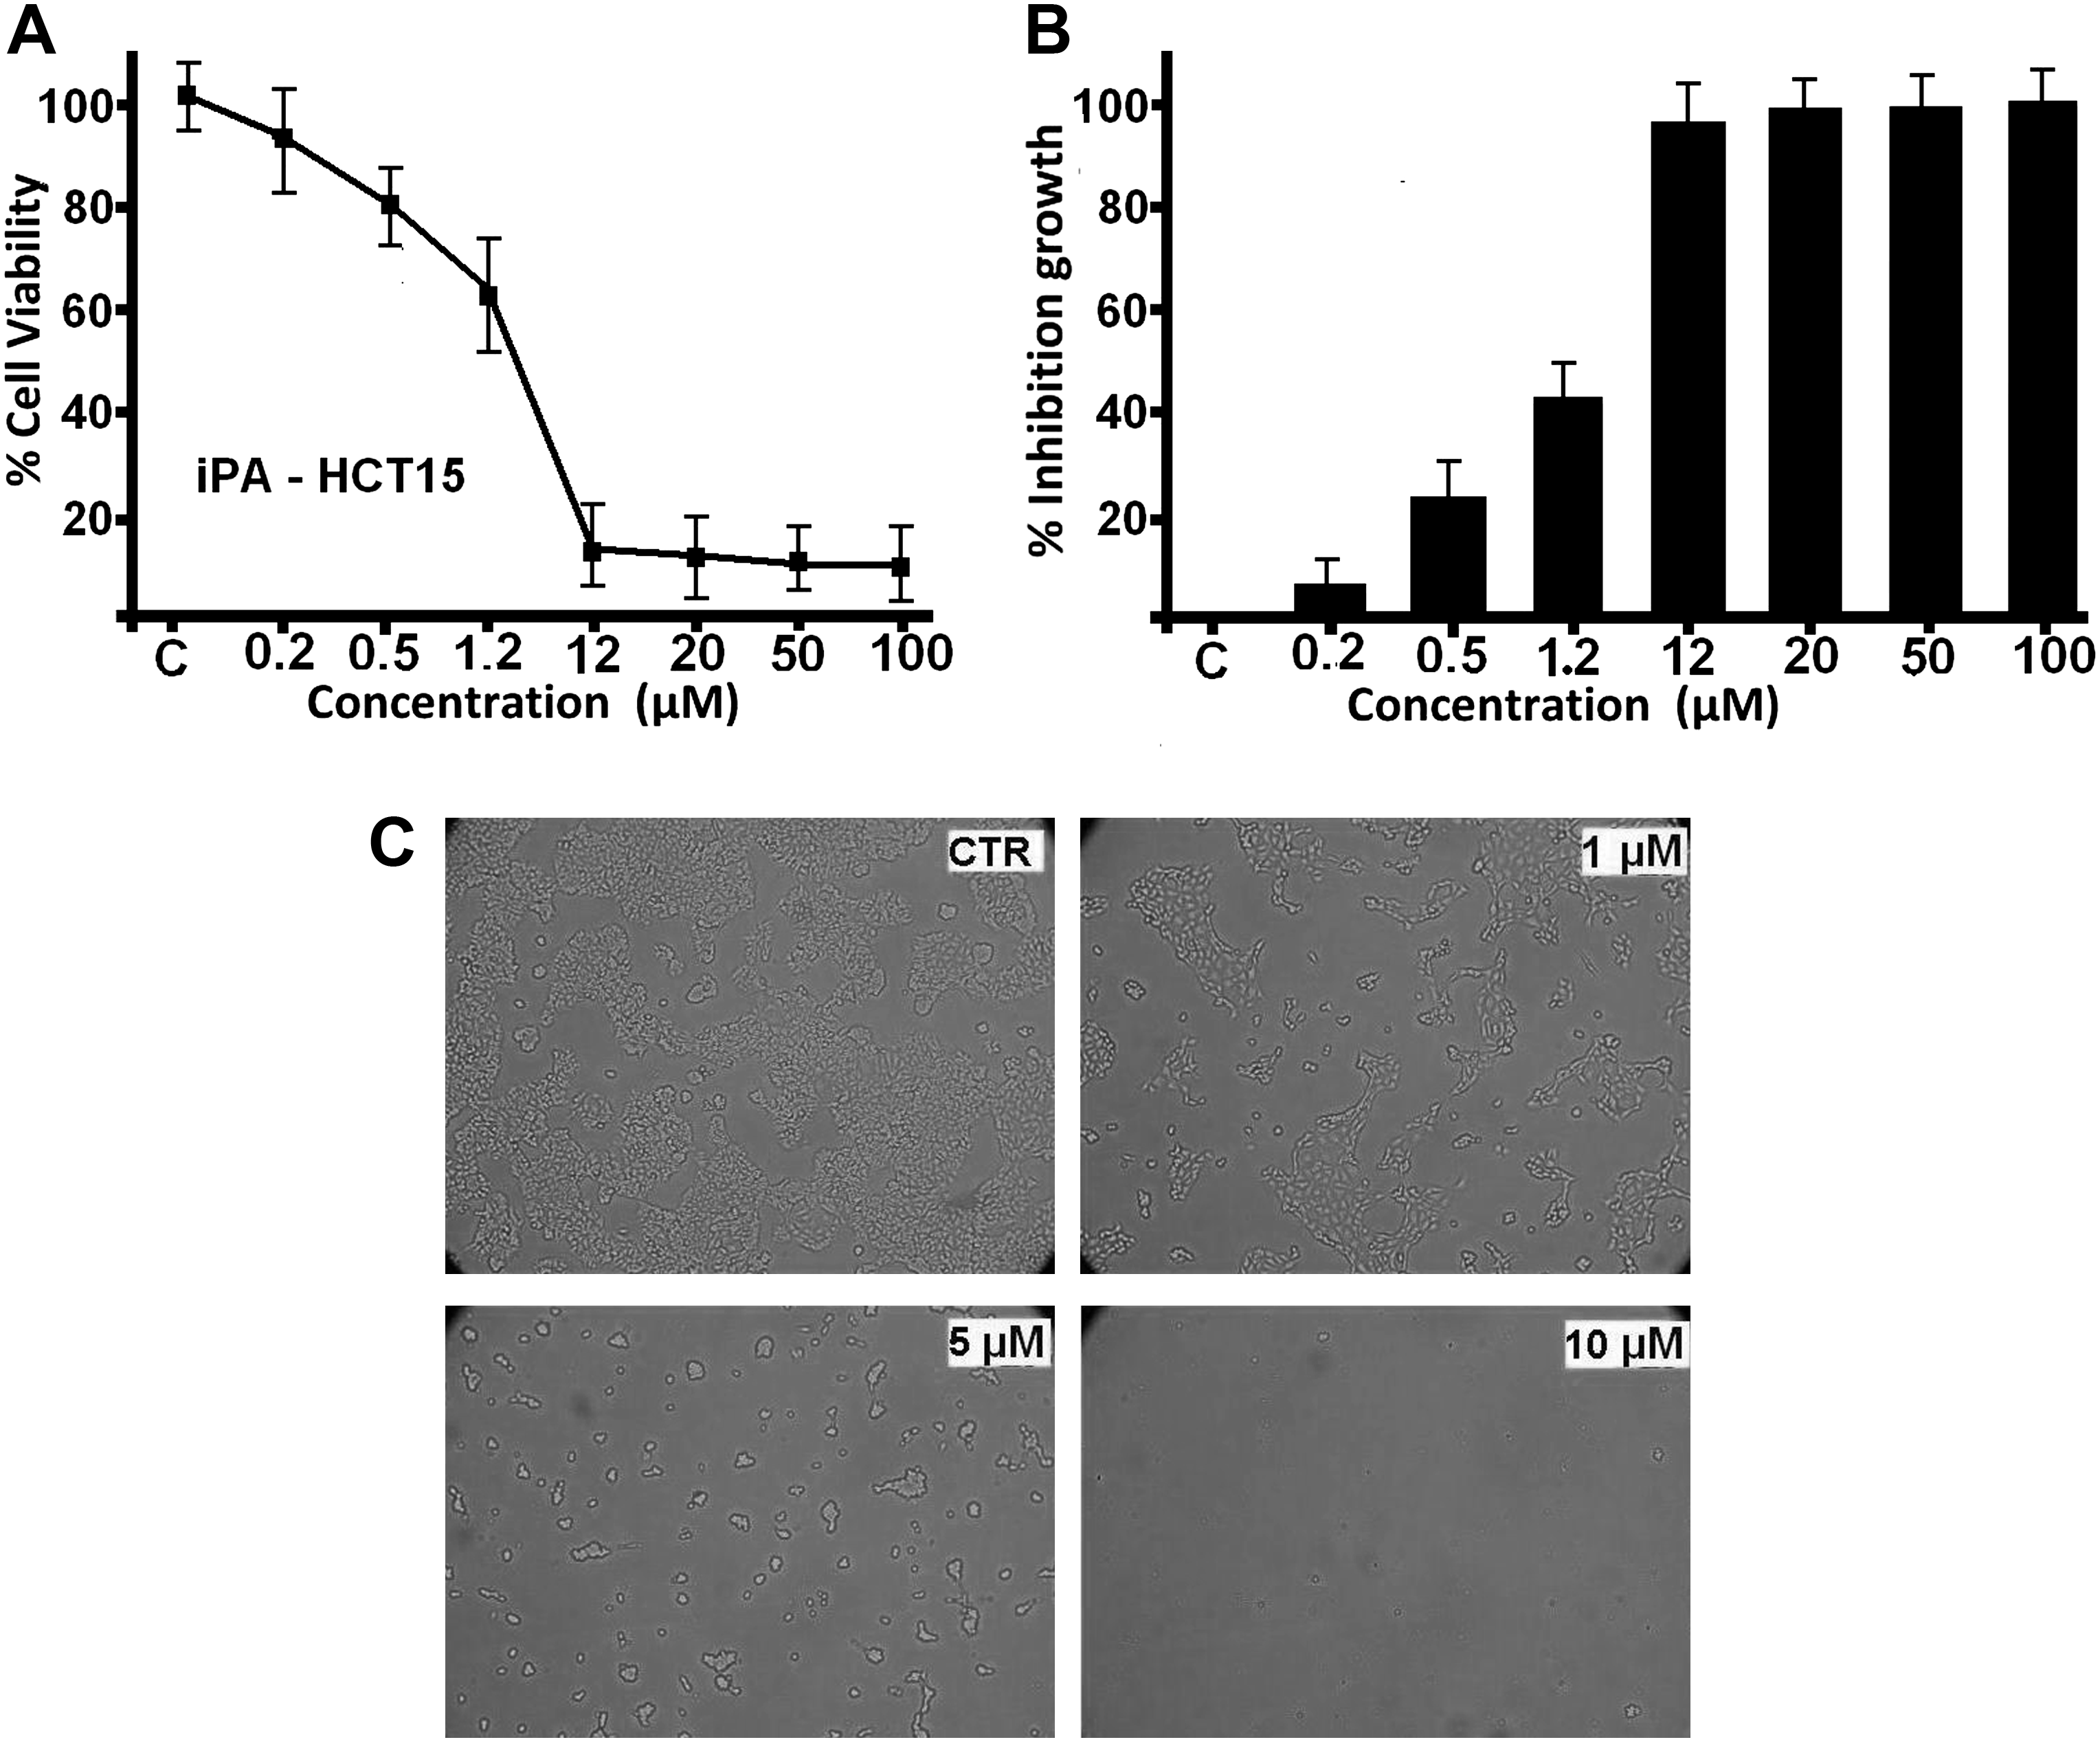
In the presence of different doses of iPA, the cells were inhibited ranging from 10% to 90% with a loss of viable cells (Fig. 2A). iPA inhibited the proliferation of HCT-15 cells in a concentration- and time-dependent manner. The viability of the HCT-15 cells was almost unaffected by less than 0.2 μM of iPA treatment for 72 hours, but changed to 80%, in response to 0.5 μM of iPA, respectively. However, viability decreased to 50% in response to 2.5 μM iPA and continued to decrease as the concentration of iPA was increased, and was 10% with 10 μM and 5% with 20 μM iPA exposure. Thus, it was evident that iPA was almost noncytotoxic in vitro up to a dose of 0.2 μM. By employing the SRB assay, 50% inhibition of cell viability (IC50) by iPA was established at a 2.5 μM concentration at 72 hours of treatment (Fig. 2B). Cell shape and morphology of treated and untreated (control) cells were viewed using an inverted phase-contrast microscope. Figure 2C shows the incubation of the cells with different iPA concentrations and 72 hours of treatment. Control group showed regular polygonal shape and cell antennas were short. The cell morphology of treated cells was affected by iPA treatment and loss of adhesion, rounding, cell shrinkage, and detachment from the substratum was evident (Fig. 2C).
Apoptosis and cell cycle analysis
To study the mechanism of the antiproliferative activity by iPA in more details, we analyzed the effects of iPA treatment on cell cycle distributions of HCT-15 cells. Cells were treated with various concentration of iPA for 72 hours and subjected to FACS analysis after PI staining of the chromosomal DNA. In histograms of FACS analysis, untreated proliferative HCT-15 cells showed cell cycle distributions of 69% in G1/G0, 9% in S, 14% in G2/M, and 8% in sub G1/G0 phase. At concentration of 5 μM iPA leads to an increase in the percentage of cells in G2/M and in sub G1/G0 phases. At the same iPA concentration, populations reached 24% for G2/M and 19% for sub G1/G0 phase (Fig. 3A, B) and did not change the duration of the cell cycle in S and G0/G1 phases. These data indicate that iPA could arrest HCT-15 cell growth in G2/M phase inducing apoptisis.
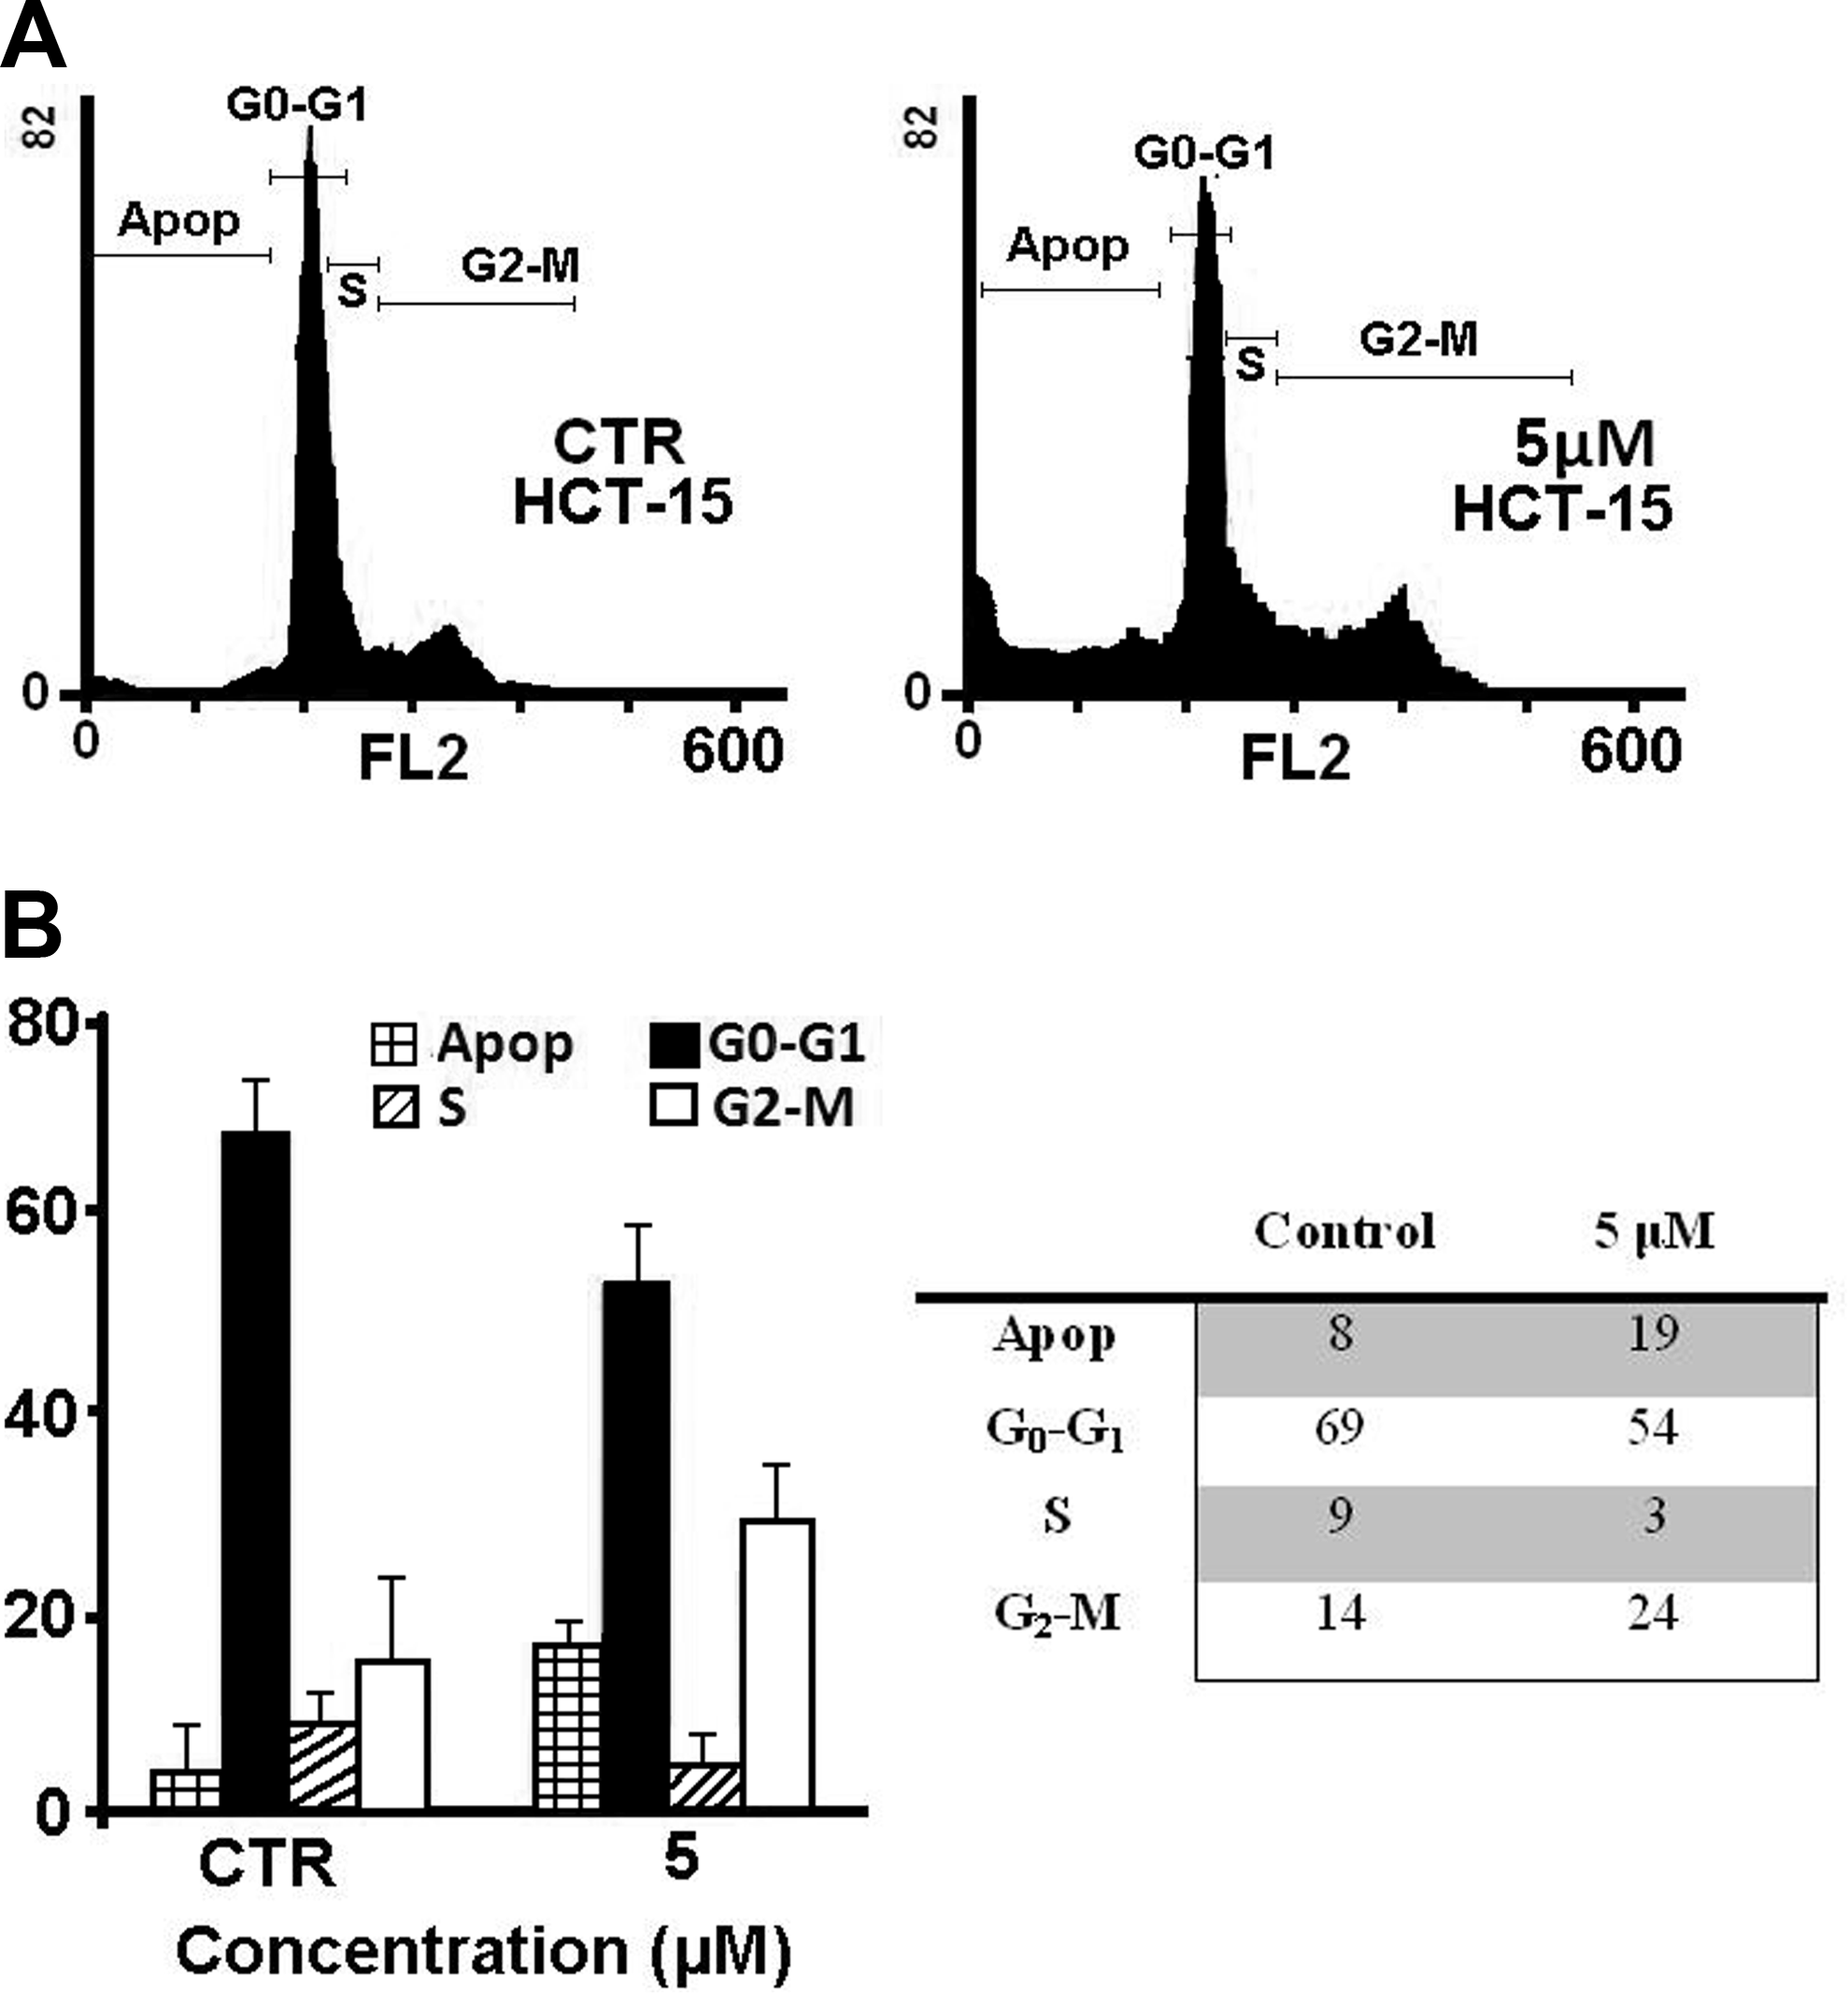
Flow cytometric analysis of HCT-15 cells. Values are expressed as percentage of the cell population in the G0-G1, S, and G2/M phase of cell cycle
Clonogenic assays
Analysis of clonogenic activity in HCT-15 cells treated with iPA at concentrations ranging from 1 to 50 μM of iPA for 14 days revealed a complete inhibition of colony formation at 50 μM for HCT-15 colon cells, whereas concentrations lower than 1 μM were almost ineffective (Fig. 4). Linear regression analysis indicated a highly significant association between colony number and concentration of iPA treatments.
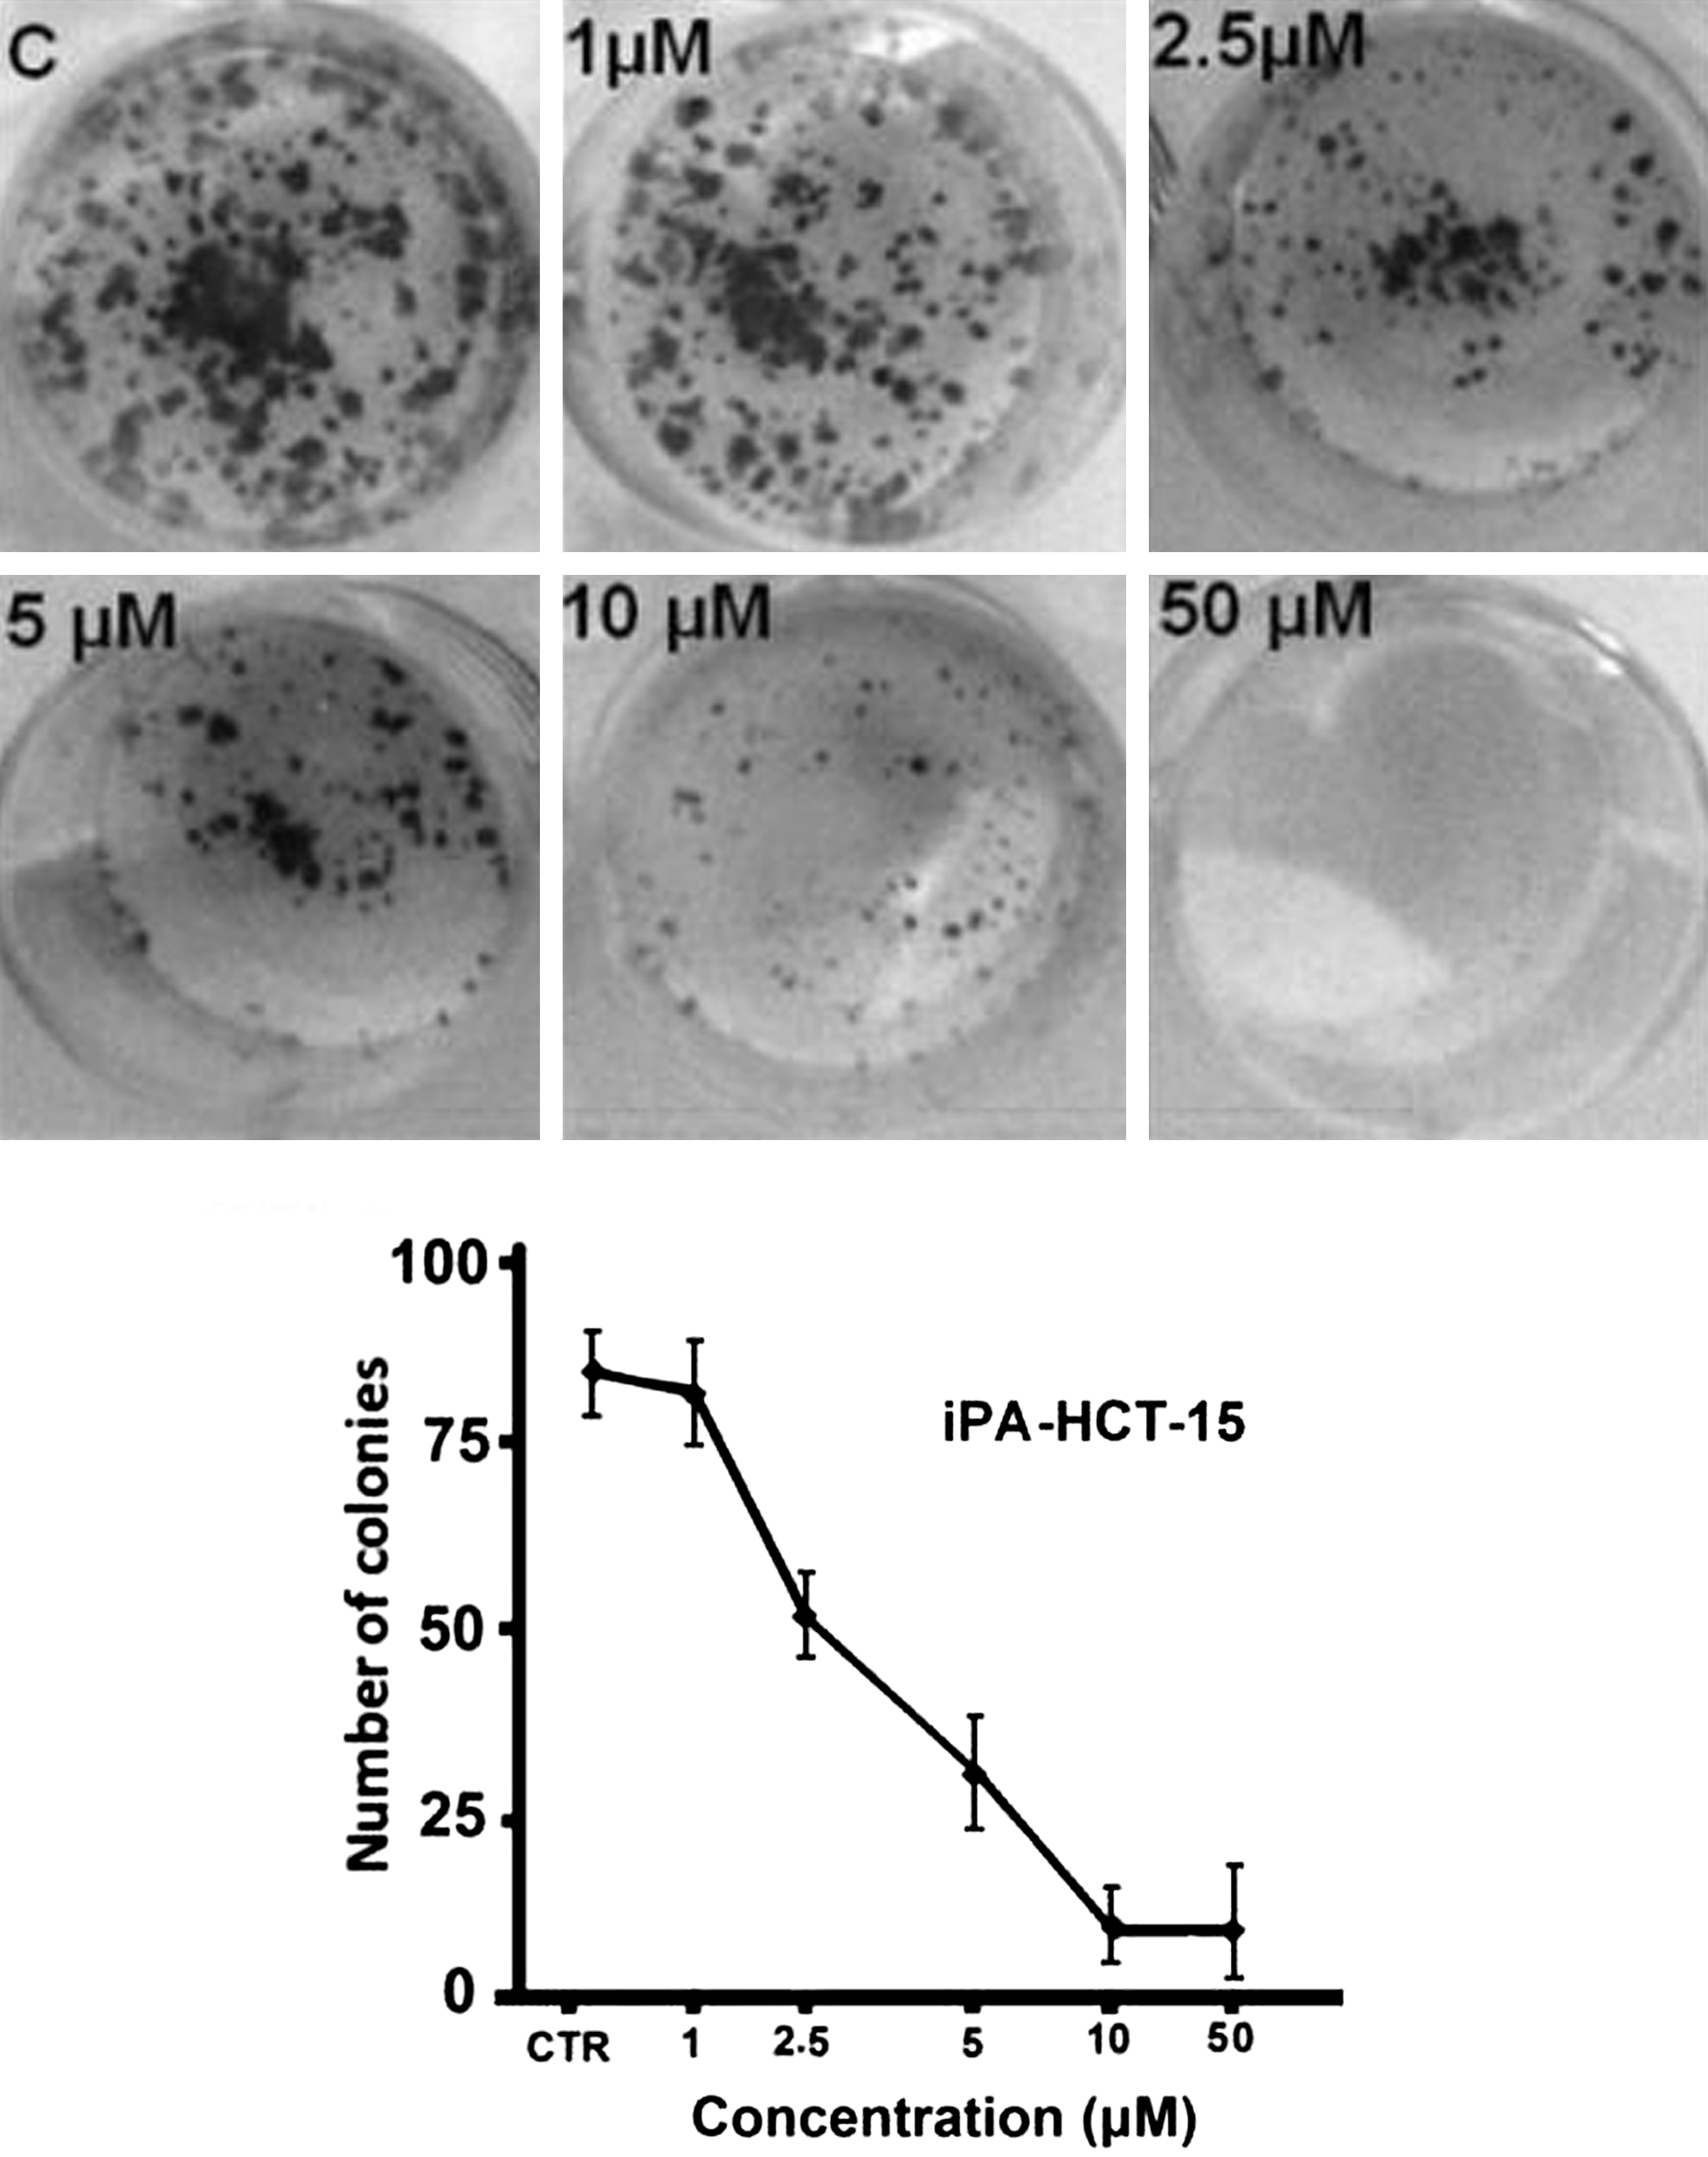
Dose–response curve of iPA-mediated inhibition of HCT-15 cell colony formation. Seven hundred cells were plated in 12-well plates, treated with various dose levels of iPA, and stained after 14 days of treatment, and colonies were counted by microscopy.
Discussion and Conclusion
Recently, N6-isopentenyladenosine (iPA) has been shown to act by inhibiting DNA synthesis, causing a cell cycle arrest that correlates with a decrease in the levels of cyclin E, cyclin A, and cyclin D1 and with a concomitant increase in the levels of cyclin-dependent kinase inhibitor and p27kip1 Moreover, iPA induces apoptosis through the downregulation of antiapoptotic products and caspase-3 activation. In the present study, our results show that the cytotoxic effect of iPA on human colon cancer HCT-15 cells is dose dependent with an IC50 value of 2.5 μM at 72 hours of treatment. This causes apoptotic morphological changes in cells such as loss of adhesion, rounding, cell shrinkage, and detachment from the substratum. The cell cycle analysis by flow cytometry showed that there was a increase in the amount of sub-G1/G0 and G2-M phase by iPA treatment, which indicates that iPA could arrest HCT-15 cell growth in G2/M phase inducing apoptisis. This increase of hypoploid DNA is an indication of the inhibition of cell growth through a mechanism of apoptosis that has been suggested also for other cell lines (Laezza et al., 2009; Rajabi et al., 2010). Moreover, suppression of clonogenic activity occurs after exposure to iPA at a concentration of 2.5 μM for HCT-15.
Footnotes
Acknowledgments
Dr. Mehdi Rajabi greatly appreciates the financial support from the Molecular Medicine Ph.D. program at University of Milan and also thanks professor Riccardo Ghidoni for allowing him to use his lab facilities.
Author Disclosure Statement
No competing financial interests exist.