




Abstract
With ongoing efforts to develop oligonucleotide-based (ODN-based) therapeutics, there is a need for a sensitive, high-throughput method of quantification of ODN-based drugs in biological matrices. To overcome the insufficient sensitivity and time-consuming sample extraction procedures involved in conventional capillary gel electrophoresis (CGE) and high-performance liquid chromatography (HPLC), we developed a nucleic acid hybridization-based enzyme-linked bridging assay (ELBA), which shows significant advantages over CGE methods in evaluating ODN-based drugs in plasma and tissue: (1) It has higher sensitivity; (2) it involves easier sample extraction procedures; (3) it is suitable for many ODN-based drugs, even those with different secondary structures and modifications, including phosphorothioate oligonucleotide (PSODN), mixed backbones with 2′-O-Me (MBO), locked nucleic acid (LNA) modifications, and B- and C-type CpG sequences; and (4) it is highly selective, even during simultaneous quantification, with regard to intact ODNs and their 3′-metabolites. This universal design produces a rapid, sensitive, specific assay with minimal method development time. It is well suited to high-throughput analysis of various ODN-based drugs.
Introduction
Alhough a variety of nonradioactive bioanalytical methods have been developed and used to quantify ASODNs and their metabolites, quantitatively analyzing antisense drugs in biological matrices is still challenging. To date, capillary gel electrophoresis (CGE) and high-performance liquid chromatography (HPLC) have become standard tools for PK evaluation. Unfortunately, the insufficient sensitivity and extensive sample preparation required by these methods have limited their applications (Yu et al., 2001; Zhang et al., 2005). Typical plasma and urine sample cleanup procedures for CGE analysis usually involve two-step solid-phase extraction (SPE) followed by additional desalting via dialysis. Sample preparation from tissue and cellular fractions normally requires liquid/liquid extraction and additional cleanup with SPE (Palm et al., 2004; Wu et al., 2009). Therefore, more attention has been paid to the simplification of sample preparation than to other parts of the process. For example, the one-step C18 SPE method for removal of biological matrices combined with CGE has been applied to ASODN detection in biological fluids, tissues, and feces (Wu et al., 2009). However, its sensitivity in different biological matrices is not considered sufficient for defining either the elimination phase of ASODNs in plasma or intracellular exposure after drug treatment: 0.5 nM in plasma, 6 μg/g in tissues, and 2 mg/L (0.5 nM) in urine and bile.
Recently, nucleic acid hybridization-based enzyme-linked immunosorbent assay (ELISA) has been proposed as a method of phosphorothioate oligonucleotides (PSODN) quantification. Although both one-step homogeneous competitive (Deverre et al., 1997; Efler et al., 2005) and noncompetitive (Yu et al., 2002) hybridization methods showed good sensitivity (at pM levels), their inability to differentiate the intact drug from metabolites limited their use. Wei et al. (2006) compared the sensitivity and selectivity of one-step hybridization and two-step hybridization-ligation ELISA methods for the quantification of two ASODNs, G3139 and GTI-2040, in 10% plasma and K562 cell lysates. Two-step hybridization-ligation ELISA methods were reported to be selective for intact drugs with minimal cross-reactivity with 3′-end deletion oligomers. This method was not, however, able to quantify the intact ODN and its metabolites separately. In addition, the applicability of the assay was only investigated in two ASODNs, G3139 and GTI-2040 in plasma and cell lysate. Collectively, although significant improvement was made with regard to this method, to date, no hybridization-based assay for ODN-based drugs in complex biological matrices, including biological fluids, tissues, and feces, has been reported. Therefore, existing methods are far from being able to provide reliable information on biodistribution and disposition.
In our previous study, we refined the nucleic acid hybridization-based enzyme-linked bridging assay (ELBA) system by examining several factors in detail—the concentrations of the capture and detection probes and the amounts of S1 nuclease. In this paper, we extend the applicability of the assay and render it more sensitive and universal to assessment of the PK properties of ODN-based drugs and their metabolites in biological matrices. Specifically, the current method has the following advantages: (1) It is applicable to ODN-based drugs, including ASODNs with various modifications, such as PSODN, 2′-O-Me (MBO; Zhou and Agrawal, 1998), and locked nucleic acids (LNA; Veedu and Wengel, 2010), and CpG drugs with B- and C-type sequences (Noll et al., 2007); (2) it is more sensitive than the CGE method; (3) it provides simultaneous quantification of the intact drug and its metabolites; and (4) it involves easier sample preparation procedures.
Materials and Methods
ASODNs and reagents
This study was performed on ODN-based drugs, including those with multiple ASODNs and GC-rich B- and C-type CpG sequences. They were fully phosphorothioated oligodeoxynucleotides manufactured at Sangon Biotech Co., Ltd. (Shanghai, China) (Table 1). ODNs with different modifications, including LNA, MBO (TaKaRa Biotechnology Co., Ltd., Dalian, China), and morpholino antisense oligonucleotide (MF) (Gene Tools, LLC., US) were also used (Table 2). 3′-end (3′ N-1, 3′ N-2) putative metabolites and their capture probes are listed in Table 3. These were obtained from Sangon (Shanghai, China).
Sequences of oligonucleotides, corresponding captures and detection probe used in the study to investigate the applicability of the method to ODNs-based drugs with different secondary structures.
ODN-A, ODN-B, and ODN-C were the antisense oligonucleotides drugs targeting hepatitis B virus (HBV), Bcl-2, and insulin-like growth factor (IGF) kept in our laboratory.
GTI-2040 were from Wei et al. (2006).
B- and C-class CpG ODN were from Noll et al. (2007).
Letters in bold and italic were the modification site.
PSODN, phosphorothioate oligonucleotide; MBO, 2′-O-Me; LNA, locked nucleic acid; MF, morpholino antisense oligonucleotide.
ODN, oligonucleotide.
Reacti-Bind NeutrAvidin-coated polystyrene plates were purchased from Pierce Biotechnology, Inc. (Rockford, IL). The hybridization buffer used in the preparation of the capture probe solution contained 60 mM sodium phosphate, pH 7.4, 1.0 M NaCl, 5 mM EDTA, and 0.2% Tween 20. T4 DNA ligase and 10× ligation buffer were purchased from New England BioLabs, Inc. (NEB, Beverly, MA). S1 nuclease was purchased from Invitrogen Corp. (Carlsbad, CA). The washing buffer contained 25 mM Tris-HCl, pH 7.2, 0.15 M NaCl, and 0.2% Tween 20. Exonuclease I (ExoI) and 1× ExoI buffer were purchased from NEB (Beverly, MA). Anti-digoxigenin-alkaline phosphatase (AP) was obtained from Roche (Indianapolis, IN) and a 1:1500 dilution of antibody was carried out with 1:10 superblock buffer in Tris-buffered saline (TBS; Pierce, Rockford, IL). The AP fluorescent substrate AttoPhos and its reconstitution solution were purchased from Promega Life Science (Madison, WI). Proteinase K, and GA buffer was purchased from TIANGEN Biotech Co., Ltd. (Beijing, China). Phenol/chloroform/isoamyl alcohol (25:24:1) was purchased from Sigma (St. Louis, MO).
ELBA assay procedure
The ELBA principle is modified on the basis of a two-step hybridization (Wei et al., 2006), first by base pairing of analytes (N-mer) to the capture probe (N+9-mer), followed by hybridization with a detection probe (9-mer), which is then ligated to the analyte by T4 DNA ligase. Metabolites (N−1 or above 1), capture probes (N+9-mer), and detection probes (9-mer) can form a double strand with a gap in one strand; this can be cleaved if S1 nuclease is used, which has no fluorescence intensity. The entire procedure ensures the selective collection of fluorescence solely by intact ODN-based drugs. Similarly, the capture probe–targeting metabolite, the detection probe, and the metabolite itself can form a double strand, whereas the intact drug, being longer than the capture probe, can hamper the combination of the detection probe with other particles, leading to an absence of fluorescence intensity. In brief, selective quantification can be realized by using the correct capture probes assisted with the T4 DNA ligase and S1 nuclease.
A capture probe in hybridization buffer solution was first boiled at 100°C for 10 minutes to disrupt any possible secondary structures. An aliquot of 80 μL of the capture probe solution was added to 80 μL plasma and other biological matrices containing ODNs. On the basis of our previously optimized conditions, we used concentrations of capture probe and detection three and four times, respectively, as those of the higher limit of quantification (HLOQ) of dynamic calibration ranges and a final concentration of 0.25% for Triton X-100. The mixture was incubated at 42°C for 2.5 hours for hybridization. An aliquot of 150 μL of this solution was transferred to a NeutrAvidin-coated 96-well plate, which was then incubated at 37°C for 30 minutes to allow the attachment of biotin-labeled capture probe to NeutrAvidin-coated wells. The plate was washed three times with washing buffer and 150 μL ligation solution containing 5 U/mL T4 DNA ligase, and then a detection probe of suitable concentration was added to each well. The plate was incubated at 16°C for 3 hours and washed to remove unligated detection probe. Following the addition of S1 nuclease solution in 100 mM NaCl, the plate was incubated at 37°C for 1 hour to cleave the truncated duplex. After another five washes, the plate was blocked with Superblock buffer. An aliquot of 150 μL of antidigoxigenin-AP diluted 1:1500 with bovine serum albumin (BSA) block buffer (2%) was added to each well, followed by incubation for 30 minutes at room temperature with gentle shaking. After three washes, an aliquot of 150 μL substrate solution was added to each well, and the plate was incubated at 37°C for 30 minutes. Finally, fluorescence intensity was measured at Ex 405/Em 560 (filter=550 nm) using a Synergy™ 4 Multi-Detection Microplate Reader (BioTek Instruments, US).
ODN secondary structure analysis
Secondary structures were analyzed by RNAstructure 4.5 software (Turner Lab). The “fold DNA single strand” function was used to mimic the putative secondary structure of ODNs and their corresponding capture probes. The “fold DNA bimolecular” function was used to mimic the probable hybridization complexes of ODNs and their corresponding capture probes, which aims to evaluate the ability of the detection probe to accessing the ODN-capture hybridization complex.
Applicability of ELBA and effects of S1 nuclease on quantification linearity
Because nucleic acid hybridization is the basis of the ELBA system, we had to determine the applicability of ELBA to ODN-based drugs with different backbones and secondary structures. Different ASODNs were tested, including ODN-A, ODN-B, ODN-C, and GTI2040. B- and C- types of CpG sequences abundant in GC were also considered. The responses of these ODNs to S1 nuclease were shown by the quantification linearity with 0 U, 15 U, 30 U, 45 U, and 60 U S1. Multiple ODN standards ranging in concentration from 0.012 nM to 50 nM were prepared by serial dilution of stock solution in 100% plasma. They were processed and analyzed as described above.
Meanwhile, ASODNs in the popular PSODN, MBO, LNA, and MF formats were also used to investigate the applicability of the assay. Standard curves covering a concentration range of 0.003 nM to 12.5 nM were prepared by serial dilution at 1:3 in 100% plasma. These were processed and analyzed as described above (S1 nuclease, 30 U) with their corresponding ODN-C capture probes.
Selectivity and simultaneous quantification of the intact drug and metabolites using ELBA
First, the selectivity of the intact drug and its metabolites were evaluated by ELBA using different capture probes. Two samples were prepared as follows: Sample A was a mixture of intact ODNs and 3′ N-1 and 3′ N-2 putative metabolites at concentrations of 5 nM each. Sample B contained all components of sample A except for the specific target of the probe in question. For example, when using the ODN-C capture probe, sample B contained all components of sample A except ODN-C; when using the 3′ N-1 capture probe, sample B contained all components of sample A except 3′ N-1. Sample B was designed to test the ability of a capture probe to specifically distinguish between intact ODN drugs and metabolites. The cross-reactivity was calculated as EC50 (50% of the maximal response) of parent compound divided by EC50 of each metabolite.
For simultaneous quantification experiments, ODN-C and its 3′-end (3′N-1 and 3′ N-2) metabolites were used as standards to be diluted from 12.5 nM to 0.04 nM with 100% rhesus monkey plasma. The corresponding captures were used to perform simultaneous quantification. Meanwhile, 5 nM ODN-C in 100% plasma was incubated at 37°C with 5 U and 20 U ExoI (which catalyzes the removal of nucleotides from single-stranded DNA in the 3′ to 5′ direction) to mimic cleavage conditions in vitro. An aliquot of 75 μL of the solution was drawn at 10, 20, 30, 40, 60, 120, and 180 minutes. Samples were analyzed and concentrations were calculated according to the standard curves of the intact ODNs and the 3′ N-1 and 3′ N-2 metabolites.
Animals
Rhesus monkeys (3.8±0.5 kg) were supplied by the Institute of Beijing Xieerxin Biology Resource (Beijing, China). Wistar rats (190–210 grams) were supplied by the Animal Raising Center of the Academy of Military Medical Sciences. Rhesus monkeys were individually housed in stainless steel cages. Rats were housed in plastic cages at a maximum of 5 mice per cage. The animals were maintained at 21–23°C, 50–60% humidity, and a 12:12-hour dark–light cycle. The animals had free access to standard laboratory food and water during the acclimation period. All experimental procedures were carried out in accordance with the ethical guidelines established by our institution.
Pharmacokinetics of ODNs in monkeys
Four rhesus monkeys (2 male and 2 female) were intravenously administered guttae (ivgtt) with single dose of 1 mg/kg via side femoral venous catheters. The intravenous infusion time was 30 minutes. Blood samples (1 mL) were collected in tubes containing EDTA from femoral venous catheters on the opposite side at 0 minute (predose), 10 minutes, 20 minutes, 30 minutes, 35 minutes, 45 minutes, 1 hour, 1.25 hours, 1.5 hours, 2 hours, 2.5 hours, 3 hours, 4 hours, 6 hours, and 8 hours after ivgtt administration.
Tissue extraction
Rat liver tissue samples were homogenized in 0.9% NaCl over ice (final concentration 0.2 g/mL). Tissue homogenates were divided into two aliquots to evaluate tissue extraction procedures. We used both the conventional phenol/chloroform extraction method and crude homogenate assay without any extraction procedure.
For the conventional phenol/chloroform extraction method, a known amount of ODN-C standard in 10 μL was added to each homogenate sample (50 μL) to a final concentration ranging from 0.39 nM to 100 nM. This was then incubated with 10 μL of 10 mg/mL proteinase K in 20 μL of GA buffer at 56°C for 1 hour and then extracted with 100 μL of ice-cold phenol/chloroform/isoamyl alcohol (25:24:1). Samples were then centrifuged at 14,000g for 15 minutes, and the supernatant (aqueous phase) was removed and mixed with 150 μL of isopropanol. The mixture was centrifuged at 14,000g for 15 minutes, after which it was stored for 30 minutes at 4°C. The precipitation was resuspended in 85 μL of TE buffer. The sample was processed and analyzed with 85 μL of hybridization buffer containing a capture probe.
Similarly, for the crude homogenate assay, a known amount of ODN-C standard in 10 μL was added to each homogenate sample (20 μL) to a final concentration ranging from 0.39 nM to 100 nM and incubated with 10 μL of proteinase K at 10 mg/mL in 50 μL of GA buffer at 56°C for 1 hour. The mixture was processed and analyzed with 85 μL of hybridization buffer containing a capture probe.
Effects of Triton X-100 concentration and hybridization temperature on the quantification of ODN-based drugs in biological matrices
An aliquot of 10 μL of ODN-C working solution was added to each homogenate sample (20 μL) to a final concentration ranging from 0.78 nM to 100 nM. Each standard was incubated with 10 μL of proteinase K at 10 mg/mL in 50 μL of GA buffer. Various Triton X-100 concentrations (0.25%, 1%, and 2%) and hybridization temperatures (42°C and 55°C) were investigated with S 1 at 30 U.
Method validation in different biological matrices
Blank tissues (heart, liver, spleen, lung, and kidney) and feces from Wistar rats were weighed and homogenized in appropriate volumes of 0.9% NaCl using a PRO 200 homogenizer (Oxford, CT, US) to a final concentration of 200 mg (tissue)/mL. Standard curves were prepared by adding known amounts of ODN to blank biological matrices. Nominal concentrations were 100 nM diluted to 0.024 nM. The same assay was used for plasma and other biological fluids, such as bile and urine. Quality control (QC) samples were prepared by mixing appropriate amounts of stock solution with blank biological matrices.
Absorption, distribution, metabolism, and excretion study of ODN-based drugs using ELBA
Wistar rats (180–220 g) were used in absorption, distribution, metabolism, and excretion (ADME) evaluation experiment. ODN-C in sterile saline was injected into the tail vein at a single dose of 22 mg/kg. Two rats each were euthanized at 20 minutes, 1 hour, 2 hours, 4 hours, 7 hours, and 24 hours after dose administration. The blood, heart, liver, spleen, lungs, and kidneys were collected. After three washes with PBS, the tissues were weighed and homogenized. The tissue homogenates (200 mg/mL) and blood were stored at −80°C until analysis. Two rats were housed in a metabolism cage, and samples of their urine and feces samples were collected at intervals of 0–2, 2–4, 4–7, and 7–24 hours after dosing. Two rats were anesthetized, and their bile were collected at 0 minutes (predose) and at 8 minutes, 30 minutes, 1 hour, 2 hours, 4 hours, 7 hours, and 24 hours postadministration. Urine and bile samples were immediately frozen at −80°C until analysis.
Results
Applicability of ELBA to ODN-based drugs with different secondary structures and modifications
In our preliminary experiment, we found that the 60 U of S1 nuclease previously recommended (Wei et al., 2006) was not suitable to our needs. Some ODNs seemed resistant to the 60 U amount, and others were entirely digested and gave no signal. Because this method is based on the principle of complementary base pairing, we hypothesized that different base constitutions led to the differences in stability of complex structures; this in turn, affected the combination of detection probes to the ODN-capture complexes, thus yielding different resistances to the S1 nuclease. Here, we selected ASODNs with different backbones and GC-rich B- and C-class CpG sequences. The secondary structures were analyzed (Table 4). Data showed that the quantificational dynamic range was indeed different with the addition of S1 (0 U, 15 U, 30 U, 45 U, and 60 U) (Fig. 1A–E). The optimal S1 nuclease amount of each ODN was as follows: 15–30 U for ODN-A and ODN-C, 30–45 U for ODN-B, and 30–60 U for GTI2040, B-class CpG, and C-class CpG. This indicated that although the ELBA method was applicable to ODN-based drugs, the amount of S1 was critical and needed to be optimized separately for each ODN.
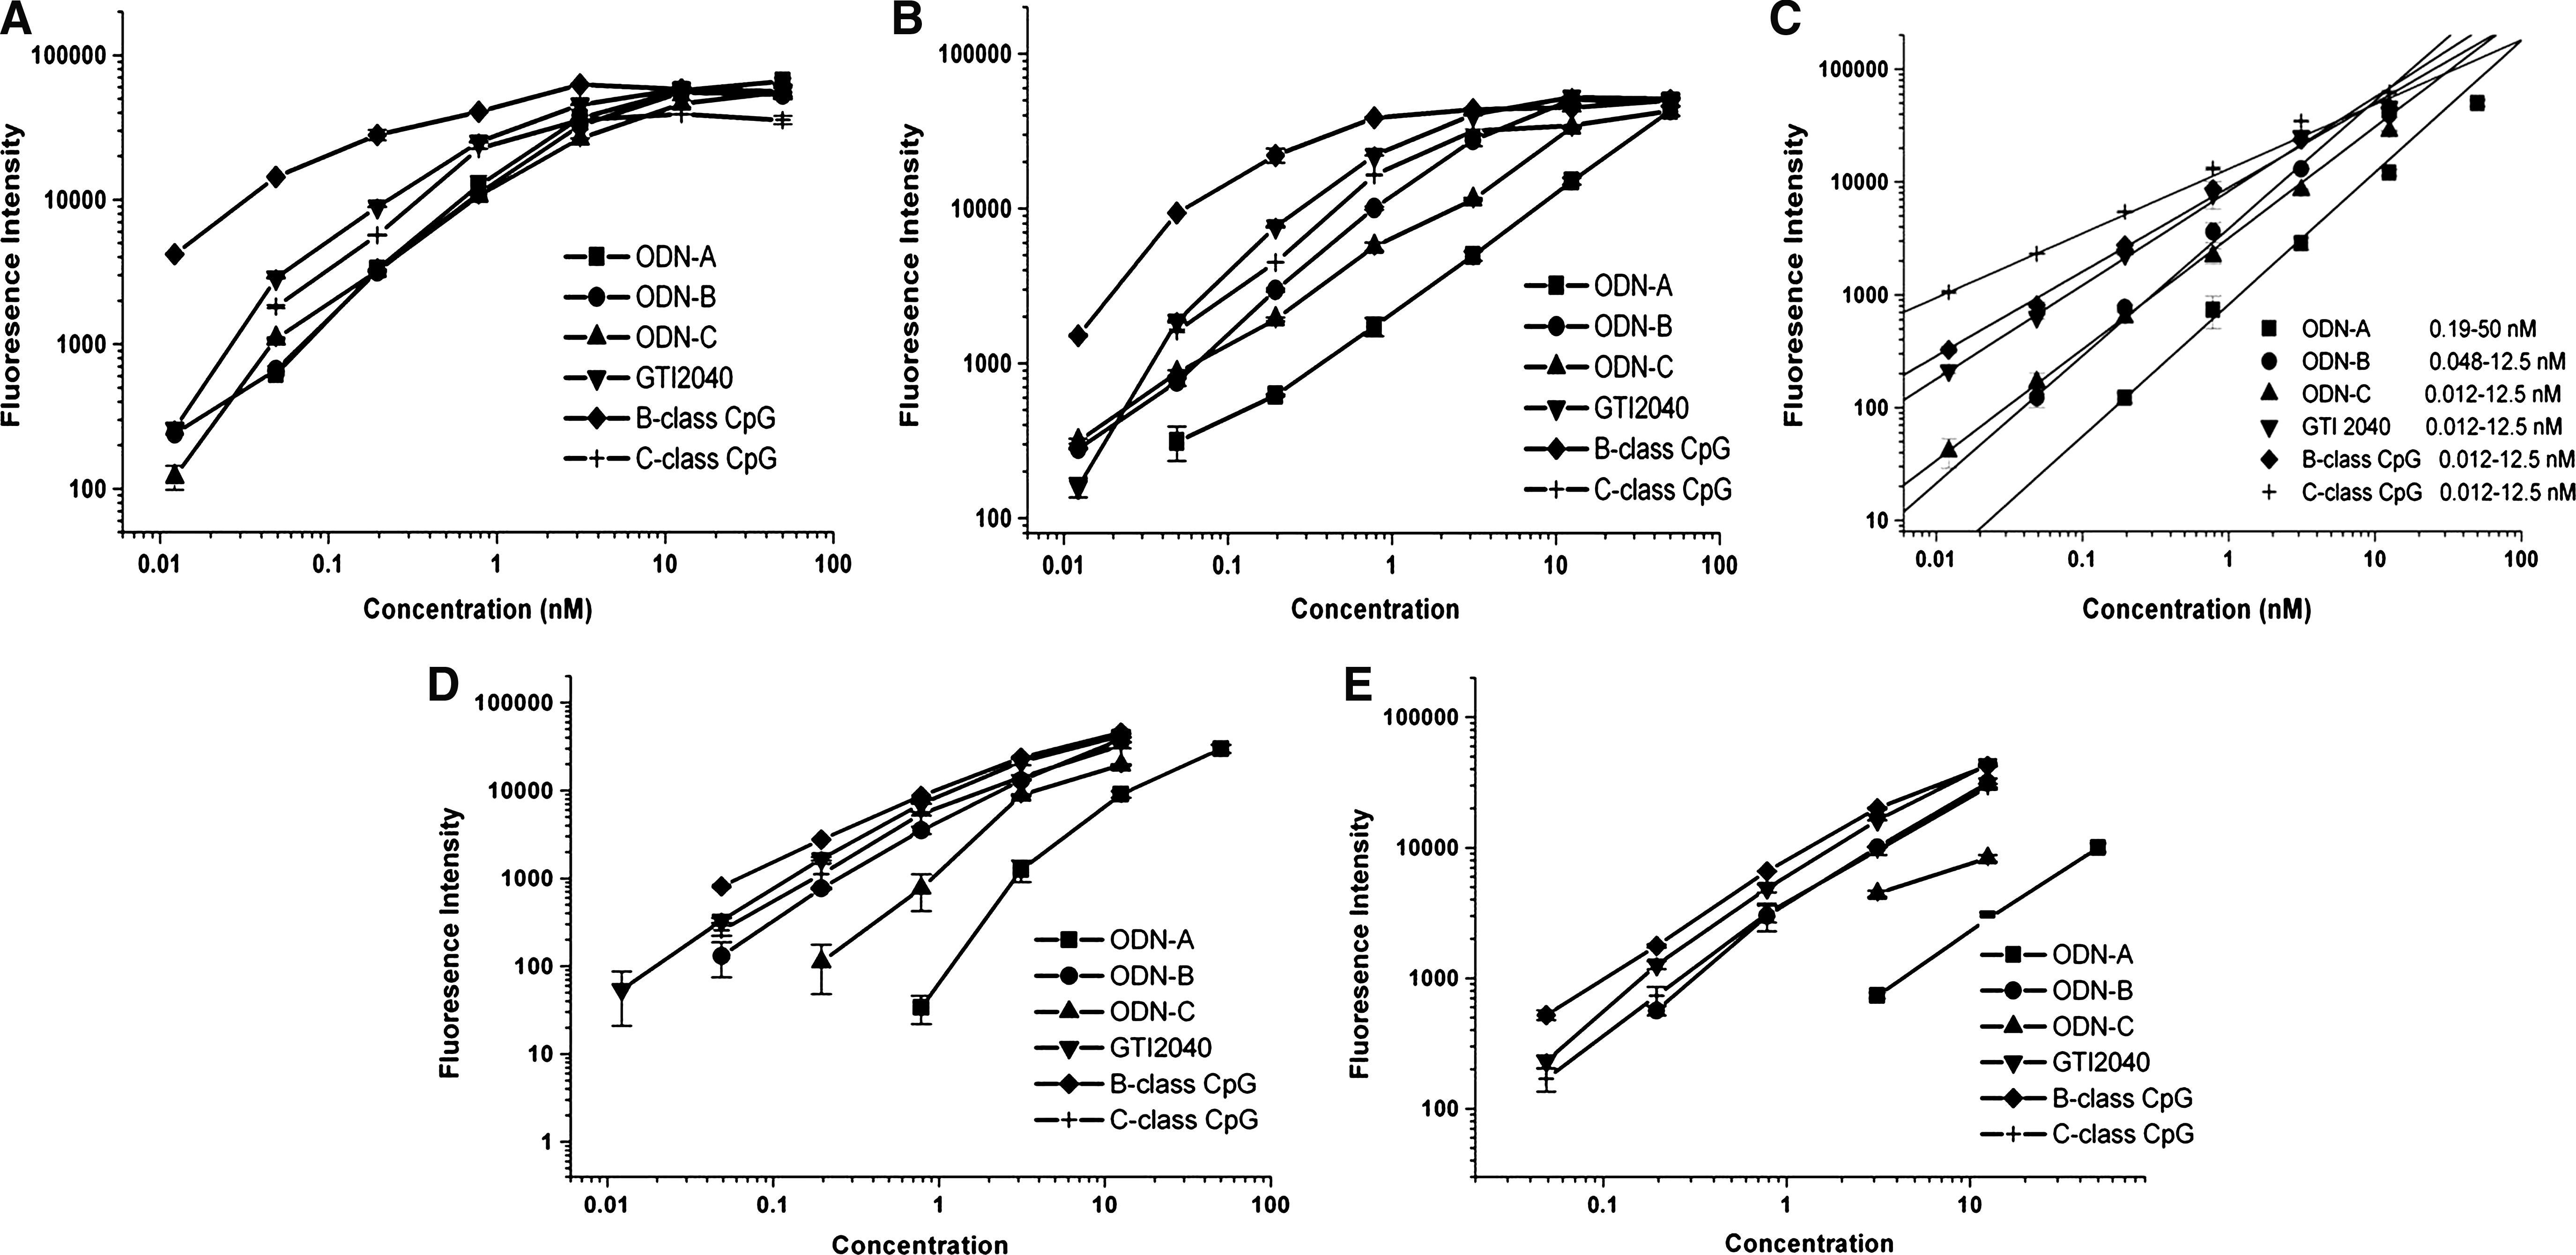
Effect of S1 nuclease on linearity range of oligonucleotide (ODN)-based drugs. ODN-based drugs including antisense oligonucleotides

The arrow indicates the combination site of the detection probe.
ODN, oligonucleotide.
During the development of ODN-based drugs, different modifications were adopted to improve their efficacies and stabilities. To extend the applicability of the assay to antisense ODNs, we investigated the ODN-C sequences of ODNs with PSODN, MBO, LNA, and MF formats in 100% monkey plasma. Data showed that the assay was able to quantify PSODN, MBO, and LNA ODNs. MBO and LNA showed better responses to the assay than other modifications did. This may be attributed to the higher affinity and stability allowed by the modifications. In contrast, the MF antisense oligonucleotide was found to be completely unsuitable for the assay (Fig. 2).
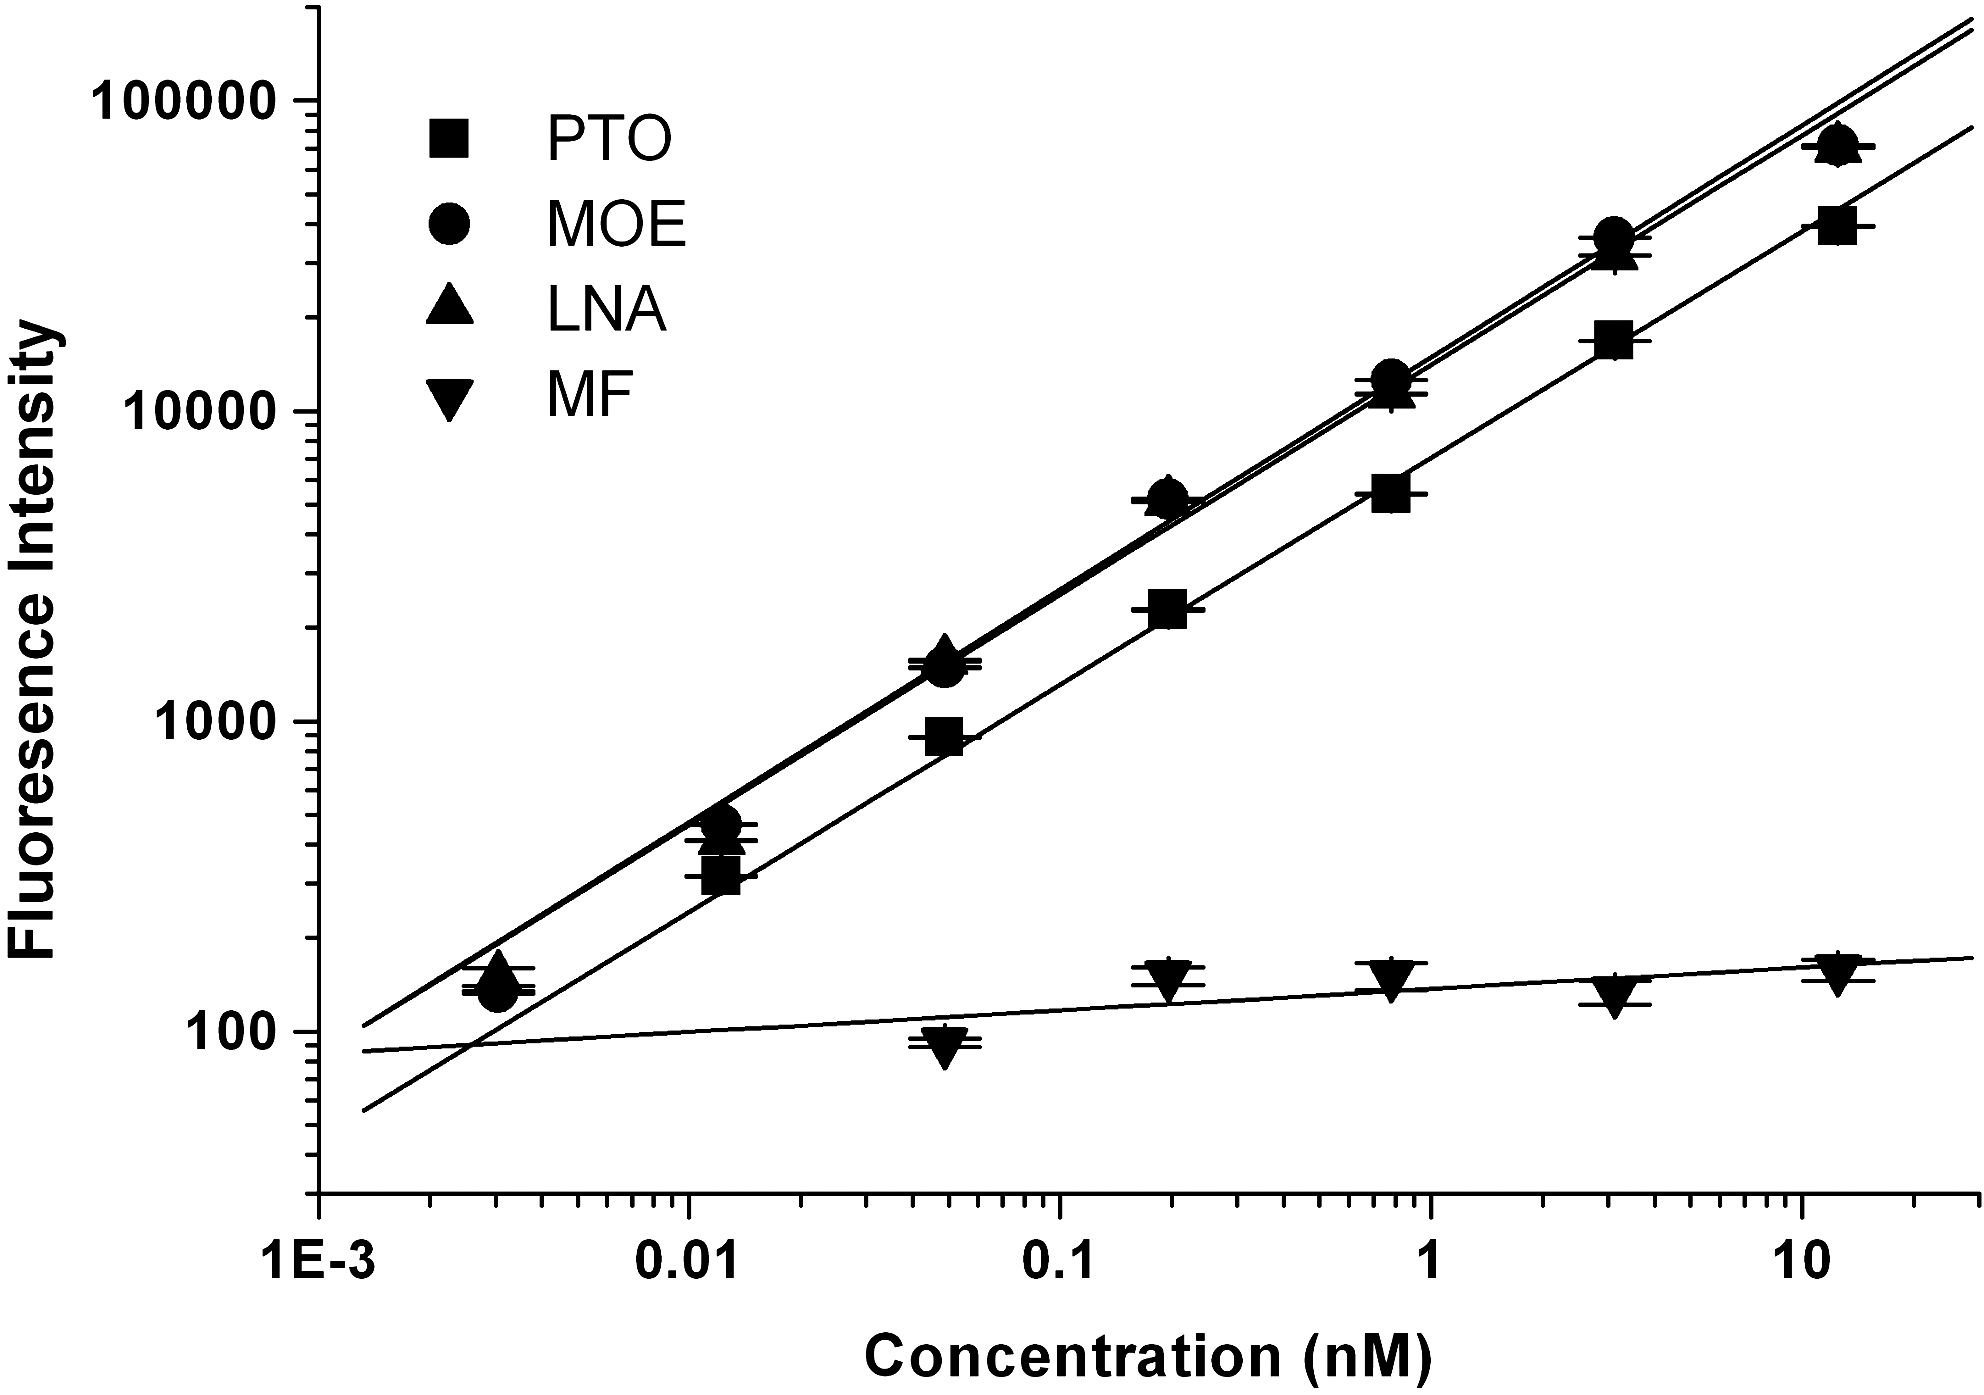
Applicability of enzyme-linked bridging assay (ELBA) on antisense oligonucleotides (ASODNs) with different modifications. ASODNs including phosphorothioate oligonucleotide (PSODN), 2′-O-Me (MBO), locked nucleic acid (LNA), and morpholino antisense oligonucleotide (MF) modification were used to be standards. Standard curves ranging from 12.5 nM to 0.003 nM were prepared in 100% plasma at a dilution of 1:3. Data are expressed as mean±standard deviation (SD) of three independent experiments.
Selectivity and simultaneous quantification of intact ODNs and their metabolites
These experiments were designed to test the ability of the capture probes to specifically distinguish intact ODNs from their metabolites. Data showed that when the intact, 3′ N-1 and 3′ N-2 particles were mixed to a concentration of 5 nM each and processed with either the intact, 3′ N-1, or 3′ N-2 capture probes, responses were detected. Using their respective standard curves, the concentrations in this mixture were determined to be 5 nM, 4.84 nM, and 4.95 nM for the intact, 3′ N-1, and 3′ N-2 ODNs, respectively (n=5). The average recovery ranged from 97.0% to 100.0%. However, whenever a specific ODN was omitted from the mixture, its corresponding capture probe showed no response (the cross-reactivities were below 3% for 3′ N-1 and below 0.5% for the 3′ N-2 ODN), demonstrating that the capture probes could selectively respond to their specific ODNs (Fig. 3A).
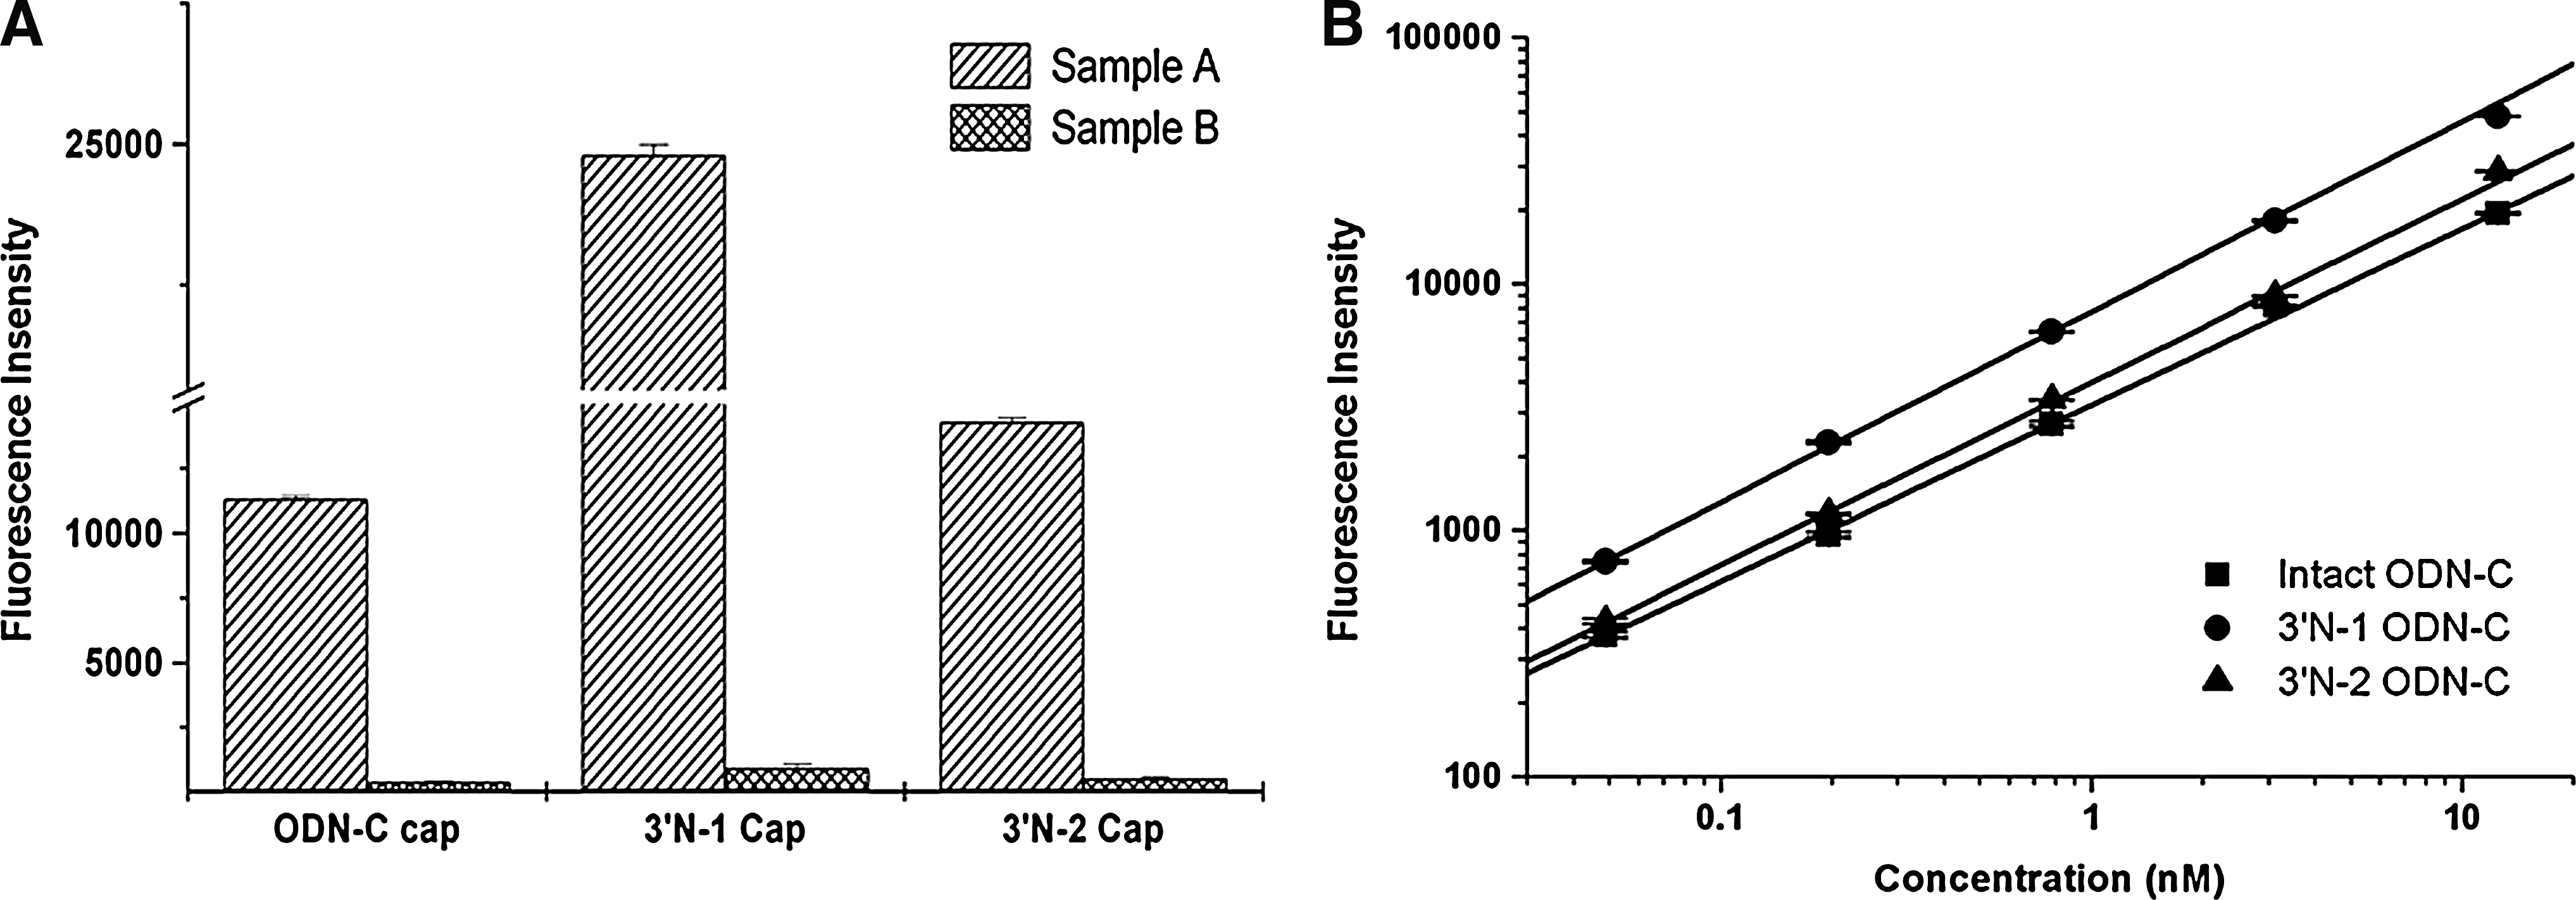
Selectivity and simultaneous quantification of intact oligonucleotides (ODNs) intact and their metabolites.
Standard curves for the intact, 3′ N-1, and 3′ N-2 ODN-C in blank monkey plasma at concentrations ranging from 0.05 nM to 12.5 nM were constructed and linear relationships between concentrations and fluorescence intensity were prepared. Their correlation coefficients (R2) were greater than 0.99. The corresponding captures were used for the simultaneous quantification of the intact ODN and its metabolites. Representative standard curves of intact, 3′ N-1, and 3′ N-2 ODN-C are shown in Fig. 3B. Furthermore, specific ExoI, which could catalyze the removal of nucleotides from single-stranded DNA in the 3′-to-5′ direction, was used to mimic cleavage conditions in vitro. Each standard was added to the corresponding ELISA plate. Samples were tested in duplicate. Data showed that the assay could successfully and simultaneously quantify intact ODNs and metabolites in plasma. With the addition of ExoI (from 5 U to 20 U) (Fig. 4A,B), the amount of intact ODN decreased and amounts of 3′ N-1 and 3′ N-2 metabolites increased, showing that our method could successfully and simultaneously quantify the levels of intact ODNs and their metabolites.
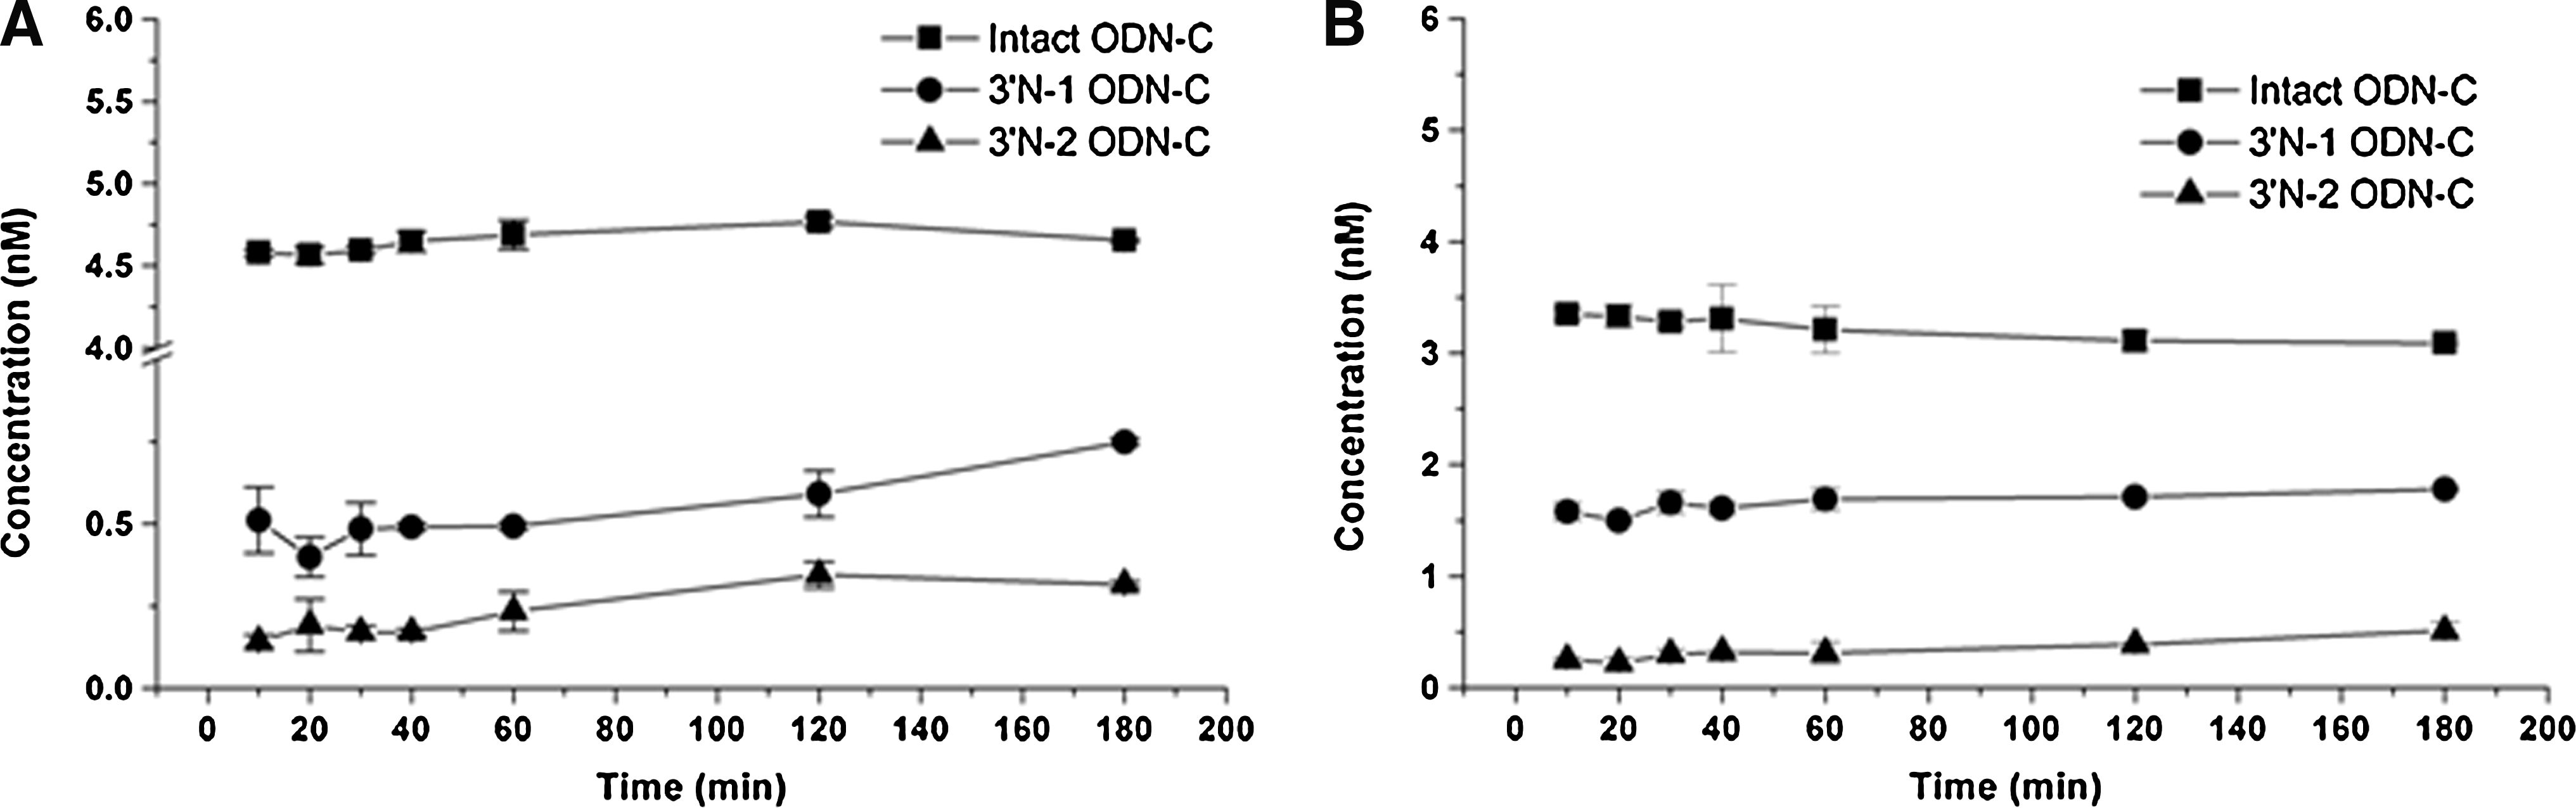
Simultaneous quantification of ODN-C and its 3′-end (3′ N-1, 3′ N-2) putative metabolites in vitro conditions mimicking the nuclease
Applications of ELBA to the evaluation of PK properties of intact ODNs and their metabolites
The ELBA method, which can simultaneously quantify intact ODNs and their metabolites, was subsequently applied to the quantitative analysis of intact ODNs and 3′ N-1 and 3′ N-2 metabolites in plasma harvested from rhesus monkeys treated ivgtt at a dose of 1 mg/kg via a side femoral venous catheter. Data showed that ODN-C and its 3′ N-1 metabolite were dominant in vivo within the 8 hours. Traces of the 3′ N-2 metabolite were also detected in the plasma during those 8 hours (Fig. 4C).
Effects of Triton X-100 concentration and hybridization temperature on sample extraction procedure in biological matrices
After having compared the conventional phenol/chloroform/isoamyl alcohol extraction procedure to the crude homogenate method, we found that the former led to lower stability and recovery rates (Table 5). The column-purified method was also tried, but was abandoned due to too low a recovery rate (data not shown). As for the phenol/chloroform/isoamyl alcohol extraction procedure, it was more time and labor consuming, which rendered it unsuitable for the study of PK properties of ODN-based drugs. In contrast, the crude homogenate method was more convenient and robust.
n, the number of replicate samples.
RSD%, relative standard deviation; RE%, relative error=observed concentration/nominal concentration −1 ×100.
We performed further optimization based on the crude homogenate method, this time taking into account the concentration of Triton X-100 and the hybridization temperature (Fig. 5A,B). Although an increase in the Triton X-100 concentration to 2% could increase the signal, the linearity was negatively affected. Concentrations of 1% and 0.25% gave similar ranges of linearity, although the latter was better. Data showed that the hybridization temperature only affected linearity to a small extent (42°C and 55°C gave similar results) (Fig. 5C). Therefore, our data can be said to confirm Wei et al.'s recommendation of a 0.25% Triton X-100 concentration and 42°C hybridization temperature.
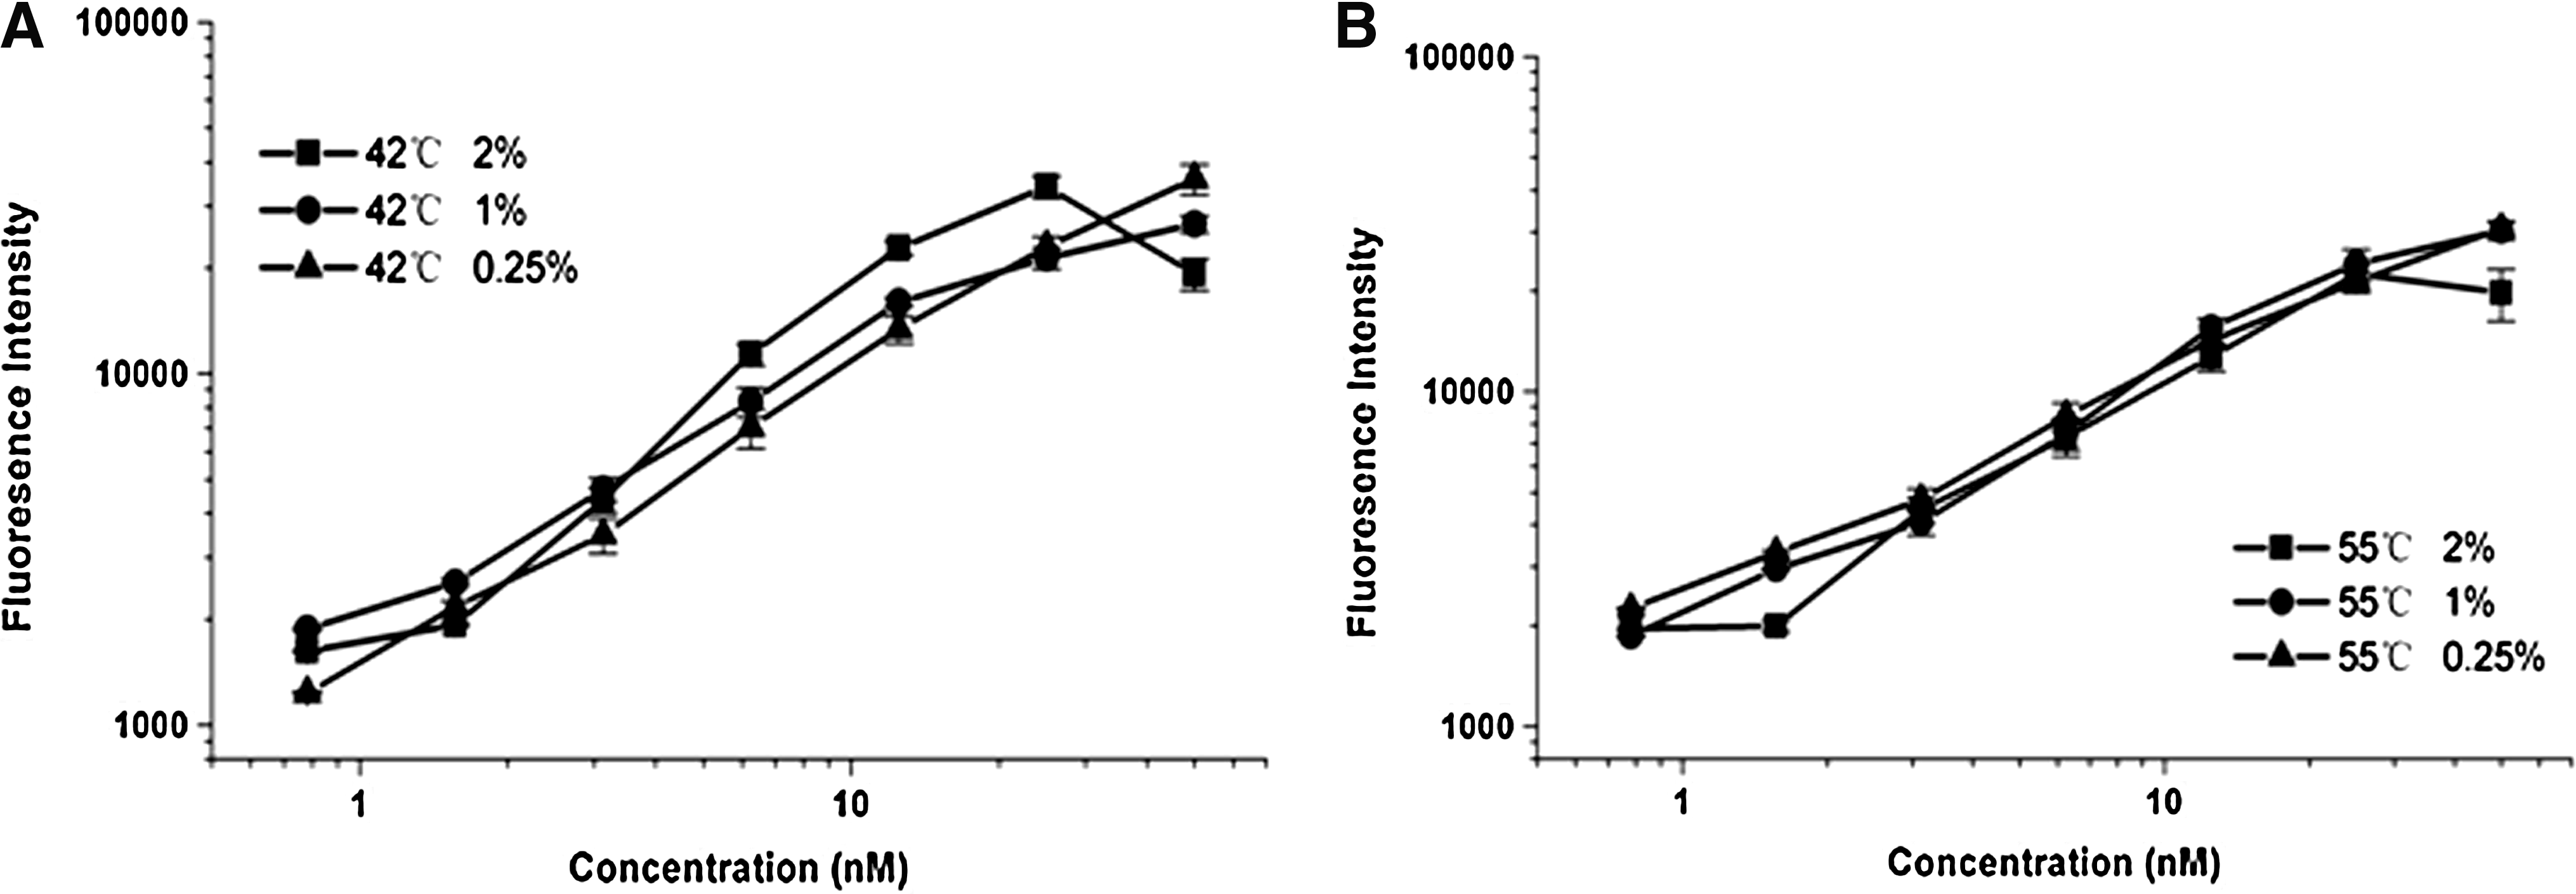
Effect of hybridization temperature and Triton X-100 concentration on the hybridization signal and linearity. Three Triton X-100 concentrations (0.25%, 1%, and 2%) were performed in the first hybridization step at different temperatures [42°C
Quantification standard curves and method validation in different biological matrices
Standard curves constructed in various biological matrices in the present study were paralleled to the QC samples at three concentration levels for validation. Intra- and interbatch precision and accuracy of data for all nucleotides used in this study were <15%, indicating acceptable accuracy and relative standard deviations (RSDs). In our study, the linearity ranges of ODNs were 0.024–25 nM for plasma, 0.097–100 nM, and 0.097–5 nM for rat urine and bile, 0.024 nM/0.097 nM–100 nM (0.003/0.012–12.5 μg/gram) for rat tissues, and 0.097–100 nM (0.012–12.5 μg/gram) for feces (Fig. 6A). Data showed that our method had a great advantage over CGE with regard to the sensitivity of quantification in biological matrices (Table 6).

Quantification standard curves in various biological matrix and concentration-time profiles of ODN-C in rat tissues treated with injection via tail vein at a dose of 22 mg/kg for 24 hours.
Data from Wu et al. (2009).
ODN, oligonucleotide; SPE/CGE, solid-phase extraction/capillary gel electrophoresis; ELBA, enzyme-linked bridging assay.
ADME study of oligonucleotide using ELBA
The ELBA method was successfully applied to ADME study of ODN-based drugs. Figure 6B shows the plasma concentration, distribution, and excretion profiles in rat feces, bile, and urine following a single injection via tail vein of 22 mg/kg ODN-C. Following injection, ODN-C was rapidly distributed to the tissues and cleared from the blood. Deposition and clearance half-life of ODN-C in the major organs (kidney, heart, liver, spleen, and lungs) were higher than that in the plasma. In particular, a highly abundant distribution was found in the kidneys. Traces of the intact ODN-C appeared in the feces. These data indicated that the excretion route of intact ODN-C was through the kidneys, urine, and bile. The PK of ODN-C in rats was thus similar to that of various reported PSODNs in preclinical and clinical trials (Yu et al., 2001; Wu et al., 2009). This is the first time that concentrations of ODNs in the bile and urine have been determined and reported by ELBA.
Discussion
The hybridization ligation-based ELISA method has attracted attention in recent years for its remarkable sensitivity. However, no further improvement or application has yet been reported that would allow this form of ELISA to be used in ADME evaluation for intact and metabolite ODN-based drugs. Here, we have reported the simultaneous quantification of ODN-based drugs and their metabolites in various biological matrices with ultrasensitive, universal characteristics and without sample preparation.
S1 nuclease is one of the most important parts of the ELBA assay. On the basis of hybridization principles, we preliminarily hypothesized that different base formats, the secondary structure of the capture itself, and the ODN-capture complex could affect the capture ability of the capture probe and the ligation ability of the detection probe to the 9′-mer tail. Importantly, the different structures of the three sequences may show different levels of resistance to S1 nuclease. In our experiment, we found that the 60 U reported in the literature was in part unsuitable for our sequences. Rather, it caused the signals to weaken and even disappear. Therefore, we tested the applicability of ODN-based drugs with different secondary structures. Data showed that linearity and selectivity would not improve with increases in S1. Conversely, excess S1 nuclease would cleave the entire nucleotide complexes. Therefore, an appropriate amount of S1 was necessary for good linearity and to ensure the ability of the probes to distinguish the intact ODNs from their metabolites. Although the precise relationship between secondary structure and S1 was not determined, we concluded that 30 U might be suitable for most ODN-based drug quantification processes.
It should be noted that although the current method was found to be suitable for ODNs MBO and LNA modifications, it was not found to be suitable for MF. This may be attributed to the characteristic of MF backbone.
High sensitivity was still the overwhelming advantage of the ELBA system. The linearity ranges, precision, and accuracy of ODN-C using a combined SPE/CGE method and the ELBA assay for the determination of PSODNs in biological fluids, tissues, and feces are compared in Table 6. Our method showed huge advantages over the CGE in the quantification of ODN levels in biological matrices.
In CGE methods, sample preparation is usually performed before ODN quantification in complex biological matrices to purify the ODNs and to minimize any matrix effect, resulting in relatively low sensitivity. In addition, the procedures are usually time and labor intensive. In the present method, we tried the phenol/chloroform/isoamyl alcohol method and other column-purified methods (data not shown). The most effective method was direct detection in crude homogenates. This method was proven to be more accurate, robust, less resource intensive, and more amenable to clinical translation than other any extraction procedure. Similarly, a comparison of small interfering RNA (siRNA) standard curves in mouse liver homogenates before and after isolation of total RNA uncovered the potential for erroneous measurement due to significant loss of siRNA in purification columns (Seitaer et al., 2011). Therefore, we concluded that for the ODNs and siRNA drugs, direct plasma and tissue homogenate assay is likely to increase accuracy and sensitivity over methods involving RNA/ODN purification. The reason for this may due to the inefficient recovery of the drug caused by a particular isolation method.
Different influencing factors, including Triton X-100 concentration, hybridization temperature, and volume of crude homogenate, were investigated in detail for the direct crude homogenate assay in biological matrices. Our data indicated that the addition of Triton X-100 and higher hybridization did not significantly improve linearity, although Wei et al. demonstrated that the addition of Triton X-100 improved the sensitivity for phenol/chloroform extraction in plasma and cellular matrices (Wei et al., 2006). However, the volume of homogenate affected the method significantly. Different volumes of homogenate (10–50 μL) were investigated in the reaction system. The signal increased initially and then decreased as the volume of homogenate increased (data not shown), probably because of interference from the biological matrices. Thus, the optimal volume was found to be 20 μL, maximizing sensitivity and minimizing matrix effects.
The ability of simultaneous and selective quantification of intact ODNs and their metabolites was another advantage that the ELBA assay provided over its counterparts. It has been successfully applied in analyses of plasma, tissue, urine, feces, and bile samples from monkeys and rats, and it provided a relatively complete characterization of the ADME properties of ODNs and their metabolites in preclinical PK studies. Collectively, this assay constitutes a preferred alternative for quantifying ODN-based drugs from biological samples.
Footnotes
Acknowledgments
This research was supported by the grant from the National Major Special Science and Technology Project of China (2009ZX09304-004).
Author Disclosure Statement
No competing financial interests exist.