
Abstract
MicroRNA 122 (miR-122) is liver specific, fine-tunes lipid metabolism, and is required for hepatitis C virus (HCV) abundance. Miravirsen, an oligonucleotide with locked nucleic acid, binds to miR-122, potently inhibiting its activity. We aimed at determining the safety of the miR-122 antagonism in vivo in 6 to 10 cynomolgus monkeys/group intravenously treated with a range of dose levels twice weekly for 4 weeks. Survival, body weights, clinical signs, and cardiovascular and ophthalmologic parameters were unaffected. Anticipated hypolipidemia due to the inhibition of miR-122 was observed in all treated animals. Only the highest dose level produced distinct transient prolongations of clotting times, slight alternative complement pathway activation, and a reversible increase of hepatic transaminases. Distribution half-life was 10–20 minutes, and accumulation was mainly in the kidney and liver with slow elimination. Microscopic examinations revealed granulated Kupffer cells and lymph node macrophages, cytoplasmic vacuolation in proximal renal tubules, and hepatocytes. The granules were most likely phagolysosomes containing miravirsen. A slightly increased incidence of hepatocyte apoptosis was observed in some monkeys given the highest dose; otherwise, there was no evidence of treatment-related degenerative changes in any organ. In conclusion, the maximal inhibition of miR-122 was associated with limited phenotypic changes, indicating that the clinical assessment of miravirsen as host factor antagonist for treatment of HCV infections is warranted.
Introduction
miR-122 is an abundant, liver-specific miR that regulates the expression of genes involved in cholesterol, fatty acid, and lipid metabolism (Krutzfeldt et al., 2005; Esau et al., 2006; Elmen et al., 2008b). Hence, a biomarker related to miR-122 functional activity is serum cholesterol. The replication of hepatitis C virus (HCV) is also dependent on miR-122 (Jopling et al., 2005). The inhibition of the regulatory role of miR-122 with a complementary oligonucleotide has been demonstrated in vivo (Esau et al., 2006). The antagonism of miR-122 activity with an antimiR-like miravirsen, an oligonucleotide containing locked nucleic acid (LNA) residues, reversibly induces hypocholesterolemia in mice and monkeys (Elmen et al., 2008a, 2008b). We have recently demonstrated that the inhibition of miR-122 reduces viral load in plasma and liver in chronically HCV-infected chimpanzees (Lanford et al., 2010). Miravirsen is currently being evaluated for its therapeutic utility in the management of HCV in humans. The pharmacologic effects of the antagonism of miR-122 by the systemic administration of miravirsen (Elmen et al., 2008a, 2008b) and the possible off-target effects of antimiRs using global transcript profiling, targeted reporter assays, and proteomics (Obad et al., 2011) have been detailed elsewhere. This study was conducted to support the clinical testing of miravirsen and, thus, its purpose was to characterize the effects and tolerability of pharmacologic and supra-pharmacologic dose levels on miR-122. The evolutionary conservation of miR-122 allowed for the selection of cynomolgus monkeys as test species.
Materials and Methods
LNA oligonucleotide
The oligonucleotide miravirsen sodium (also called SPC3649) was synthesized and purified using standard procedures. Its sequence is 5′- mC c A t t G T c a mC am C t mC mC -3′, where uppercase indicates LNA, lowercase indicates DNA, and mC denotes methyl cytosine; the backbone is phosphorothioated. The oligonucleotide was formulated in sterile isotonic saline at concentrations of 1.5, 6, and 24 mg/mL, as determined by comparison to a standard solution of SPC3649 using reverse-phase high-performance liquid chromatography.
Animal husbandry and dosing
Eighteen male and 18 female cynomolgus monkeys (Macaca fascicularis) 2½ to 3 years of age and weighing 2.1 to 3.0 kg from Siconbrec (Philippines) were group housed (2 to 3 animals of the same sex/cage) during the night, and fed a commercially available primate diet [Special Diet Services; OWM (E) short SQC100 g/day] supplemented with fruits and vegetables. The monkeys were fasted overnight before blood and urine sample collection. Filtered (0.2 μm) drinking water was available ad libitum.
The monkeys were divided randomly into control, low-dose, mid-dose, and high-dose groups (Table 1). Vehicle or miravirsen was intravenously administered twice weekly by a slow (5 minutes) bolus injection. Monkeys (3 or 5/sex, see Table 1) received 9 administrations of 0, 3, 12, or 48 mg/kg/administration at 3–4 day intervals, resulting in average weekly dose levels of 0, 6, 24, or 96 mg/kg, respectively, for 4 weeks. Based on previous results (Elmen et al., 2008b), a hypolipidemic response to miravirsen treatment was expected at all dose levels.
Animals were dosed on days 1, 4, 8, 11, 15, 18, 22, 25, and 28 with a dose volume of 2 mL/kg/administration.
Evaluative criteria
Evaluative criteria included in-life clinical observations, body weights and food consumption, clinical pathology (serum chemistry, urinalysis, hematology, and coagulation), ophthalmologic and cardiovascular examinations, postmortem organ weights, and histopathology. Hematologic (Siemens ADVIA 2120) and coagulation (Beckman Coulter ACL 9000 coagulation analyzer) parameter assessments were performed on blood collected before the initiation of treatment and before dosing on days 8, 15, 22, and 28, and on recovery days 43 (hematology only) and 57. The concentrations of complement split products Bb and C3a were determined in EDTA-plasma samples with Quidel Assays A007 and A015, respectively, on samples collected on days 1, 25, 43, and 57.
Serum chemistry analyses (Olympus AU 640 Chemistry Analyzer) were conducted before the initiation of the study and on days 4, 8, 11, 15, 18, 22, 25, 28, 43, 50, and 57. Urinalyses (Olympus AU 640 and Bayer Clinitek 500 Urine Chemistry Analyzer) were conducted before the initiation of the study, on study day 28, and on recovery day 57. Venous blood samples for toxicokinetic analysis were collected immediately before and 1, 4, 8, 24, 48, and 72 hours after dosing on days 1, 25, and during the recovery phase on days 40 and 54. Kidney and liver samples for miravirsen concentration determination were collected at necropsy from all animals in the study.
Miravirsen concentrations from plasma and snap-frozen tissue were determined with a hybridization-based enzyme-linked immunosorbent assay (ELISA) assay. Tissues were homogenized in a lysis buffer containing protease K and incubated overnight at 37°C. A phenol:chloroform:isoamyl alcohol extract was prepared from tissue samples. Plasma was directly analyzed. Briefly, 2 pmol/well of an 8-mer LNA probe biotinylated at the 3′-end and complementary to the 5′-end of miravirsen was added to streptavidin-coated ELISA plates. After a washing step, plasma samples or tissue extracts were added, and 2 pmol/well of a 7-mer LNA probe complementary to the 3′-end of miravirsen was added. The captured miravirsen:LNA duplexes were quantified in an ELISA reader at 450 nm using anti-DIG antibodies conjugated to horse radish peroxidase and the substrate 3,3′,5,5′-tetramethylbenzidine. The toxicokinetic evaluation was performed using a 3-compartmental model in the WinNonlin program (version 5.2.1; Pharsight Corporation).
Within 24 hours of the final dose, 3 animals of each sex from each group were sacrificed and subjected to thorough necropsies to assess organ weights and macroscopic pathology. Tissue specimens were collected, preserved in formalin, processed, and stained with hematoxylin and eosin for histopathological evaluation by light microscopy. Similarly, the recovery animals were sacrificed and necropsied on day 57.
Results
Data are combined across sexes to facilitate presentation, as no sex differences were obvious.
General observations
At no dose level did data from miravirsen-treated animals differ from those collected from controls in terms of survival, clinical signs, body weights, ECG, blood pressure, heart rates and rhythms, or ophthalmologic parameters.
Toxicokinetics and tissue concentrations of miravirsen
Exposure to miravirsen, as determined by plasma concentrations, was linear with dose level. Miravirsen was observed in plasma immediately after the bolus injection, and maximum plasma concentrations (Cmax) were dose related (Fig. 1). The plasma concentration versus time profile was characterized by a rapid distribution phase followed by a slow terminal phase with the attainment of dose-related equilibrium. Since 72 hours was the last time point in the profile, it was not possible to characterize the terminal half-life (t½) of miravirsen for most of the animals, but plasma concentrations were determined in the 8 recovery animals 15 and 29 days after the final dose had been used to estimate the terminal t½. Miravirsen was cleared from the plasma with a distribution t½ of between 10 and 36 minutes (Table 2), whereas the apparent terminal t½ was considerably longer, ∼10 days (data not shown). A longer terminal phase is consistent with the rate of clearance of miravirsen from the liver and kidney after the completion of the 4-week recovery period (see next).
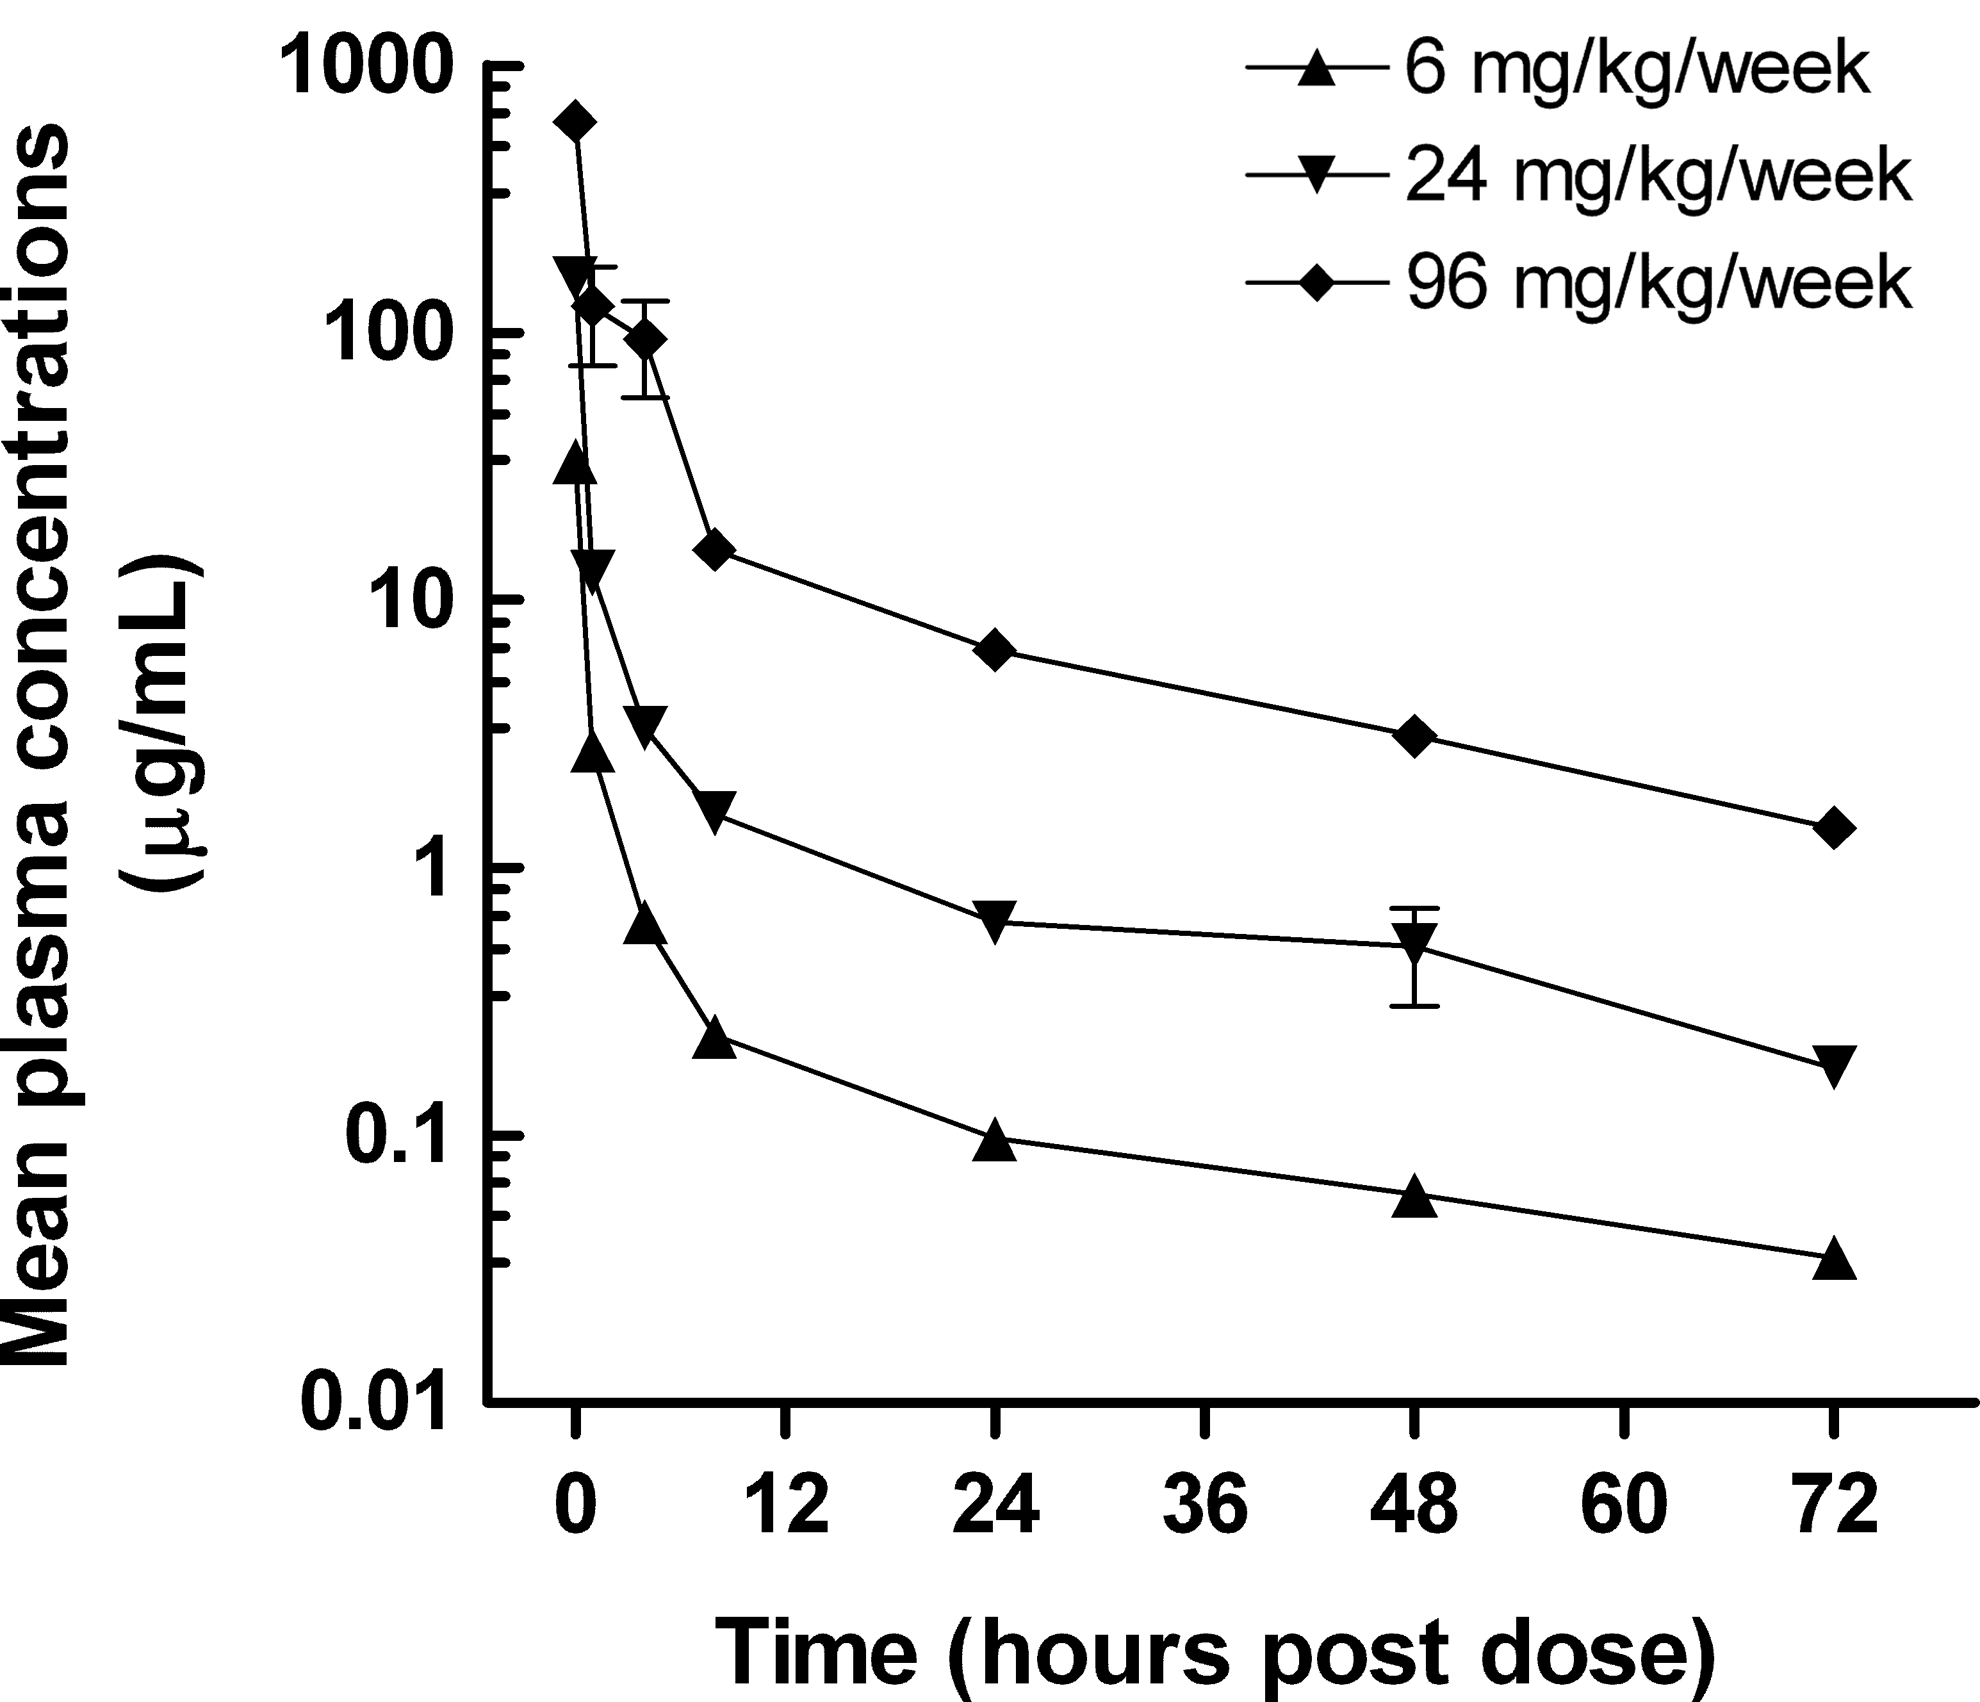
Mean plasma concentrations of miravirsen. Data points represent mean concentrations of miravirsen on day 25. N=6 (6 mg/kg/week) or N=10 (24 or 96 mg/kg/week) animals per group.
Values represent means±standard deviations.
Determined in plasma samples collected 72 hours after dosing.
Area Under the plasma Concentration-time curve from time point zero to the last quantified plasma concentration time point t, 72 hours post dose.
Analyzed parameters (μg/mL or μg×h/mL) divided by the weekly administered dose.
Mean concentrations of drug in plasma 72 hours after dosing (equilibrium plasma levels) on days 1 and 25 were proportional to dose level and were higher (2- to 3-fold) on day 25 (Table 2) than on day 1. The equilibrium (or trough) plasma concentrations of miravirsen were correlated with the liver concentration (Fig. 2). The systemic exposures to miravirsen (reflected by plasma Area Under the Concentration-time curve from time point zero to the last quantified plasma concentration time point t at 72 hours post dose [AUCt] values) were 17% to 74% higher on day 25 than on day 1. The higher AUCt values after repeated dosing were also reflected in changes in the plasma clearance. The mean clearance values on day 25 were ∼75% of the mean values on day 1 (Table 2).

Plasma trough concentrations of miravirsen are related to liver concentrations of the drug. Data points represent individual plasma trough concentrations (ng/mL) of miravirsen on day 28 and liver concentrations (μg/g tissue) of the compound on day 29 at necropsy (N=3/sex/group). Shown are 6 mg/kg/week (downward triangles), 24 mg/kg/week ( upward triangles), and 96 mg/kg/week (filled diamonds) dose levels. The data were subjected to nonlinear regression analysis applying 1/Y as the weighted factor (correlation between observed and predicted values=0.892).
The mean volume of distribution values was dose independent and similar on days 1 and 25. In general, the volumes of distribution (Table 2) were substantially larger than plasma and peripheral fluid volumes, reflecting the considerable localization of miravirsen to a deeper compartment. The concentrations of miravirsen in livers and kidneys (Table 3) increased with dose level, but to different extents. The dose-normalized liver concentrations of miravirsen were the same for the low- and mid-level doses and were ∼40% lower at the highest dose. The concentrations in the kidney showed an even greater tendency for saturation; dose-normalized concentrations decreased 47% to 67% with an increasing dose. Despite this greater tendency for saturation, the concentrations in the kidneys were consistently greater (2.4- to 4.7-fold) at the end of the treatment than those in the liver. Mean kidney and liver concentrations of drugs declined during the treatment-free recovery period. Assuming first-order kinetics, the half-life in the kidney and liver was determined to be 20 and 37 days, respectively. These half-lives were much longer than what had been anticipated before the study start. Consequently, the recovery period was extended to 12 weeks in the subsequent toxicity study.
Dose-normalized values were derived by dividing the absolute values with the corresponding dose per week.
Estimated by assuming first-order elimination between day 29 and day 57.
NA=not applicable, no low-dose animals during the recovery period.
Serum chemistry assessments
The administration of miravirsen caused the pharmacologic effect expected due to the inhibition of miR-122 gene regulation: dose-related decreases in total serum cholesterol (Fig. 3). Decreases were observed in animals at all dose levels and were saturated at 24 mg/kg/week, likely due to the maximal inhibition of miR-122 rather than tissue saturation (Table 3). The effects associated with 24 and 96 mg/kg/week persisted throughout the recovery period, consistent with the long t½ of the drug in tissues. Furthermore, the effects on miR-122 and its downstream targets also take time to re-normalize, potentially even beyond the period of wash-out of the drug from the liver. The magnitudes of the individual animal fluctuations were generally <50%. In the 96 mg/kg/week dose group only, elevations above the upper limit of the normal range (ULN) in mean serum aspartate aminotransferase (AST) and alanine aminotransferase (ALT) concentrations were observed during the last week of dosing. The AST and ALT concentrations were highest during the recovery period (Fig. 4), with 1 male at ∼10 × ULN (AST) and ∼6 × ULN (ALT) and 1 female with ∼3 × ULN (ALT). All animals had levels around or below ULN by day 57. Other hepatic biomarkers such as gamma-glutamyl transpeptidase (GGT), lactate dehydrogenase (LDH), and bilirubin were not increased above ULN at any time point and remained similar to the control levels in all treated animals.
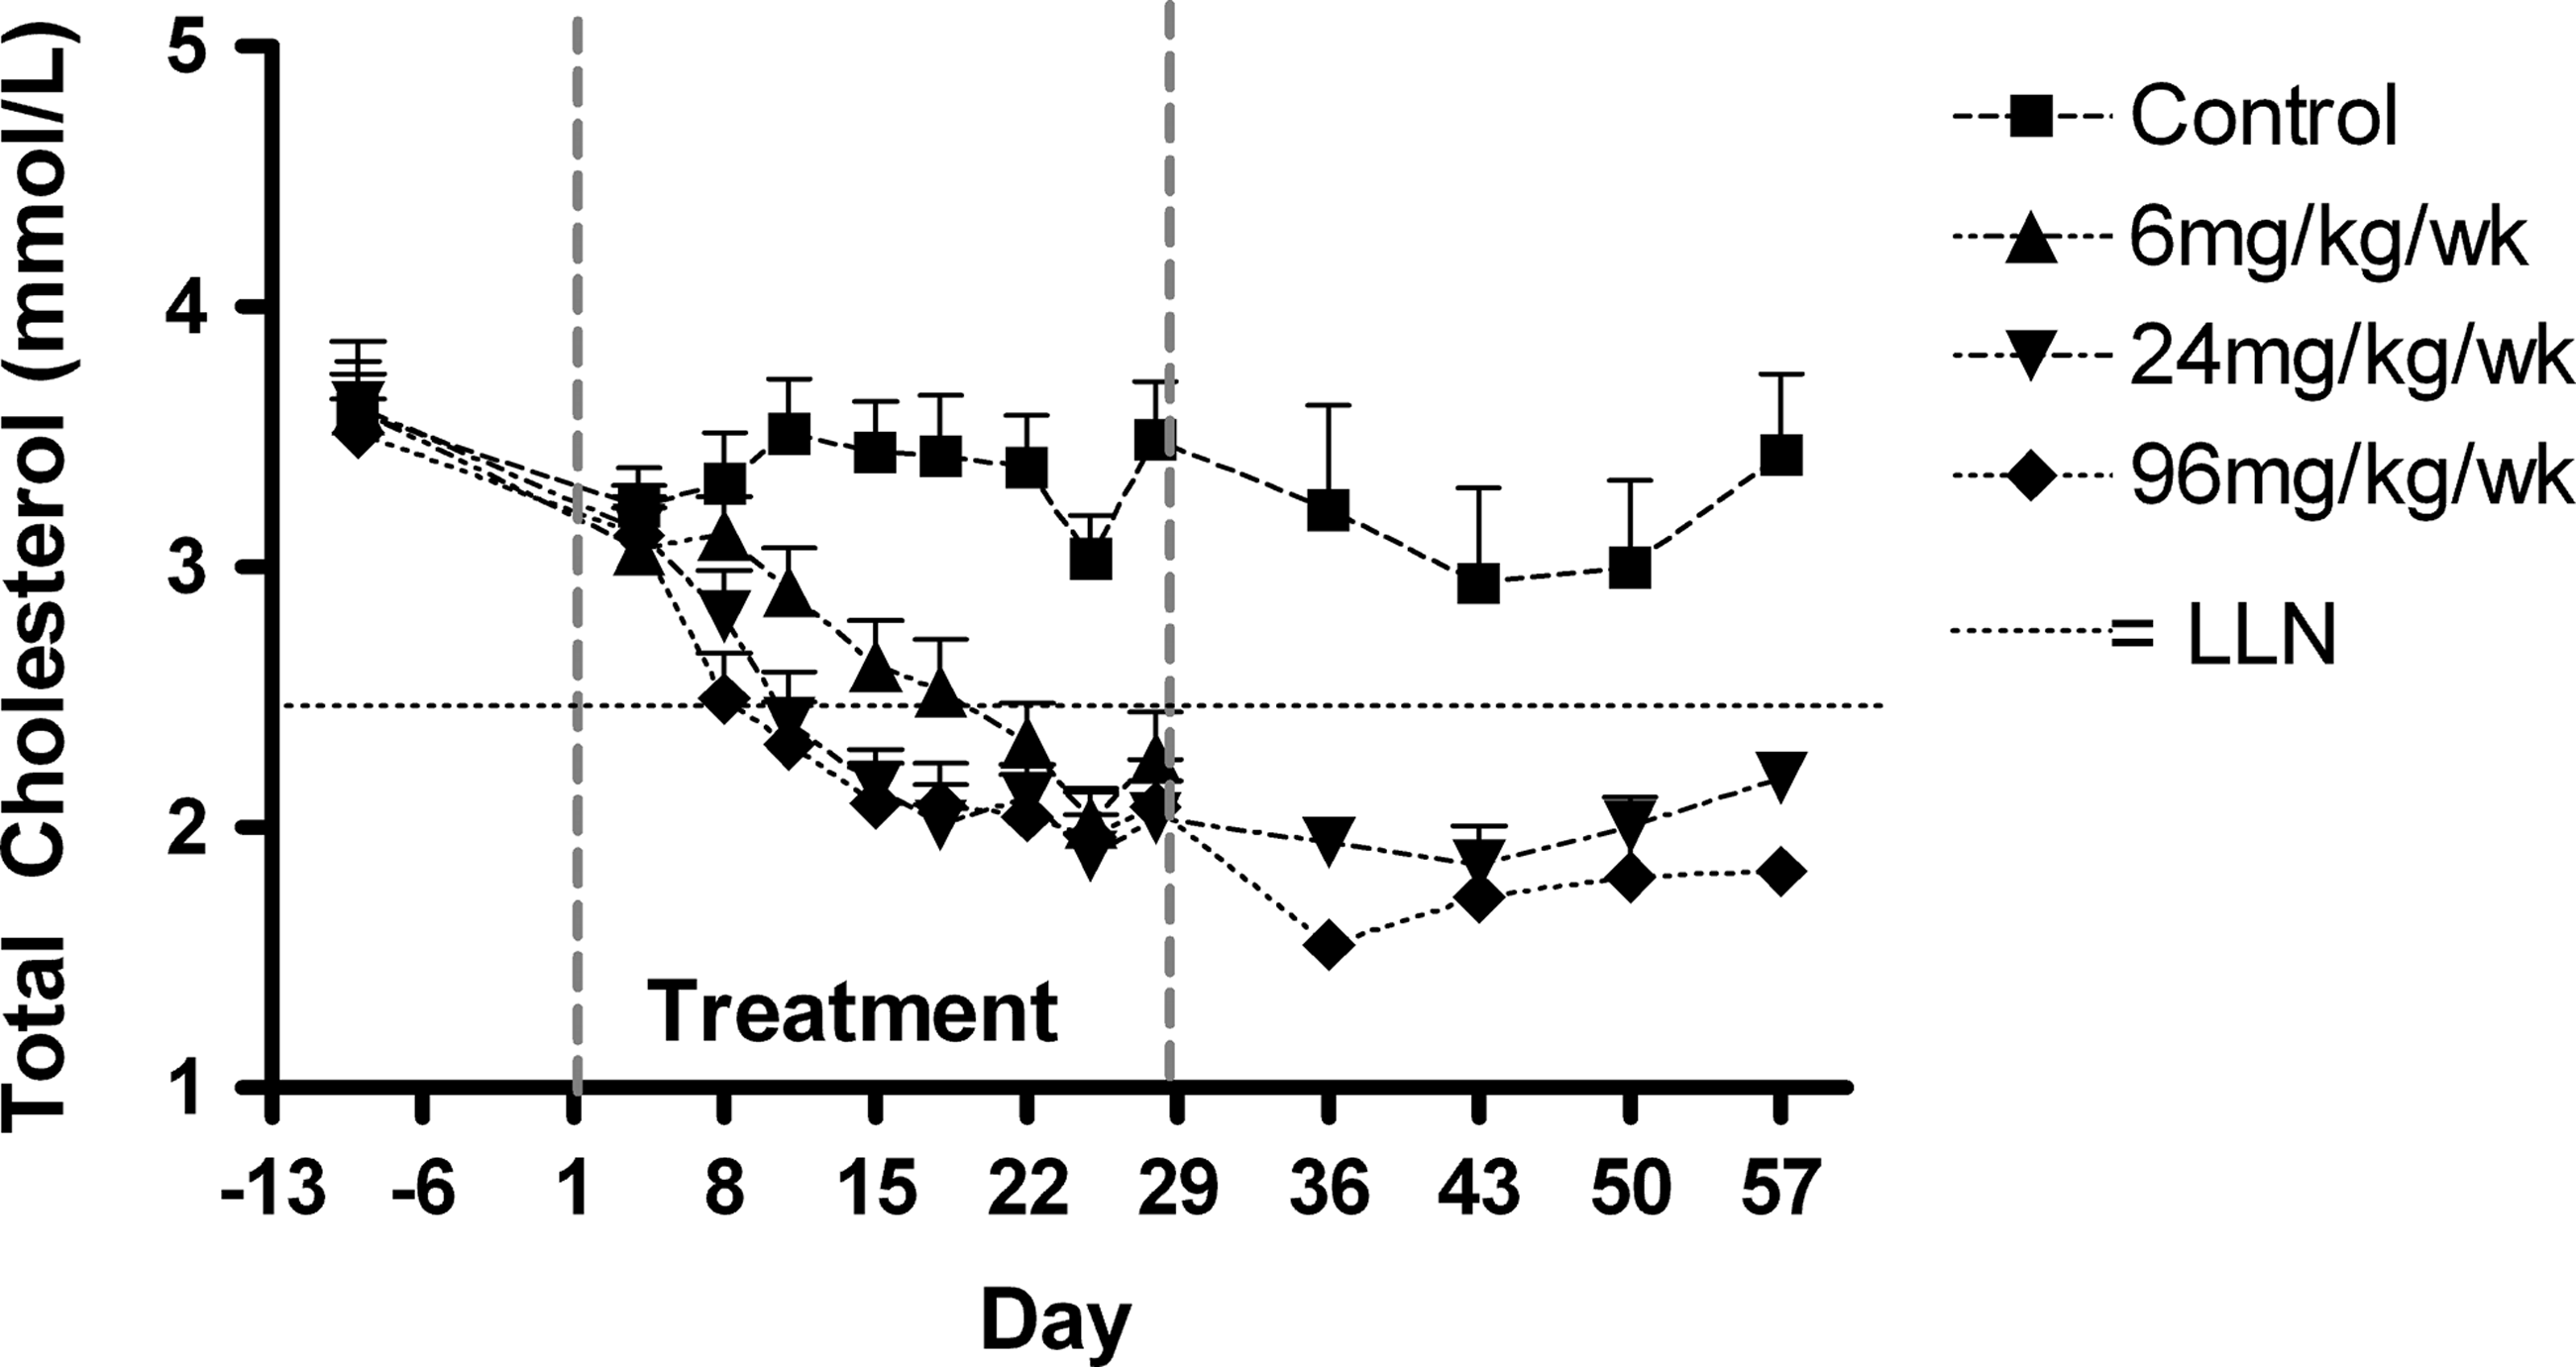
Concentrations (mean±standard error of the mean [SEM]) of total serum cholesterol. Animals per group N=6 (6 mg/kg/week) or N=10 (other dose groups) during the treatment phase and N=4 during the recovery phase. LLN=lower limit of normal range, approximated for both sexes.
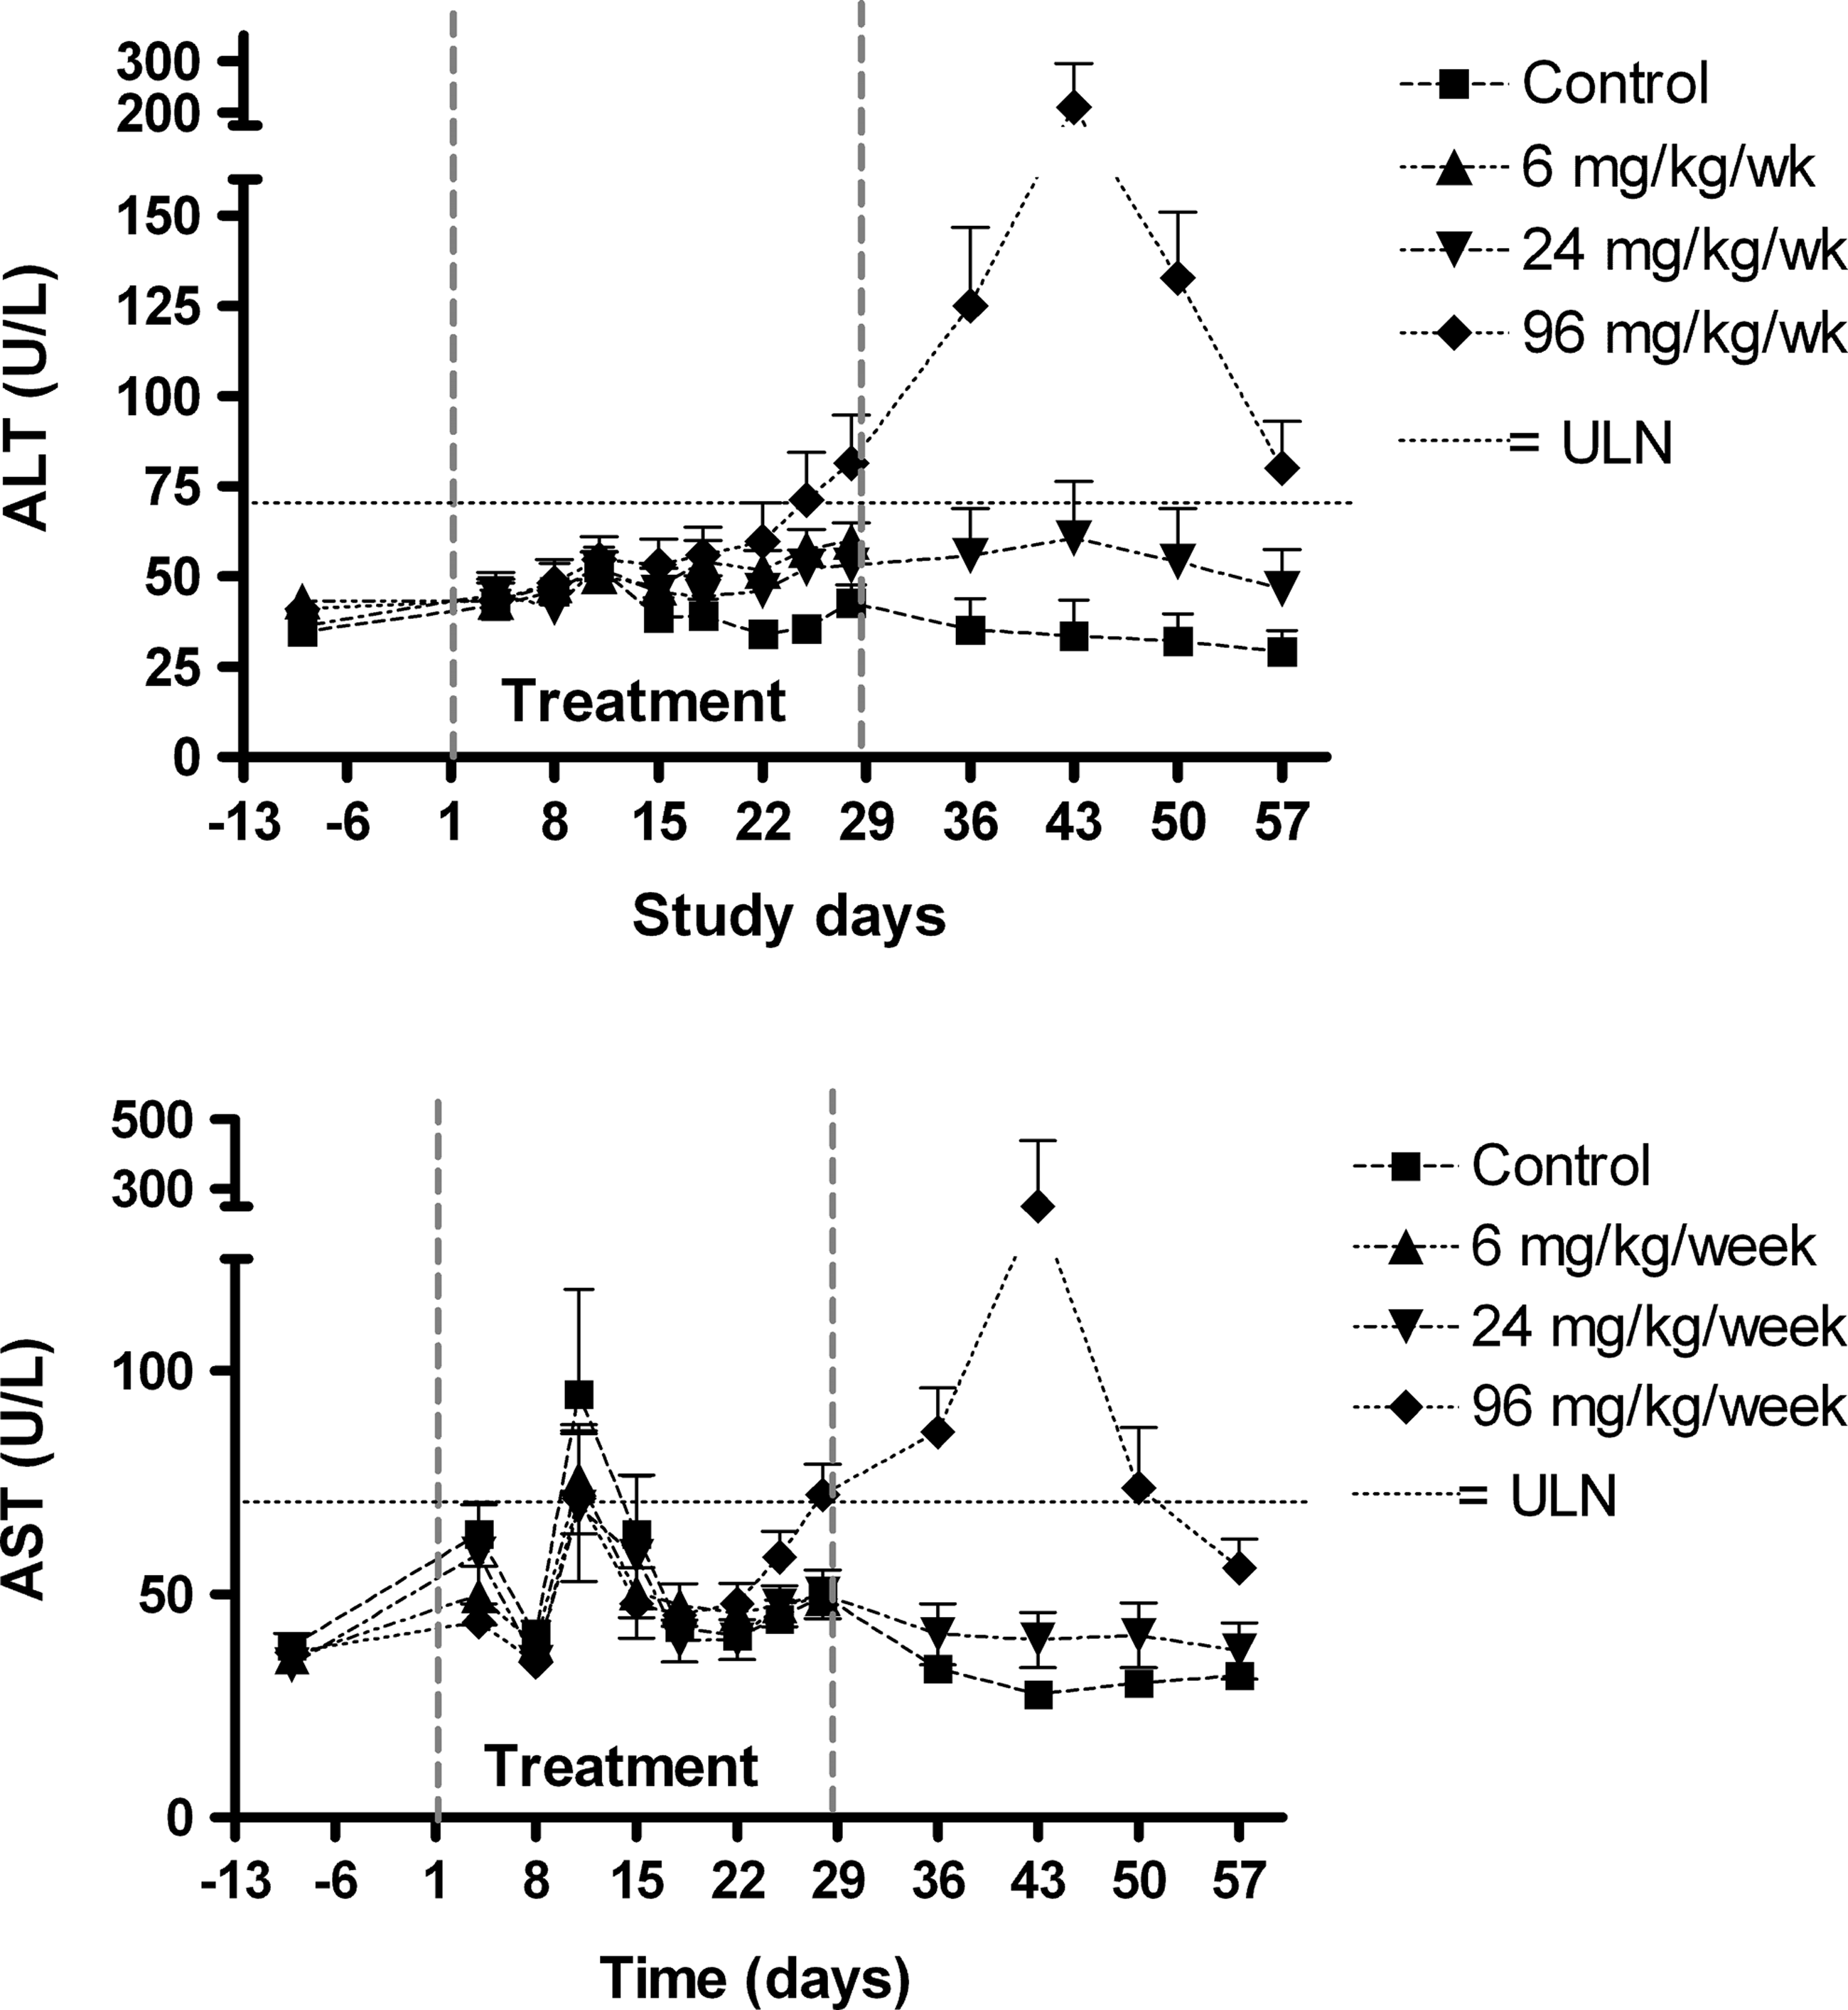
Concentrations (mean±SEM) of alanine aminotransterase (ALT) and aspartate aminotransterase (AST). Animals per group N=6 (6 mg/kg/week) or N=10 (other dose groups) during the treatment phase and N=4 during the recovery phase. ULN=upper limit of normal range, approximated for both sexes.
Coagulation
In monkeys treated with 24 and 96 mg/kg/week, the administration of miravirsen caused short-lived prolongations of activated partial thromboplastin (APTT) and prothrombin times (PT) linked to Cmax in plasma. This had previously been observed in monkeys treated with a DNA phosphorothioate oligonucleotide (Henry et al., 1997b). The levels, however, were indistinguishable from those of controls in less than a day (Fig. 5).
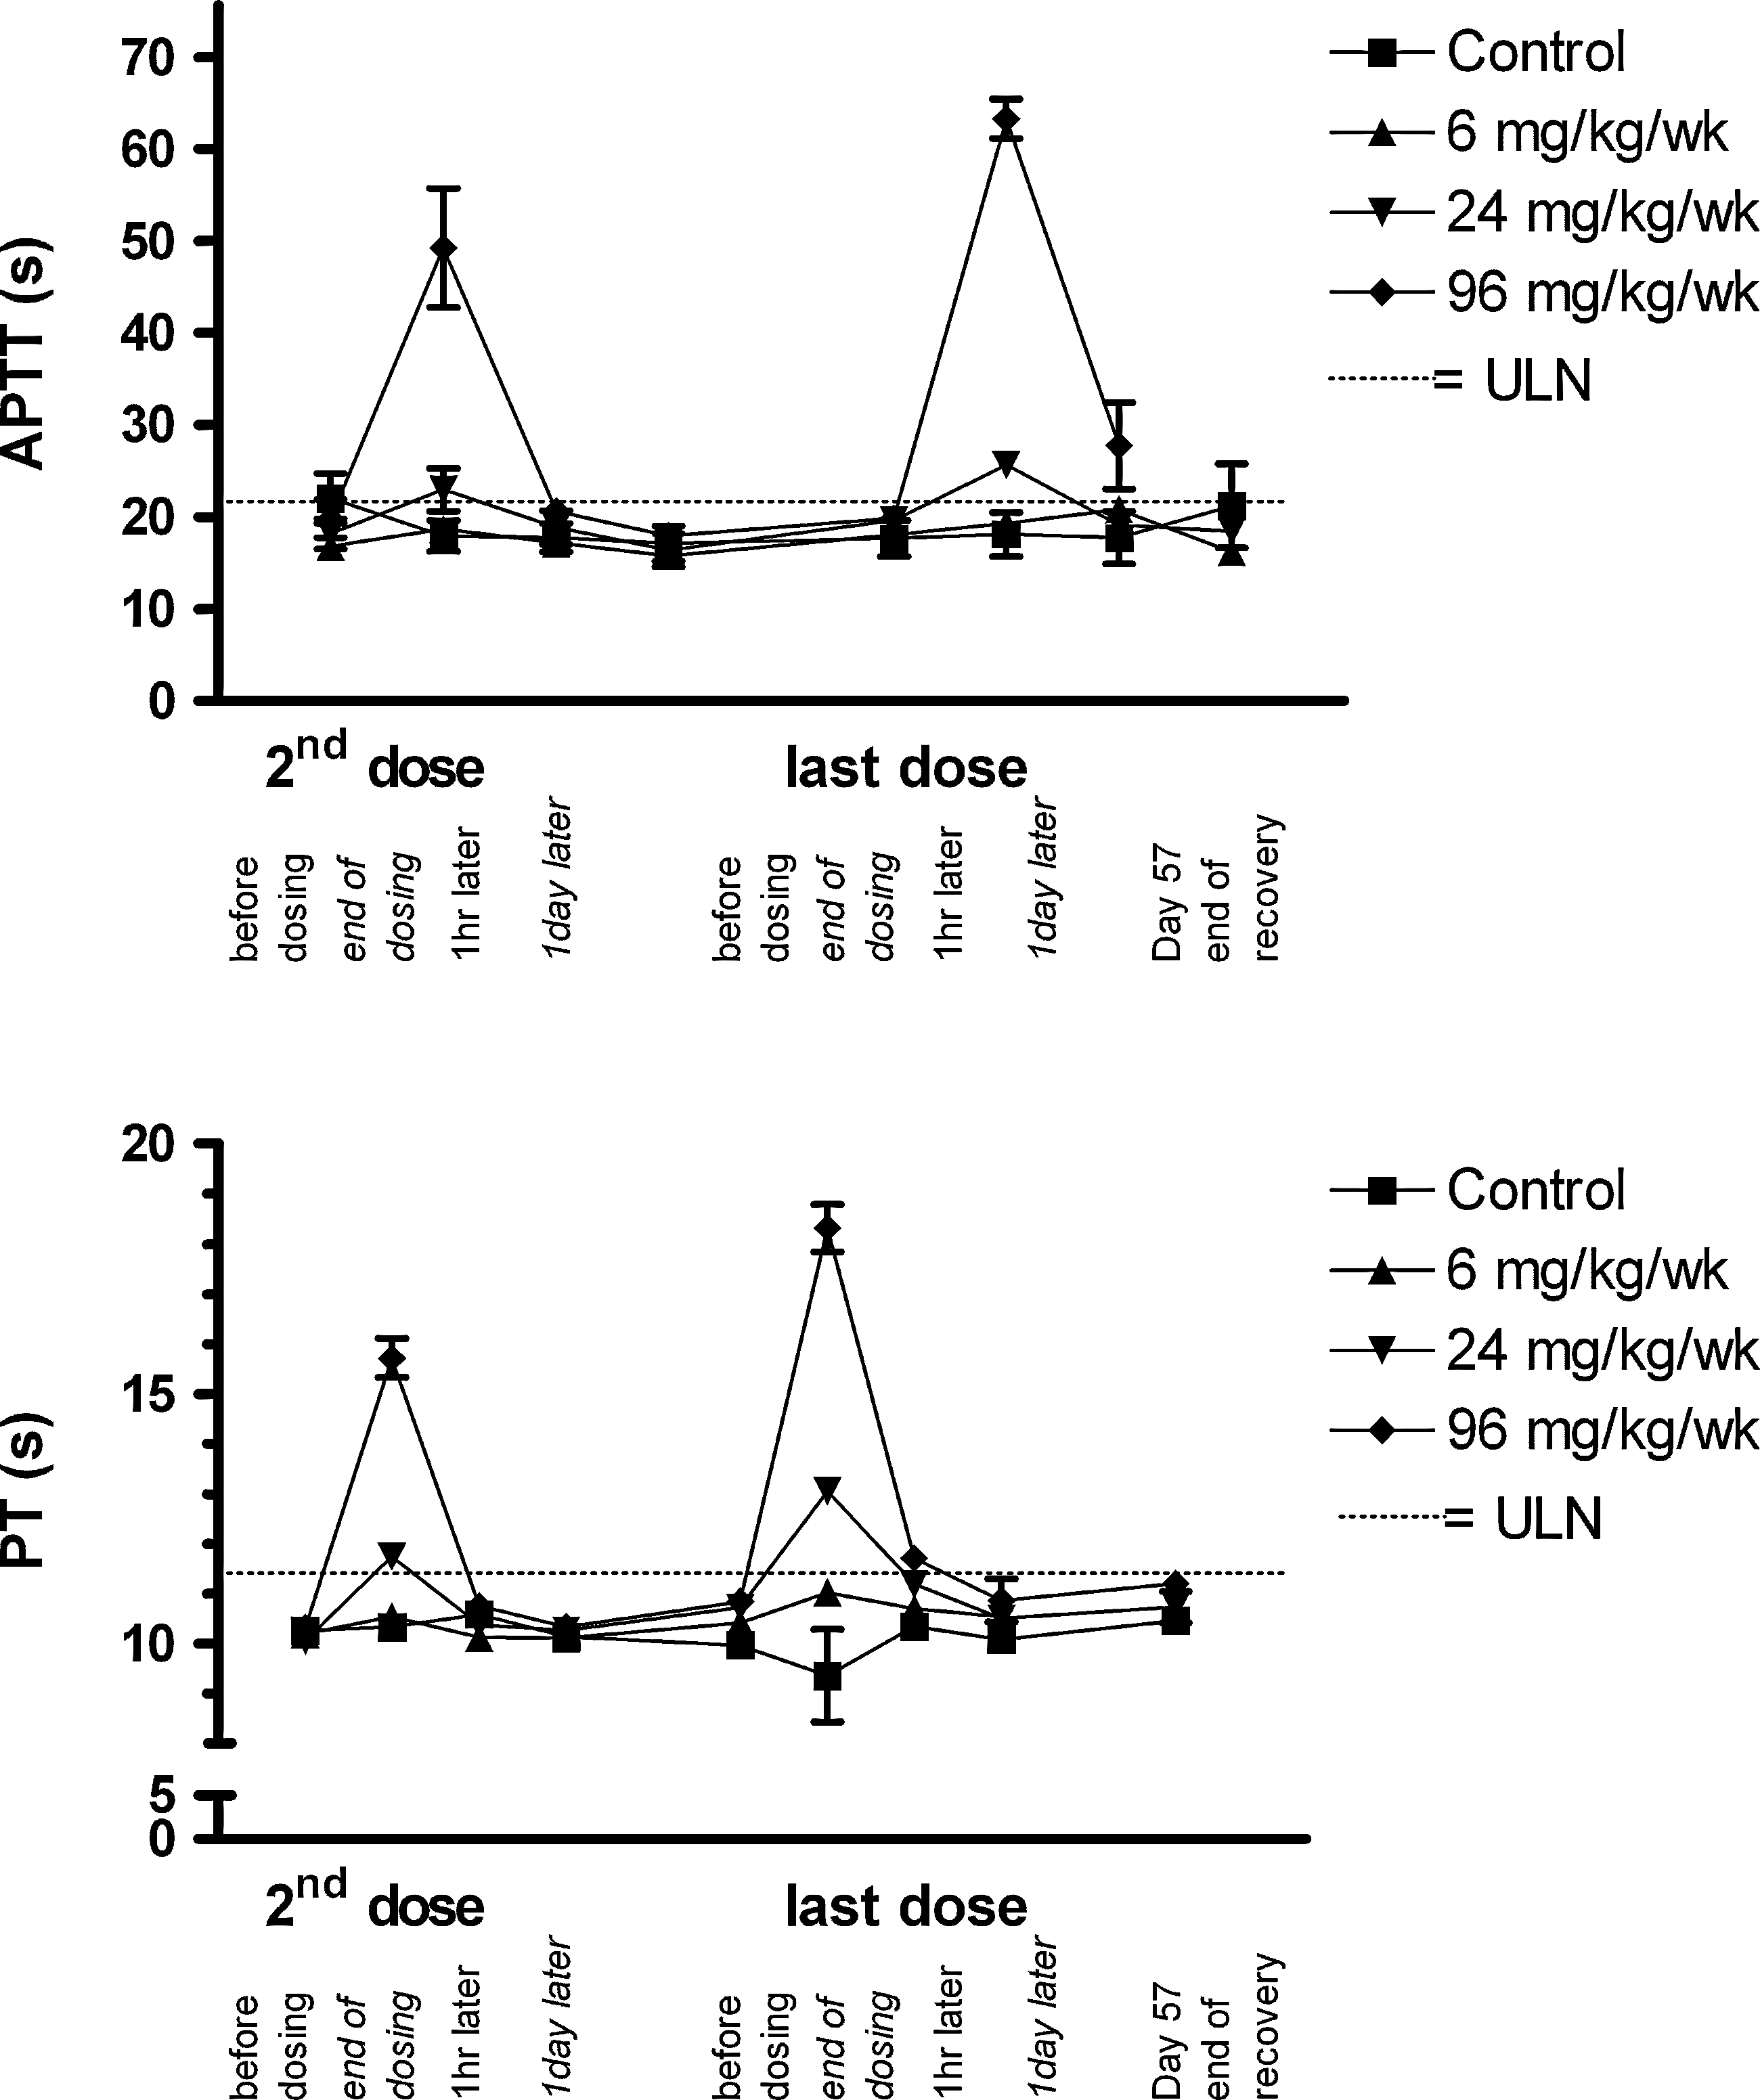
Concentrations (mean±SEM) of activated partial thromboplastin (APTT) and prothrombin times (PT). Animals per group N=6 (6 mg/kg/week) or N=10 (other dose groups) during the treatment phase and N=4 during the recovery phase.
Complement activation
There were no treatment-related elevations in Bb or C3a split products after the first administration of miravirsen. No evidence of complement activation was observed at any time during the dosing period in low- and mid-dose group animals (Fig. 6). On study day 25 (first dose of week 4), mean Bb and C3a fragment concentrations were elevated by ∼25% in monkeys dosed with 96 mg/kg/week relative to concentrations in controls but were still within the normal range as was also observed in a study with a DNA phosphorothioate oligonucleotide (Henry et al., 1997a). The administration of 48 mg/kg of miravirsen on day 25 resulted in an approximate doubling of mean split product concentrations 1 hour after the cessation of dosing. This increase may have been elicited, at least partially, by stress rather than miravirsen treatment, as most control animals showed slight transient elevations in the Bb split product. During the recovery period, there was an increase in both the C3a and Bb levels in some previously treated animals. This increase was likely unrelated to miravirsen treatment, as miravirsen plasma levels were low at the time, and oligonucleotide-induced complement activation is linked to Cmax in the plasma (Henry et al., 1997a). On day 57, mean values were similar in the treated and control groups.

Concentrations (mean±SEM) of complement split products C3a and Bb. Animals per group N=6 (6 mg/kg/week) or N=10 (other dose groups) during the treatment phase and N=4 during the recovery phase.
Organ weights and macroscopic appearance
No apparent organ weight differences were found between the treated groups and controls. There was, however, a trend toward an increase in mean liver weights in monkeys dosed with 96 mg/kg/week on study day 29. Mean absolute (Fig. 7) and relative liver weights in monkeys sacrificed after the recovery period were dose dependently higher than those of the controls. Some treatment-attributable macroscopic changes were observed during necropsy. At sacrifice on day 29, monkeys dosed with 96 mg/kg/week exhibited a higher incidence of pale discoloration of their kidneys and livers. The discoloration in kidney did, in some animals, correlate with renal tubular vacuolation (see next); however, hepatocyte vacuolation lacked dose dependence.
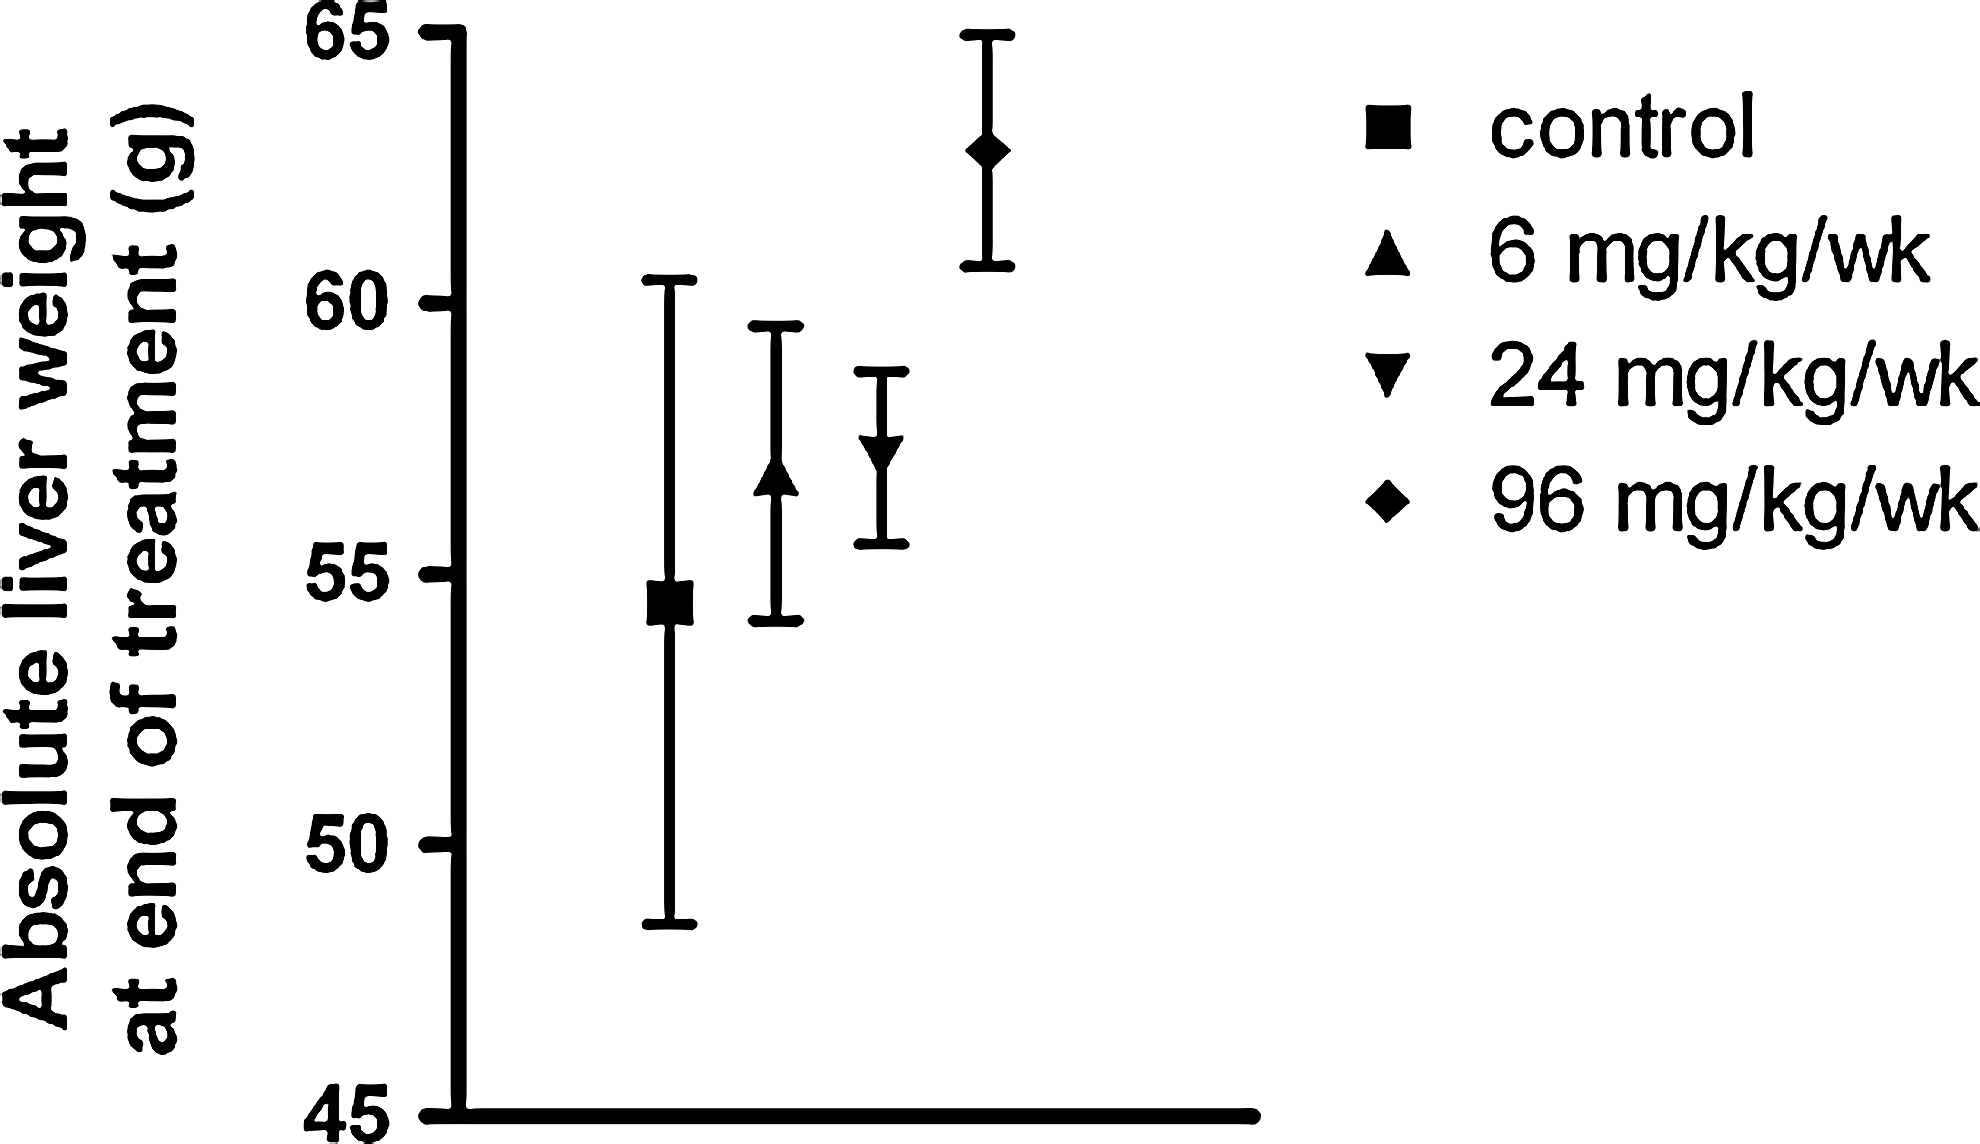
Absolute liver weight (mean±SEM) at the end of treatment day 29. Animals per group N=6 (6 mg/kg/week) or N=10 (other dose groups).
Microscopic changes
The most prominent microscopic change was the accumulation of basophilic granular material, assumed to be miravirsen, in the cells of various tissues. The magnitude of accumulation was clearly dose related (Table 4). Livers from 2 animals dosed with 24 mg/kg/week and all animals administered 96 mg/kg/week sacrificed at day 29 had minimal to slight Kupffer cell hypertrophy, and granular material was present. Hepatocytic cytoplasmic changes (eosinophilia, cellular hypertrophy, and ground glass appearance), although not dose related, were present in some animals from all treated groups at day 29. In monkeys sacrificed after the recovery period, there was a slight reduction in the incidence and intensity of Kupffer cell hypertrophy and granule deposition compared with those sacrificed on day 29. Hepatocyte apoptosis, minimally increased above the background, occurred in 3 out of 6 96 mg/kg/week animals on day 29 and in 1 out of 4 on day 57, indicating the reversibility despite the high liver content of miravirsen.
Similar to the phagocytically active Kupffer cells in the liver, the proximal renal tubule cells concentrate oligonucleotides, observed microscopically as basophilic granules (Monteith et al., 1999). Oligonucleotides, similar to other water-soluble materials, can be washed out during histological processing, giving the appearance of vacuolated cytoplasm. In 5 of the 6 monkeys in the 96 mg/kg/week group sacrificed at the end of the treatment period, renal tubular cell vacuolation was observed. A single monkey treated with 6 mg/kg/week was similarly affected. These changes were also present after the recovery period in 3 monkeys in the 2 higher dose groups, but the severity was less, suggesting that this effect diminished as the drug was cleared.
Submucosal granular deposits with an appearance consistent with drug accumulation were observed in the urinary bladders of 3 of the 6 monkeys in the 24 mg/kg/week group and in all monkeys in the 96 mg/kg/week dose group at the end of the dosing period along with a single animal from this group at day 57. Similar deposits were observed in the ileal submucosa of a single animal in the 6 mg/kg/week group and in 2 animals of the 24 mg/kg/week group on day 29.
Dose-related infiltrations of vacuolated macrophages were observed in the mesenteric lymph nodes of all the treated animals. A similar infiltration into mandibular nodes was observed. Lymph node vacuolation persisted through the recovery period.
Discussion
The miR-122 antagonist miravirsen is an oligonucleotide containing LNA residues (Elmen et al., 2008a). The LNA residues provide high affinity and nuclease resistance. Antagonism of miR-122 by the systemic administration of miravirsen results in hypolipidemia (Elmen et al., 2008b), as expected due to the role of miR-122 in the regulation of the expression of genes involved in cholesterol, fatty acid, and lipid metabolism (Krutzfeldt et al., 2005; Esau et al., 2006; Elmen et al., 2008b). This study concentrated on characterizing the effects associated with the administration of miravirsen to cynomolgus monkeys at several dose levels, also well beyond those required for the maximal inhibition of miR-122 as suggested by the saturation of effect on serum total cholesterol and by the pharmacological effect in other species (Elmen et al., 2008b; Lanford et al., 2010).
Twice weekly slow bolus intravenous injections of pharmacologic and supra-pharmacologic dose levels of miravirsen for 4 consecutive weeks were well tolerated by cynomolgus monkeys. The hypolipidemic response was obvious at all dose levels, was dose related, and continued through the 4-week recovery phase. Interestingly, the speed of onset and magnitude of the response was virtually identical between the 24 and 96 mg/kg/week dose groups and was slightly delayed in the 6 mg/kg/week dose level group, indicating a maximal pharmacology close to the 6 mg/kg dose level. The persistence of the pharmacologic effect during the recovery period was consistent with the slowly declining hepatic concentration of the drug during the treatment-free period and the possible further delay for miR-122-related pathways to re-normalize.
Toxicokinetic analysis revealed multi-phasic pharmacokinetics. The early phase of plasma clearance reflected the re-distribution of miravirsen from plasma to peripheral depots. The kidney and liver contained high concentrations of miravirsen; this concentration in target organs was similar to the distribution of other phosphorothioate-containing oligonucleotides previously observed (Henry et al., 2007). The accumulation of miravirsen and miR-122 expression in the liver supports the use of this drug in anti-HCV treatment. The long elimination half-lives for the liver and kidney (∼37 and 20 days, respectively) make these organs potential targets for toxicity. In this study, there was no evidence of toxicity in the livers or kidneys of monkeys dosed at 6 or 24 mg/kg/week. The minimal changes observed in animals dosed at 96 mg/kg/week were most likely secondary to the accumulation of the drug in the kidneys and liver, were of a minimally degenerative nature, and were partly reversible over 4 weeks.
The pharmacotoxicologic profile of miravirsen in monkeys yielded results in line with the “class-related” effects ascribed to earlier-generation oligonucleotides. The majority of toxicologic properties of first- and second-generation oligonucleotides [phosphorothioate and 2′-O-methoxyethyl (2′-MOE) phosphorothioate oligonucleotides, respectively] are similar and largely independent of nucleotide sequence (Henry et al., 2007). Similar to the treatment of monkeys with other oligonucleotide drugs, miravirsen treatment caused a small, dose-related, and transient prolongation of APTT values. These prolongations are probably mediated by a reversible interaction between the oligonucleotide and components of the intrinsic tenase complex (Sheehan and Lan, 1998; Sheehan and Phan, 2001). A similar mechanism is assumed to cause APTT increases on the treatment of animals with 2′-MOE phosphorothioate oligonucleotides (Henry et al., 2007). We observed smaller and less persistent increases of PT than those observed for other phosphorothioate oligonucleotides (reviewed in Levin et al., 2001). Such marginal and short-lived changes are unlikely to be associated with adverse effects in clinical trials, as no macro- or microscopic evidence of hemorrhagic changes was observed at the necropsy of any animals treated with miravirsen.
Alternative complement pathway activation, a class effect related to peak concentrations (Cmax), was observed to a very low extent on day 25, but not on day 1, in monkeys dosed with 96 mg/kg/week of miravirsen. Henry et al. (1997a) reported that activation of the simian alternative pathway of complement by a phosphorothioate oligonucleotide was dose dependent with abrupt increases in plasma Bb appearing only after the plasma drug concentrations exceeded 50 μg/mL. In our investigation, day 1 plasma concentrations of miravirsen ranged from ∼100 to 500 μg/mL. Thus, the threshold plasma concentration for miravirsen-induced activation of the alternative pathway in the monkey was significantly higher than that of earlier-generation oligonucleotides. We are unable to explain why miravirsen was without effect on day 1 but comparable plasma concentrations were activated on day 25. It should be emphasized, however, that complement activation was observed sporadically, and may be related to stress due to handling or to low-grade infection. The low levels of complement activation in connection with infusions were without clinical consequences and were generally within the bounds of normal values.
In addition, acute toxicities (lethargy, susceptibility to bruising, and acute deaths) and hemodynamic changes (central hypotension and reduced cardiac output) have been associated with phosphorothioate oligonucleotide-induced complement activation in monkeys (Galbraith et al., 1994; Henry et al., 2002). However, in the current study, the daily monitoring of clinical signs and cardiovascular assessments before and after the second and ninth doses presented no evidence of acute or hemodynamic changes. Beyond the transient and slight activation of the alternative pathway of complement and coagulation changes, we observed no evidence of treatment-related effects, which have been commonly associated with, especially intravenous, oligonucleotide treatment (Levin et al., 2001; Henry et al., 2007).
Histopathological observations, including increased vacuolated macrophages in lymph nodes (Henry et al., 1997c) and granular cells in the submucosa of the urinary bladder and ileum, were characteristic of repeat dose regimens with other antisense oligonucleotides. Kupffer cells concentrate oligonucleotides in lysosomal bodies, which after fixation and processing give the appearance of basophilic granules and/or vacuolation. Oligonucleotide treatment may also cause Kupffer cell hypertrophy with the presence of basophilic granules and renal tubular granular vacuolation. These changes are reflective of accumulation of the drug in peripheral tissues during their redistribution from plasma (Henry et al., 1999). In this study, although kidney and liver depots of miravirsen persisted throughout the treatment-free recovery period, the magnitudes of both the storage and the storage-associated cellular changes were lower on day 57 than they were on day 29. The submucosal deposits in the urinary bladder epithelium observed on day 29 had also disappeared by day 57.
As was the case with complement activation, treatment-associated changes in serum transaminases were only a high-dose event in this study. Increases in serum transaminases during the dosing period appeared only near its end and at the highest dose level given; concentrations of both transaminases remained elevated at the end of the recovery period, consistent with the high miravirsen tissue concentrations at the time. The increases in transaminase followed a similar time course as reductions in plasma lipids and might be related to cholesterol lowering (Sankatsing et al., 2005).
Due to the function of the targeted miR-122 and the known deposition of phosphorothioate oligonucleotides in the liver, we thoroughly assessed hepatic structure and function. Microscopic examination of livers from monkeys sacrificed at the end of the treatment period revealed little evidence of treatment-associated degenerative cellular changes. Although transaminase increases occurred, other serum chemistry indicators of hepatobiliary function such as bilirubin, GGT, and LDH remained within normal ranges. One of the 4 monkeys treated with 96 mg/kg/week exhibited minimally increased hepatocellular apoptosis at the end of the recovery period compared with 3 of the 6 monkeys at the end of the treatment period, indicating reversibility. Taken together, this leads us to conclude that even at the highest dose level, the antagonism of miR-122 was not hepatotoxic despite the persisting liver stores of miravirsen throughout the recovery period.
Conclusion
In conclusion, high doses of miravirsen, an antagonist to miR-122, administered repeatedly for 4 weeks, did not markedly alter the hepatic function outside the expected pharmacologic effects on cholesterol levels. The highest dose level administered is far above the dose levels proposed for phase 2 studies with miravirsen (http://clinicaltrials.gov). That miR-122 inhibition produced pharmacology in the absence of toxicity was recently demonstrated in chimpanzees chronically infected with HCV. Weekly doses of 5 mg/kg reduced viral burdens by 2.6 logs and reduced plasma cholesterol levels in the absence of significant adverse effects (Lanford et al., 2010). Thus, it is possible to inhibit miR-122 without markedly affecting liver morphology or function. These data suggest that targeting miR-122 with an antagonist similar to miravirsen is a viable way of modulating the host/virus relationship in HCV.
Footnotes
Acknowledgments
This work was supported by a grant (271-05-0369) from the Danish National Advanced Technology Foundation and by Santaris Pharma A/S. The authors gratefully acknowledge the scientific and editorial assistance of Arthur A. Levin, Ph.D., Yann Tessier, D.V.M., M.Phil., Jacqueline Wyatt, Ph.D., and John H. Mennear, Ph.D.
Author Disclosure Statement
All authors are or have been employees of Santaris Pharma A/S, and, therefore, are receiving or have received salaries and own warrants and/or shares in the Company.