
Abstract
MicroRNAs (miRNAs) might behave as tumor suppressors and for that they are under consideration as novel therapeutic drugs. We tested the tumor suppressor activity of miRNA-34a (miR-34a) by measuring cell proliferation of the follicular lymphoma cell line DoHH2 transfected with this miRNA. We report that miR-34a did not inhibit cell proliferation notwithstanding a marked down-regulation of c-MYC. Interestingly, DoHH2 transfected cells showed a significant p53 down-regulation, suggesting that c-MYC positively controls p53 and the failed inhibition of cell proliferation is probably due to the down-regulation of the c-MYC/p53 axis. In keeping with this, c-MYC silencing also down-regulated p53 and had no effect on cell proliferation. In accordance with this hypothesis, etoposide or nutlin-3 treatment or a small interfering RNA (siRNA) against BCL6 (B-cell lymphoma 6) inhibited the proliferation of DoHH2 cells by up-regulating p53 without affecting either miR-34a or c-MYC levels. These results indicate that the proliferation is controlled by the regulatory axis c-MYC/p53 and suggest that paradoxically miR-34a behaves as a pro-proliferative rather than an anti-proliferative miRNA in DoHH2 cells.
Introduction
Lymphomas are a broad and complex group of cancers and follicular lymphoma (FL) is the second most common B-cell malignancy (Leich et al., 2011). Follicular lymphoma cell line DoHH2 cell line derives from a FL and like most FL abnormally expresses BCL6 (B-cell lymphoma 6) protein (Leich et al., 2011) and has a wild type p53 (Knoops et al., 2007). Interestingly, DoHH2 cells are characterized by a c-MYC rearrangement that causes its over-expression (Dyer et al., 1996). As miR-34a directly controls c-MYC (Christoffersen et al., 2010), the genetic context of DoHH2 cells seemed appropriate to test whether miR-34a behaves as tumor suppressor miRNA.
In this work we report that the over-expression of miR-34a was unable to inhibit the proliferation of DoHH2 cells as it down-regulated the axis c-MYC/p53 that is fundamental in the control of DoHH2 cell proliferation.
Materials and Methods
Cells and culture conditions
DoHH2 cells (kindly provided by J Goly, Ospedali Riuniti, Bergamo) and HCT116 Dicer–/– cells (Genetic Resources Core Facility, Johns Hopkins University) were grown respectively in RPMI 1640 and Dulbecco's modified Eagle medium supplemented with 10% fetal bovine serum, 2 mM
Transfection
Exponentially growing DoHH2 cells were transfected with 50 nM miRNAs and small interfering RNA (siRNA)s using Amaxa Nucleofector® Device program 0-006 and Nucleofector® Solution V (Lonza). Mature miR-34a (5′ UGGCAGUGUCUUAGCUGGUUG UUU 3′, 5′ ACAACCAGCUAAGACACUGAAAUU 3′), siBCL6 (Phan and Dalla Favera, 2004) and sic-MYC (5′ GAC GAGACCUUCAUCAAAAUU 3′, 5′ UUUUGAUGAAGGU CUCGUCUU 3′) were synthesized by GenePharma (Shanghai, China). A double-stranded oligonucleotide, named either miR-negative control (NC) or siNC (5′ UUCUCCGAACGUGUCACGUTT 3′, 5′ ACGUGACACGUUCGGAGAATT 3′) (GenePharma), was used as negative control. After nucleofection the cells were distributed in culture flask and collected at specified time points to detect cellular and molecular end points.
Cell treatments
DoHH2 cells were seeded at cell density of 1×10⁵ per milliliter. After overnight incubation, culture medium was replaced with medium containing either 10μM etoposide (SIGMA) or 5μM Nutlin-3 (SIGMA). At specified time points cells were collected, washed, counted, and used for cellular and molecular assay.
Real-time polymerase chain reaction analysis
Total RNA was extracted from 2×10⁶ cells using the miRNeasy mini kit (Qiagen) following the manufacturer's recommendations. To quantify BCL6, p53, c-MYC, and p21 transcripts, 1 μg of total RNA was reverse transcribed using QuantiTect Reverse Transcription Kit (Qiagen). Real-time polymerase chain reaction (qRT-PCR) was carried out with LightCycler 480 (Roche) using LightCycler 480 SYBR Green I Master (Roche). Mature miR-34a was quantified using the miScript System: 1 μg of total RNA was retrotranscribed with miScript Reverse Transcription Kit (Qiagen) and qRT-PCR was carried out using miScript SYBR Green PCR Kit (Qiagen). All reactions were performed in triplicate. Relative quantification of gene expression was calculated with the fit point method. Transcript values were normalized with those obtained from the amplification of the internal controls (glyceraldehyde-3-phosphate dehydrogenase for transcripts and U6 for mR-34a). The oligonucleotide sequences are reported in Supplementary Table S1 (Supplementary Data are available online at www.liebertpub.com/nat).
Western blot analysis
Proteins (30 μg/lane) were resolved on 8% sodium dodecyl sulfate polyacrylamide gel electrophoresis gels and transferred to Hybond-C extra membranes (Amersham Biosciences) by electro blotting. The resulting blots were blocked with 5% nonfat dry milk solution. Anti-ß actin, anti-p53, anti-BCL-6, anti-c-MYC, anti-SIRT1, anti-BCL2, and anti-p21 primary antibodies (Santa Cruz Biotechnologies) were used. Incubation was performed overnight at 4°C and bands were revealed after incubation with the recommended secondary antibody coupled to peroxidase using enhanced chemiluminescence (Amersham). Scanned images were quantified using scion Image software and normalized to ß-actin.
EGFP reporter assay
p-BCL6 and p-LRF (leukemia/lymphoma related factor) 3′UTR enhanced green fluorescent protein fluorescent (EGFP) vectors were constructed according to Poliseno and colleagues (Poliseno et al., 2008). HCT116 Dicer–/– cells (Cummins et al., 2006) were co-transfected with either p-BCL6 3′UTR or p-LRF 3′UTR and with either miR-NC or miR-34a using Polyfect (Qiagen) according to the manufacturer's recommendations. Twenty-four hours after transfection, cells were collected and the EGFP fluorescence intensity of each sample was determined with a FACscan analyzer. The relative expression of p-BCL6 or p-LRF was obtained by the ratio of the mean fluorescence value of HCT116 Dicer–/– cells transfected with miR-34a and the mean fluorescence value of HCT116 Dicer–/– cells transfected with miR-NC.
Statistical Analysis
Data were analyzed using GraphPad Prism (GraphPad Software). Statistical differences were determined by unpaired t-test, with values of p<0.05 considered statistically significant (*p<0.05; **p<0.01, ***p<0.001). Each experimental point in the graph represents the mean±standard deviation (SD) of at least 3 independent experiments.
Results and Discussion
The FL cell line DoHH2, which over-expresses both BCL6 and c-MYC and has a wild type p53, was transfected with miR-34a. We found that the transfected cells continue to proliferate well (Fig. 1, panel A, left). Given that miR-34a level increased more than 10-fold in transfected cells (Supplementary Fig. S1, panel A, left; Supplementary Data are available online at www.liebertpub.com/nat) and that its constitutive expression is similar to that of Naïve B cells (Supplementary Fig. S1, panel A, right), one can expect that the transfected miR-34a will be able to inhibit cell proliferation. Indeed, we found that cell proliferation was not inhibited (Fig. 1, panel A, left) and c-MYC, a known miR-34a target (Christoffersen et al., 2010), was down-regulated (Fig. 1, panel A, right). As a further positive control of the effects of the transfected miR-34a, we checked the protein levels of SIRT1 and BCL2, two other known miR-34a targets (HERMEKING, 2010), and found a significant down-regulation of both (Supplementary Fig. S1, panel B). As it has been shown that c-MYC positively controls p53 expression (Chen et al., 2010) we verified whether the expression of p53 and its direct target p21 (Gartel and Tyner, 1999) were modified in miR-34a transfected cells. Interestingly, we found that the expression of p53 was strongly diminished both at the transcriptional (Fig. 1, panel B, left) and post-transcriptional (Fig. 1, panel B, middle) levels and that the down-regulation of p53 was accompanied by reduced transcription of p21 (Fig. 1, panel B, right). By silencing c-MYC (Fig. 1, panel C, left) we found the down-regulation of p53 (Fig. 1, panel C, middle) without effects on cell proliferation (Fig. 1, panel C, right). Overall our data indicate that the expected anti-proliferative activity of the tumor suppressor miR-34a is probably neutralized by the c-MYC-dependent decrease of p53. Our conclusion is reinforced by the recent observation that miR-34a over-expression in B-lymphoid cell lines with c-MYC over-expressed, severely compromised p53 levels, affecting p53 dependent apoptosis (Sotillo et al., 2011).
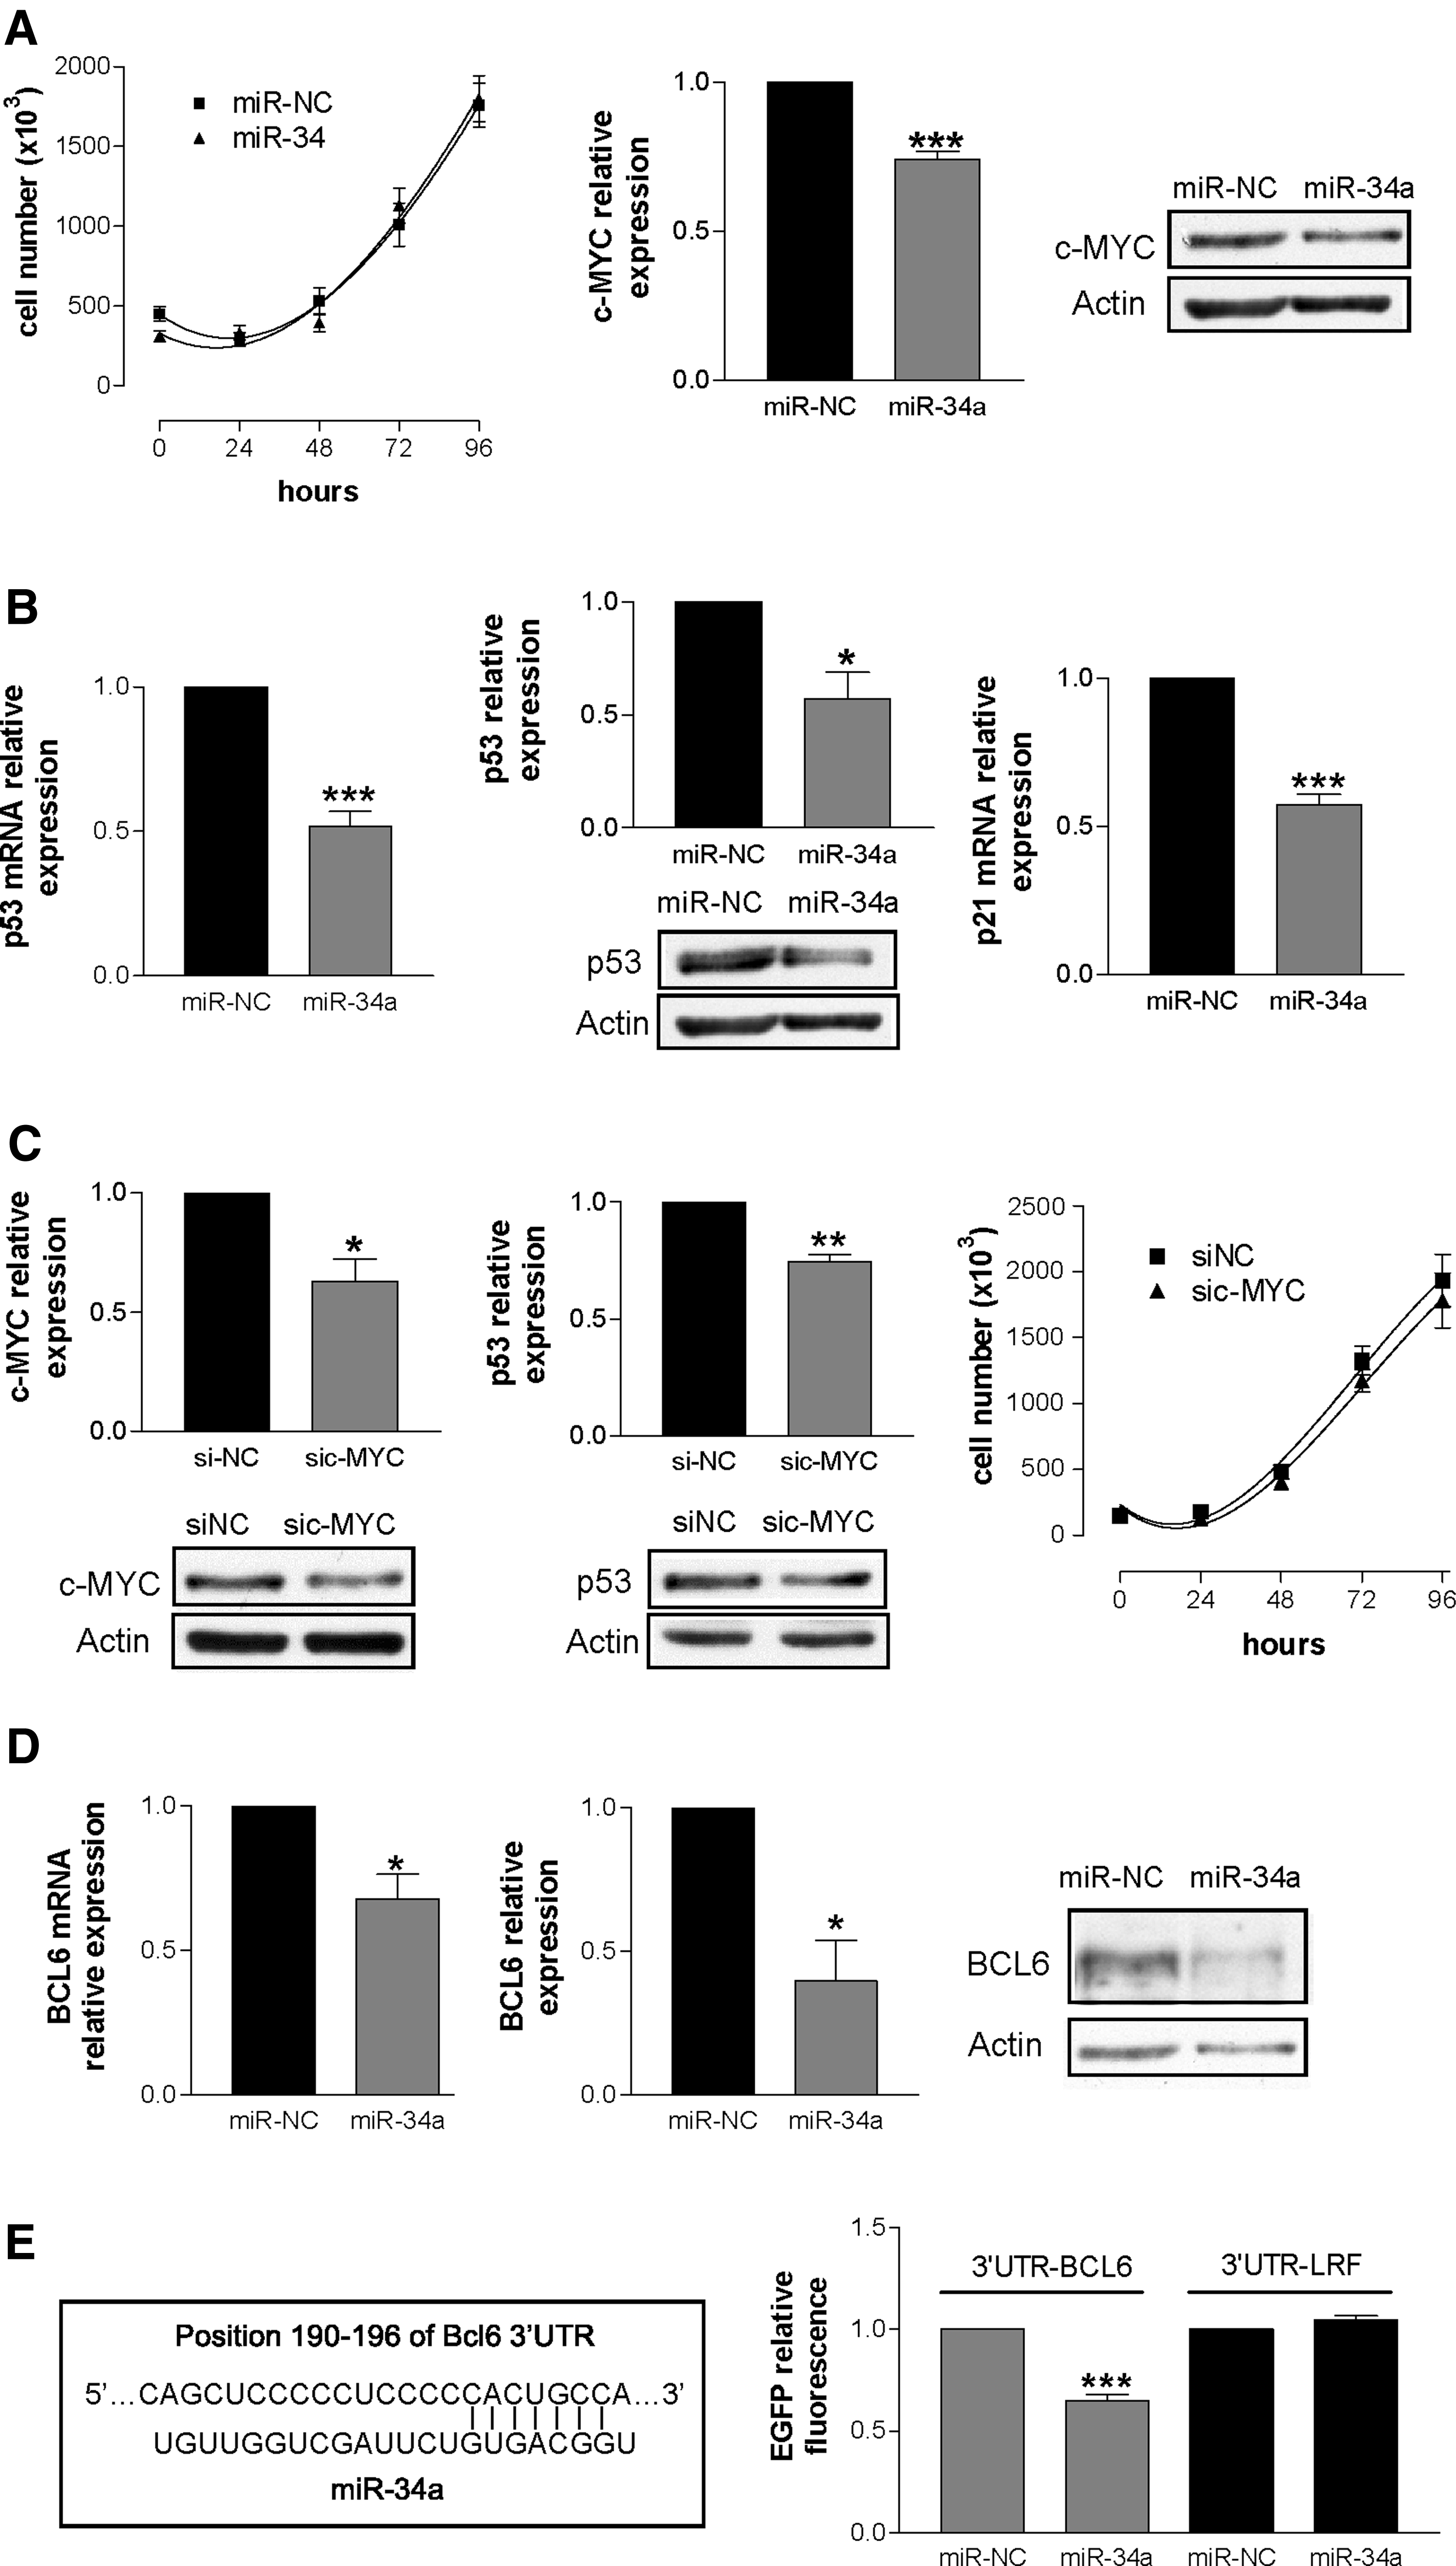
As BCL6 is a transcriptional repressor of p53 and p21 (Phan and Dalla-Favera, 2004; Phan et al., 2005), we cannot exclude that their down-regulation following miR-34a over-expression could be ascribed to enhanced expression of BCL6. We found that BCL6 decreased at both the mRNA (Fig. 1, panel D, left) and protein (Fig. 1, panel D, right) levels in miR-34a transfected cells, suggesting that p53/p21 down-regulation was BCL6-independent.
The finding that BCL6 levels diminished in miR-34a transfected cells prompted us to verify whether BCL6 might be a target of miR-34a. Targetscan prediction algorithm identifies one putative miR-34a binding site within the BCL6 3′UTR (Fig. 1, panel E, left). To validate the prediction we used HCT116 Dicer–/– (Cummins et al., 2006) as recipient cells, since the binding of mature miRNA to the 3′UTR can be detected easily in cells defective in miRNA maturation. HCT116 Dicer–/– cells were co-transfected with p-BCL6 3′UTR and either miR-NC or miR-34a. As negative control the 3′UTR of the unrelated gene p-LRF was co-transfected with either miR-NC or miR-34a in HCT116 Dicer–/– cells. We demonstrated that the interaction between miR-34a and its binding site in the BCL6 3′UTR was direct (Fig. 1, panel E, right), and to our knowledge this is the first evidence that BCL6 is post-transcriptionally regulated by miR-34a.
In a series of experiments, we treated DoHH2 cells with etoposide, a drug known to induce DNA damage and cell cycle arrest and/or apoptosis in Burkitt lymphoma cell lines (Phan and Dalla-Favera, 2004; Phan et al., 2005). The suggested mechanism was an ataxia telangiectasia mutated-ataxia telangiectasia and RAD 3 related dependent pathway activation that leads to the phosphorylation and degradation of BCL6 (Phan et al., 2007). The treatment of DoHH2 cells with etoposide caused a strong inhibition of cell proliferation (Fig. 2, panel A, left), BCL6 down-regulation (Fig. 2, panel A, right) and the induction of both p53 (Fig. 2, panel B, left) and p21 (Fig. 2, panel B, right). It is of note that neither c-MYC (Fig. 2, panel C, left) nor miR-34a (Fig. 2, panel C, right) were affected by this treatment. These results suggest on one hand that the inhibition of DoHH2 cells proliferation is mostly due to the activation of p53 and on the other hand that miR-34a does not appear to be a mediator of p53 anti-proliferative effect. In accordance with the results of etoposide, BCL6 silencing was able to reduce BCL6 (Supplementary Fig. S2, panel A, left), increase p53 levels (Supplementary Fig. S2, panel A, right) without affecting either c-MYC (Supplementary Fig. S2, panel B, left) or miR-34a (Supplementary Fig. S2, panel B, middle) and to induce a partial inhibition of DoHH2 cell proliferation (Supplementary Fig. S2, panel B, right).
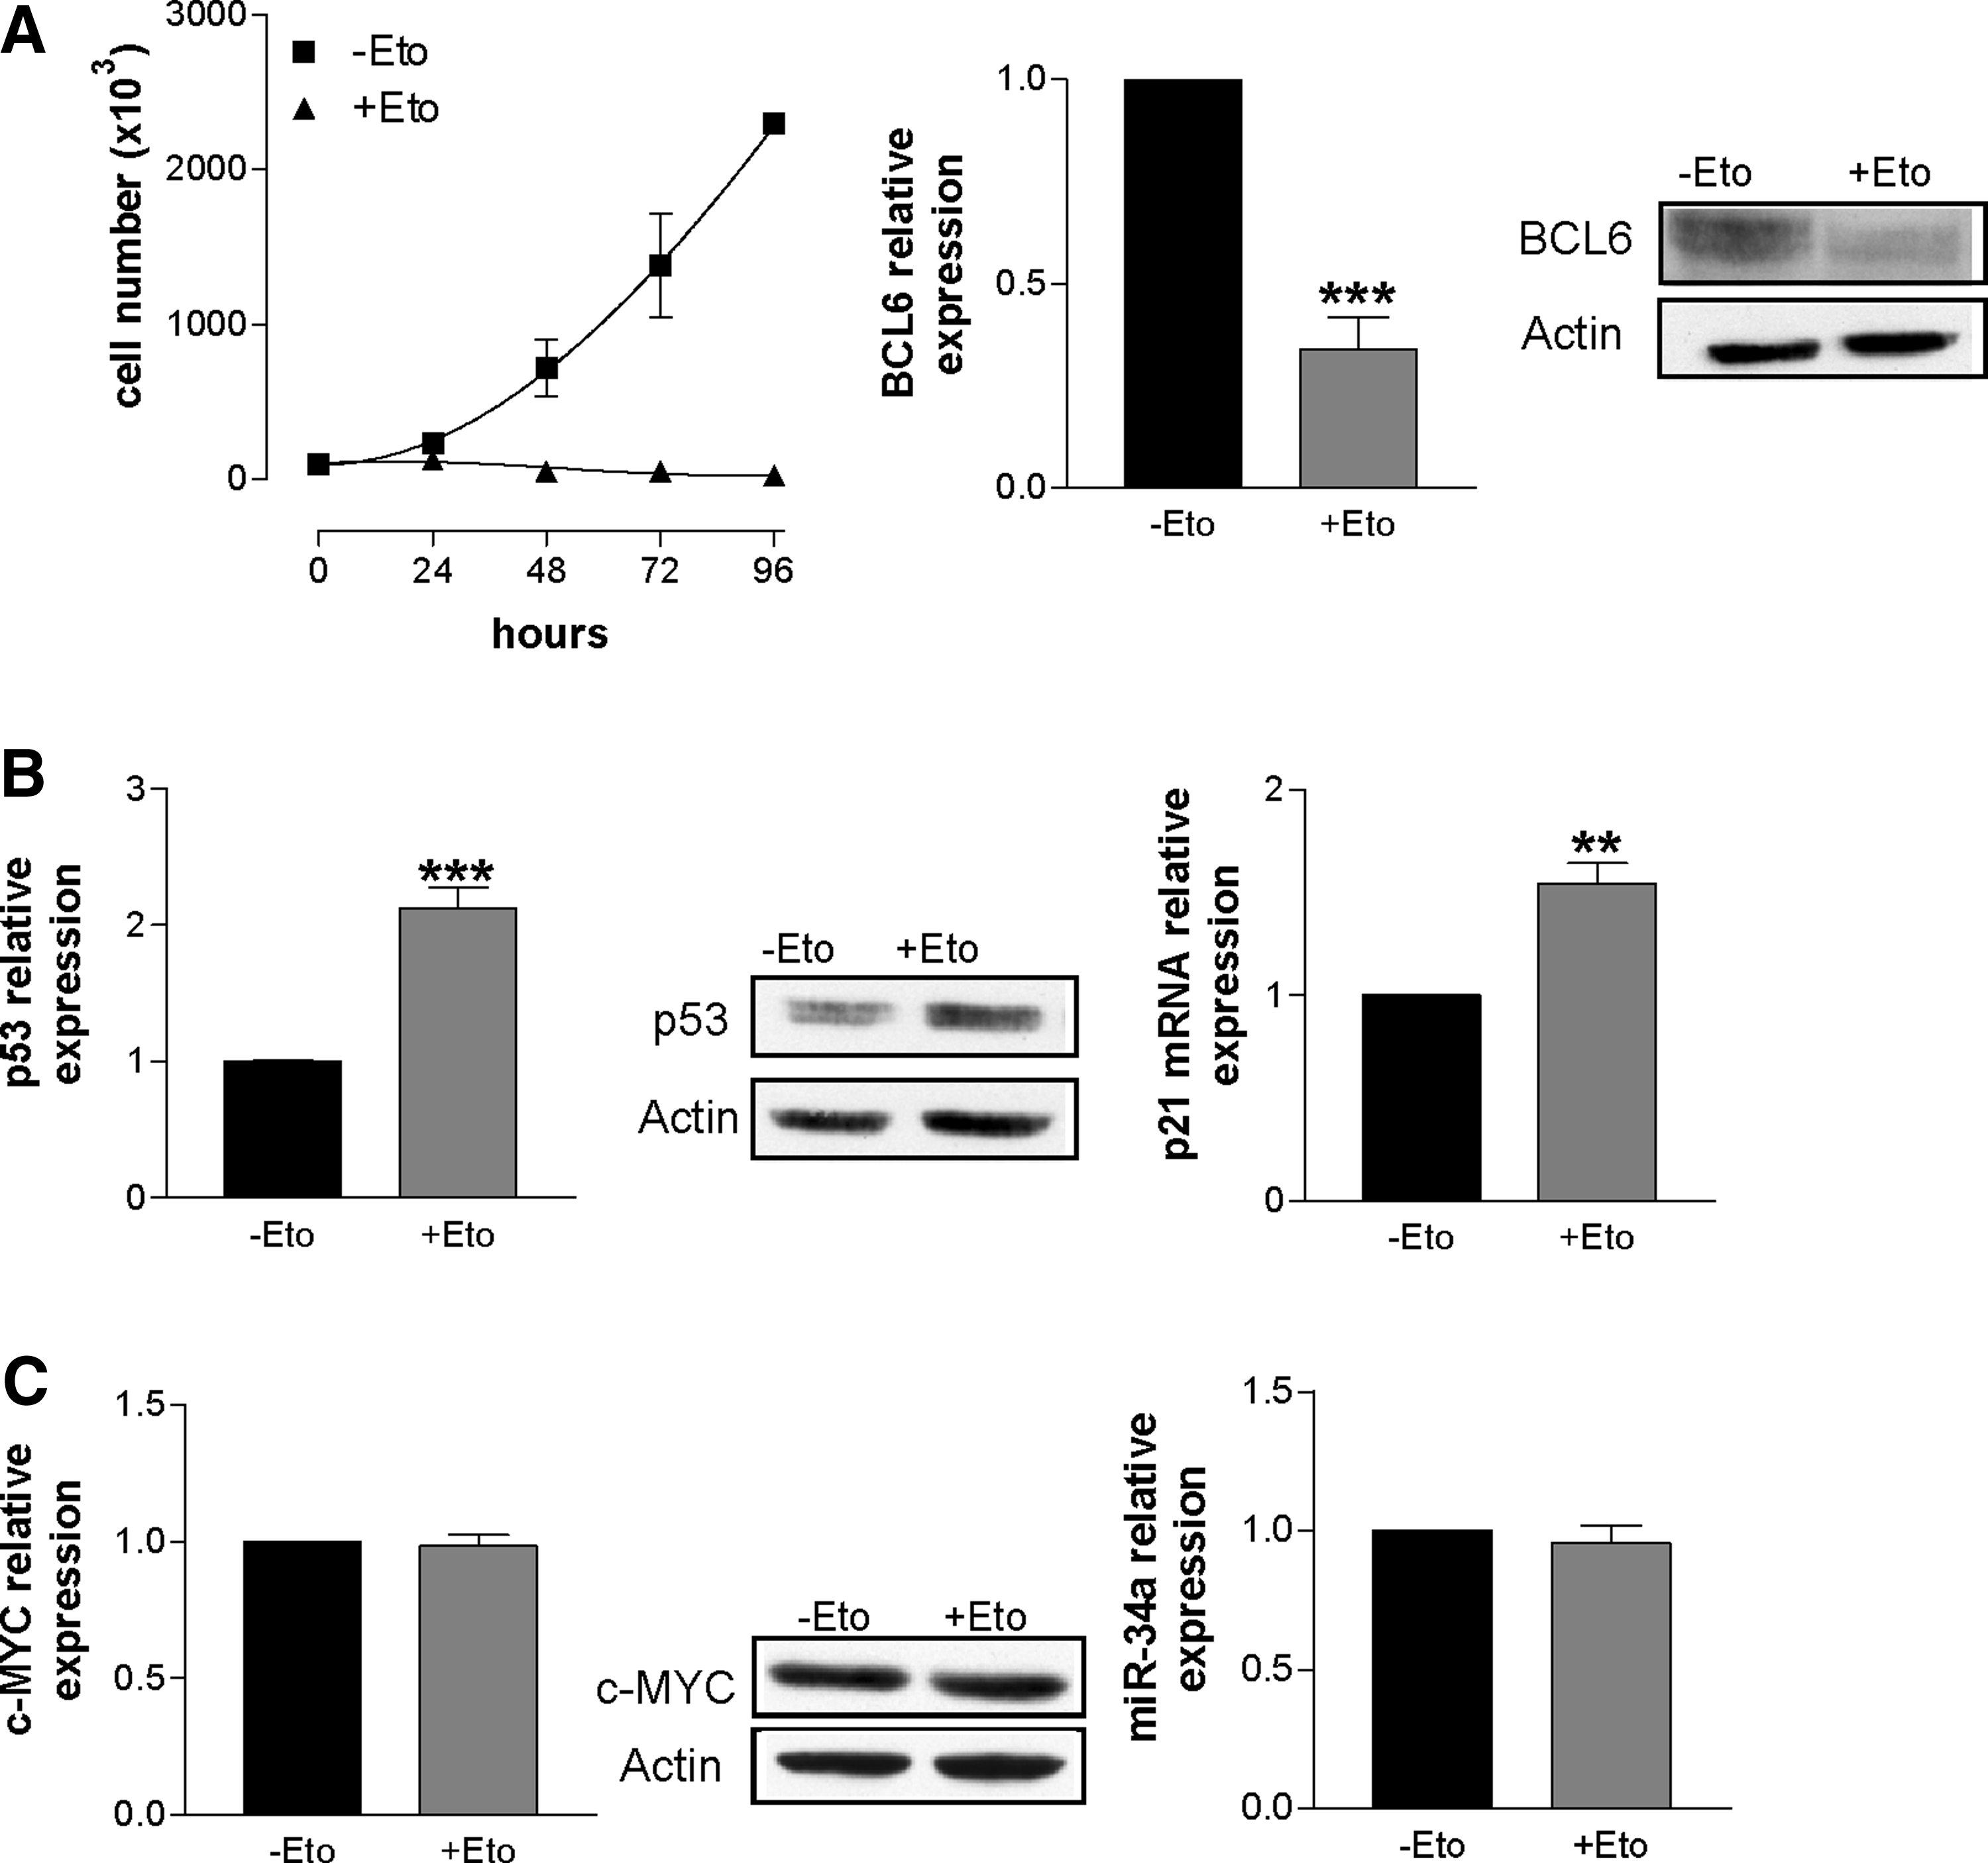
Cellular and molecular effects induced by etoposide in DoHH2 cells.
To give support to the hypothesis that the inhibition of cell proliferation can be achieved by inducing p53 without altering c-MYC or miR-34a levels, we treated DoHH2 cells with nutlin-3, a novel target agent in cancer therapy (Secchiero et al., 2011) particularly in hematological malignancies (Saha et al., 2010). Nutlin-3 is a small molecule that prevents HDM2/p53 interaction thus leading to p53 stabilization, cell cycle arrest and/or apoptosis (Vassilev et al., 2004; Shen and Maki, 2011). The treatment with nutlin-3 caused inhibition of cell proliferation (Fig. 3, panel A, left), probably due to p53 up-regulation (Fig. 3, panel A, right), and consequent p21 activation at both the translational (Fig. 3, panel B, left) and transcriptional (Fig. 3, panel B, right) levels. Again, neither c-MYC protein (Fig. 3, panel C, left) nor miR-34a (Fig. 3, panel C, right) levels were affected.

Cellular and molecular effects induced by Nutlin in DoHH2 cells.
According to our and others' results (Chen et al., 2010; Christoffersen et al., 2010; Sotillo et al., 2011), we propose the following regulatory network: miR-34a directly controls BCL6 and c-MYC; in turn BCL6 represses and c-MYC activates p53 (Fig. 3, panel D). The deregulation of this network by the over-expression of miR-34a fails to block cell proliferation mostly because c-MYC down-regulation reduced p53 levels (Fig 3, panel D, left). Vice versa, drugs (etoposide, nutlin-3) able to increase p53 without affecting either c-MYC or miR-34a inhibited cell proliferation (Fig. 3, panel D, right). According to this model, miR-34a, for its strong inhibitory effect on p53 via c-MYC down-regulation, may be paradoxically considered as a pro-proliferative miRNA rather than an anti-proliferative miRNA in DoHH2 cells.
Footnotes
Acknowledgements
We thank Laura Poliseno for suggestions and critical reading of the manuscript. We thank Dr. M. Minks for revision of the manuscript. This work was supported by Associazione Italiana per la Ricerca sul Cancro, AIRC [project no. 4753] and by Istituto Superiore di Sanità, ISS [project no. 527/A/3A/4].
Author Disclosure Statement
No competing financial interests exist
References
Supplementary Material
Please find the following supplemental material available below.
For Open Access articles published under a Creative Commons License, all supplemental material carries the same license as the article it is associated with.
For non-Open Access articles published, all supplemental material carries a non-exclusive license, and permission requests for re-use of supplemental material or any part of supplemental material shall be sent directly to the copyright owner as specified in the copyright notice associated with the article.