
Abstract
A series of 6H-thiopyran-2,3-dicarboxylate derivatives
Introduction
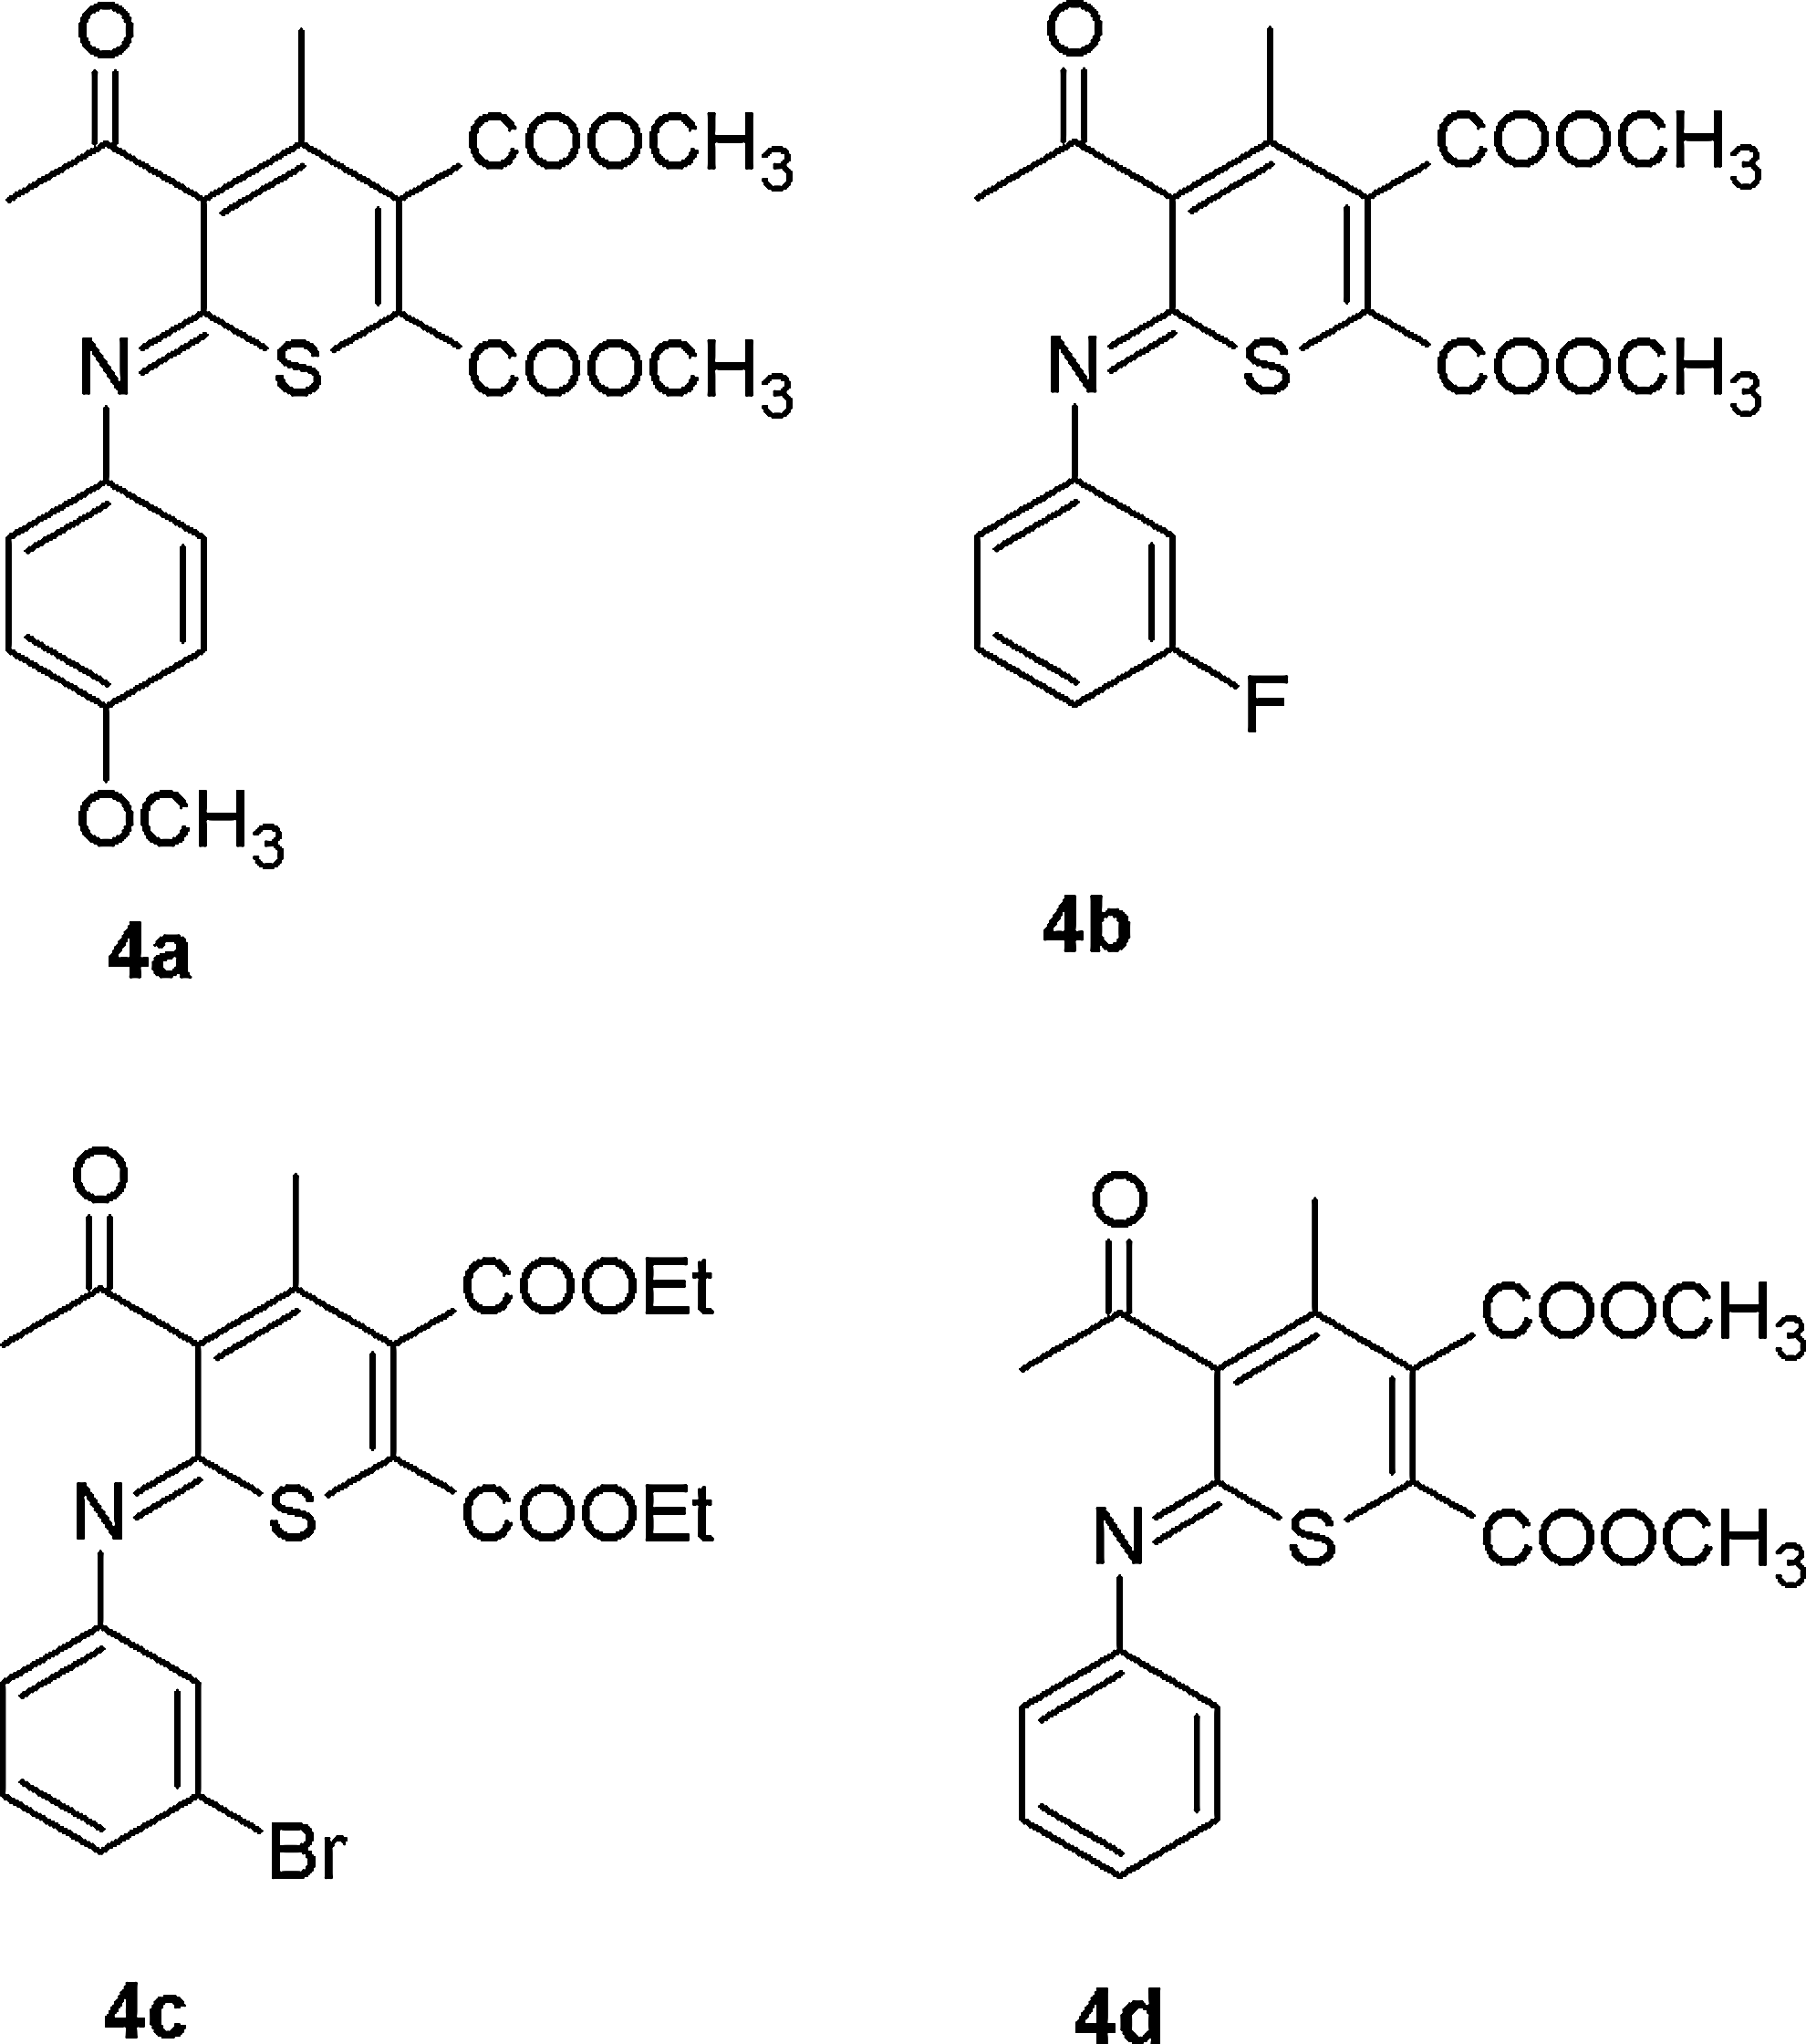
Chemical structures of 6H-thiopyran-2,3-dicarboxylate derivatives
Materials and Methods
Materials
Trypsin, trypan blue, antibiotic and antimycotic agent, fetal bovine serum (FBS), sulforhodamine B (SRB), DNA extracted from fish sperm, and dimethyl sulfoxide were purchased from Sigma Chemical Co. (St. Louis, MO). Dulbecco's modified Eagle's medium (DMEM) culture media, non-essential amino acids, glutamine, and fetal bovine serum were purchased from EuroClone Life Science Division (Milan, Italy); penicillin and streptomycin were from Invitrogen (Carlsbad, CA). All reagents were of the commercial quality and were used without purification. 1H and 13C nuclear magnetic resonance (NMR) results were obtained with a Bruker AV-400 spectrometer with chemical shifts (d) reported in parts per million downfield from tetramethylsilane and referenced from solvent references. Infrared (IR) spectra were obtained using a PerkinElmer 2000 Fourier Transform Infrared Spectroscopy instrument. Melting points were determined by an X-6 micro-melting point apparatus and uncorrected. Absorption spectra were determined on PGENERAL TU-1901UV–VIS spectrophotometer. Reactions were followed by thin layer chromatography on Merck aluminum silica gel (60 F254) sheets that were visualized under a UV lamp. Column chromatography was performed using silica gel 200–300 mesh.
General procedure for synthesis of thiopyran
To a stirred solution of dimethyl acetylenedicarboxylate 2, (2 mmol) and arylisothiocyanate 1, (2 mmol) in 10 mL of acetonitrile was added mixture of 1,3-dicarbonyl 3 (2 mmol) and sodium hydride (2 mmol) in acetonitrile at room temperature. The reaction mixture was stirred for 8 hours. The solvent was removed under reduced pressure and the residue was separated by column chromatography using n-hexane-EtOAc (5:1) as eluent to give
Dimethyl 5-acetyl-4-methyl- 6-(4-methoxyphenylimino)-6H-thiopyran-2,3-dicarboxylate (4a )
Oil, yield: (87%). IR (KBr) (νmax/cm–1): 1738 (C=O), 1724 (C=O), 1647 (C=O), 1436, 1294, 1224, 1127 cm−1. 1H-NMR (500 MHz, CDCl3): δ=2.00 (3H, s, Me), 2.46 (3H, s, Me), 3.67 (3H, s, MeO), 3.78 (3H, s, MeO), 3.84 (3H, s, MeO), 6.95 (2H, d, 3J=7.6 Hz, 2CH), 7.83 (2H, d, 3J=8.0 Hz, 2CH). 13C-NMR (125.7 MHz, CDCl3): δ=17.4 (Me), 31.3 (Me), 51.8 (MeO), 52.6 (MeO), 54.5 (MeO), 118.4 (C), 122.6 (2CH), 132.7 (C), 133.4 (2CH), 133.9 (C), 136.2 (C), 141.3 (C), 147.5 (C–N), 154.2 (C=N), 161.4 (C=O), 167.6 (C=O), 212.6 (C=O).
Dimethyl 5-acetyl-4-methyl-6-(3-fluorophenylimino)-6H-thiopyran-2,3-dicarboxylate (4b )
Oil, yield: (89%). IR (KBr) (νmax/cm−1): 1725 (C=O), 1712 (C=O), 1658 (C=O), 1547, 1421, 1358, 1268, 1124 cm−1. 1H-NMR (500 MHz, CDCl3): δ=2.01 (3H, s, Me), 2.49 (3H, s, Me), 3.80 (3H, s, MeO), 3.90 (3H, s, MeO), 6.60–6.85 (3H, m, 3CH), 7.35–7.37 (1H, m, CH). 13CNMR (125.7 MHz, CDCl3): δ=17.5 (Me), 30.8 (Me), 53.2 (MeO), 53.7 (MeO), 106.7 (d, 2JCF=22.9 Hz, CH), 111.7 (d, 2JCF=21.0 Hz, CH), 128.2 (d, 3JCF=7.8 Hz, CH), 129.6 (C), 131.4 (d, 4JCF=3.8 Hz, CH), 134.4 (C), 135.7 (C), 140.3 (C), 150.7 (d, 3JCF=3.4 Hz, C–N), 154.0 (C=N), 161.1 (C=O), 162.4 (d, 1JCF=324.2 Hz, C), 166.2 (C=O), 202.4 (C=O).
Diethyl 5-acetyl-4-methyl-6-(3-bromophenylimino)-6H-thiopyran-2,3-dicarboxylate (4c )
Oil, yield: (90%). IR (KBr) (νmax/cm−1): 1728 (C=O), 1722 (C=O), 1625 (C=O), 1584, 1412, 1329, 1204, 1100 cm−1. 1H-NMR (500 MHz, CDCl3): δ=1.28 (3H, t, 3J=7.4 Hz, Me), 1.36 (3H, t, 3J=7.2 Hz, Me), 2.02 (3H, s, Me), 2.49 (3H, s, Me), 4.29 (2H, q, 3J=7.3 Hz, OCH2), 4.37 (2H, q, 3J=7.3Hz, OCH2), 6.71 (1H, t, 3J=7.5 Hz, CH), 7.07 (1H, d, 3J=7.4 Hz, CH), 7.27 (1H, d, 3J=7.5 Hz, CH), 7.30 (1H, s, CH). 13C-NMR 25.7 MHz, CDCl3): δ=13.8 (Me), 13.9 (Me), 17.5 (Me), 30.7 (Me), 62.4 (OCH2), 63.3 (OCH2), 117.9 (CH), 122.5 (CH), 123.4 (C), 127.8 (CH), 129.0 (C), 130.1 (C), 131.3 (CH), 134.3 (C), 135.8 (C), 150.5 (C–N), 154.4 (C=N), 160.7 (C=O), 166.3 (C=O), 202.5 (C=O).
Dimethyl 5-acetyl-4-methyl-6-(phenylimino)-6Hthiopyran-2,3-dicarboxylate (4d )
Oil, yield: (85%). IR (KBr) (νmax/cm−1): 1725 (C=O), 1720 (C=O), 1685 (C=O), 1587, 1432, 1129 cm−1. 1H-NMR (500 MHz, CDCl3): δ=2.25 (3H, s, Me), 2.37 (3H, s, Me), 3.65 (3H, s, MeO), 3.82 (3H, s, MeO), 7.53 (2H, t, 3J=7.2 Hz, 2 CH), 7.61 (1H, t, 3J=7.2 Hz, CH), 8.02 (2H, d, 3J=7.3 Hz, 2 CH). 13C-NMR (125.7 MHz, CDCl3): δ=16.8 (Me), 28.4 (Me), 52.5 (MeO), 53.0 (MeO), 122.3 (2 CH), 123.6 (CH), 126.2 (C), 129.1 (2 CH), 133.5 (C), 134.3 (C), 138.5 (C), 148.7 (C–N), 157.4 (C=N), 160.7 (C=O), 161.5 (C=O), 207.1 (C=O).
Cell line and culture
Human breast cancer MCF-7 and colon cancer HCT-15 cell lines were supplied from the American Type Cell Culture Collection (ATCC) and maintained in the standard medium and grown as a monolayer in DMEM containing 10% FBS, 2 mM glutamine, 100 units/mL penicillin, and 100 g/mL streptomycin. Cultures were maintained at 37°C with 5% CO2 in a humidified atmosphere and were passaged weekly using 0.25% trypsin.
Cell proliferation study by SRB assay
Cells were seeded in 96-well tissue culture plates at 2×10³ cells per well and were allowed to adhere for 24 hours before treatment. Serial dilutions of individual compounds were added and cellular growth was assessed after 4 days by SRB assay. Briefly, proteins were precipitated with 10% (final concentration) trichloroacetic acid for 1 hour at 4°C and stained for 30 minutes with SRB dye 0.4% w/v in acetic acid 1% v/v. Finally, precipitated proteins were washed and solubilized in Tris buffer 10 mM. Absorbance (optical density, OD) was measured and read on an ELISA plate reader at a wavelength of 540 nm and used as a relative measure of viable cell number. The percentage of growth inhibition was calculated by using the equation: percentage growth inhibition (1 – OD TC tx/OD TC t0 )×100, where OD TC tx is the mean optical density of treated cells at time x and OD TC t0 is the value at time zero, respectively. Half maximal inhibitory concentration (IC50) was determined by interpolation from dose–response curves.
Evaluation of cell morphology
Human breast cancer MCF-7 and colon cancer HCT-15 cell lines plated at about 20,000 cells per well on chamber-slides were treated with 0 and 5 μM of
Cell cycle analysis by fluorescence-activated cell sorting
Apoptosis and cell cycle profile were assessed by flow cytometry. MCF-7 and HCT-15 cells were plated at a density of 5×10⁵ cells per well on 6-well plates. HCT-15 cells treated with
DNA titration experiments
The absorbance at 260 and 280 nm was recorded, in order to check the protein content of DNA solution. The A260:A280 ratio was 1.81, showing that the DNA was sufficiently free of protein. DNA (5 mg/mL) was dissolved in distilled water (pH=7) at 4°C for 24 hours with occasional stirring to ensure the formation of a homogeneous solution. The final concentration of the DNA solution was determined spectrophotometrically at 260 nm using molar extinction coefficient ɛ260=6600 cm–1 M–1 (expressed as molarity of phosphate groups). The UV absorbance at 260 nm of a diluted solution (1:250) of DNA used in our experiments was 0.661 and the final concentration of the DNA solution was 12.5 mM in DNA phosphate. The appropriate amounts of
Results and Discussion
Synthesis of substituted thiopyrans
As indicated in Fig. 2, a facile synthesis of substituted iminothiopyrans is described via reaction between 1,3-dicarbonyls, electron deficient acetylenic compounds such as dimethyl acetylenedicarboxylate and arylisothiocyanate in the presence of sodium hydride as a base in acetonitrile at room temperature (Fig. 2). The advantages of this study are that no catalyst is required for this reaction and that the simplicity of the present procedure makes it an attractive alternative to the complex multistep approaches. The reaction mixture was stirred for 8 hours. The solvent was removed under reduced pressure and the residue was separated by silica gel column chromatography to give
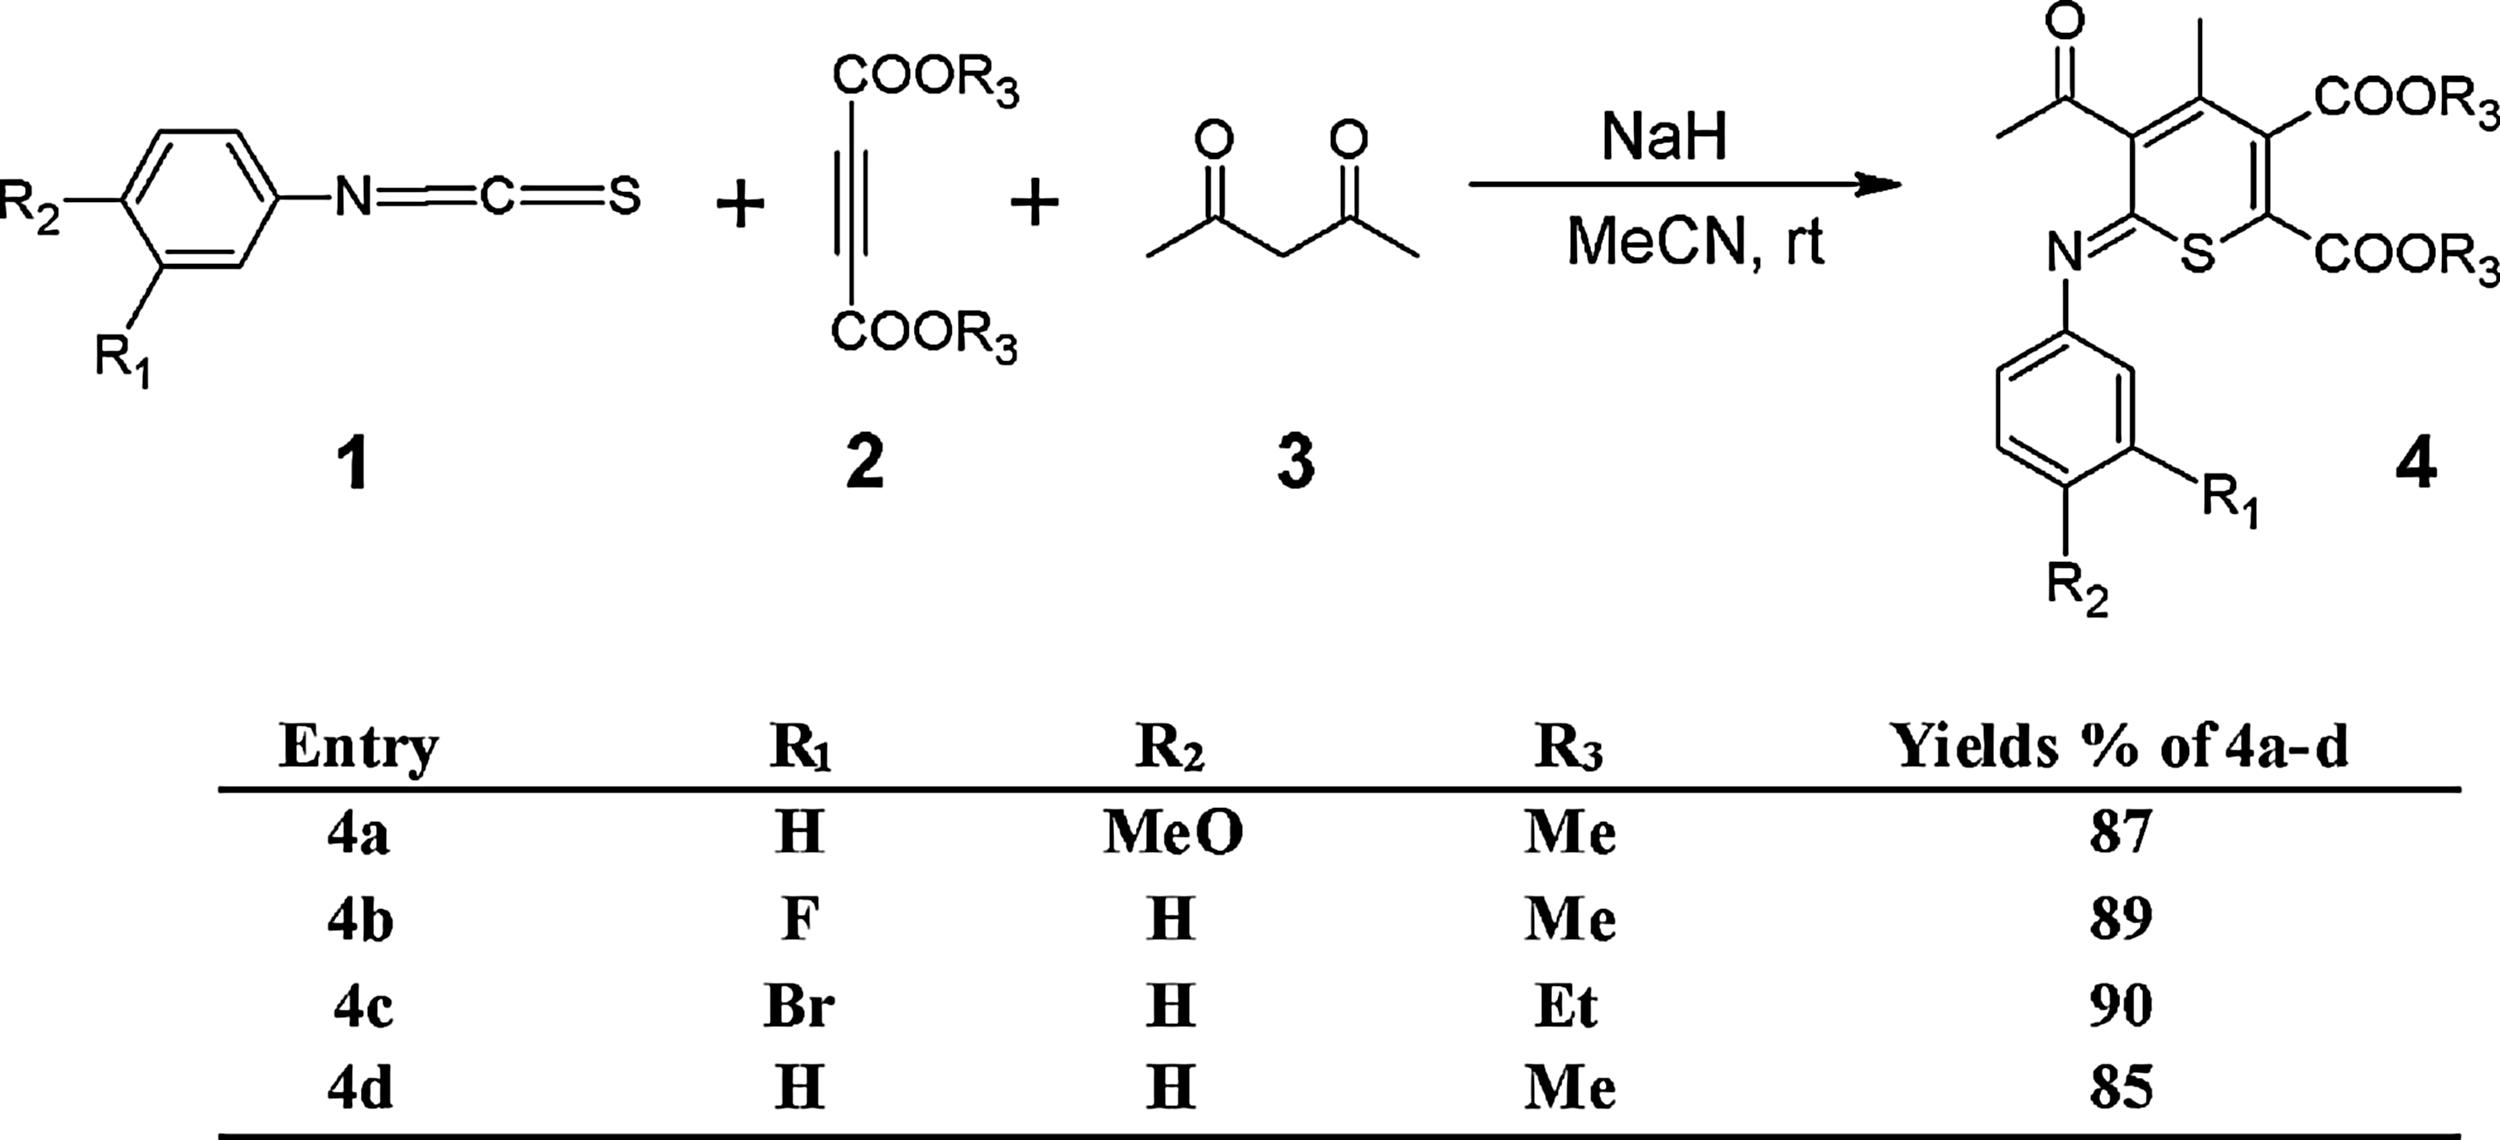
Synthesis of substituted iminothiopyrans
Antiproliferative activity of iminothiopyrans
The in vitro cytotoxicity experiments were performed with the synthesized compounds against HCT-15 colon and MCF-7 breast cancer cell lines from the ATCC. The SRB assay was employed for these antiproliferation studies and the IC50 values are summarized in Table 1. The compound concentration causing a 50% cell growth inhibition (IC50) was determined by interpolation from dose–response curves. Cells were maintained in the standard medium and grown as a monolayer in DMEM containing 10% FBS, 2 mM glutamine, 100 units/mL penicillin, and 100 μg/mL streptomycin. Cultures were maintained at 37°C with 5% CO2 in a humidified atmosphere. IC50 values (in μM), which is the concentration required to inhibit 50% of cell viability by the test compounds after exposure to cells, have been determined. Surprisingly, as it is shown in Table 1, all thiopyran derivatives exhibited potent cytotoxic ability in dose-dependent manner against two cancer cell lines with IC50 values ranging from 3.5 to 15 μM. It is noteworthy that compound
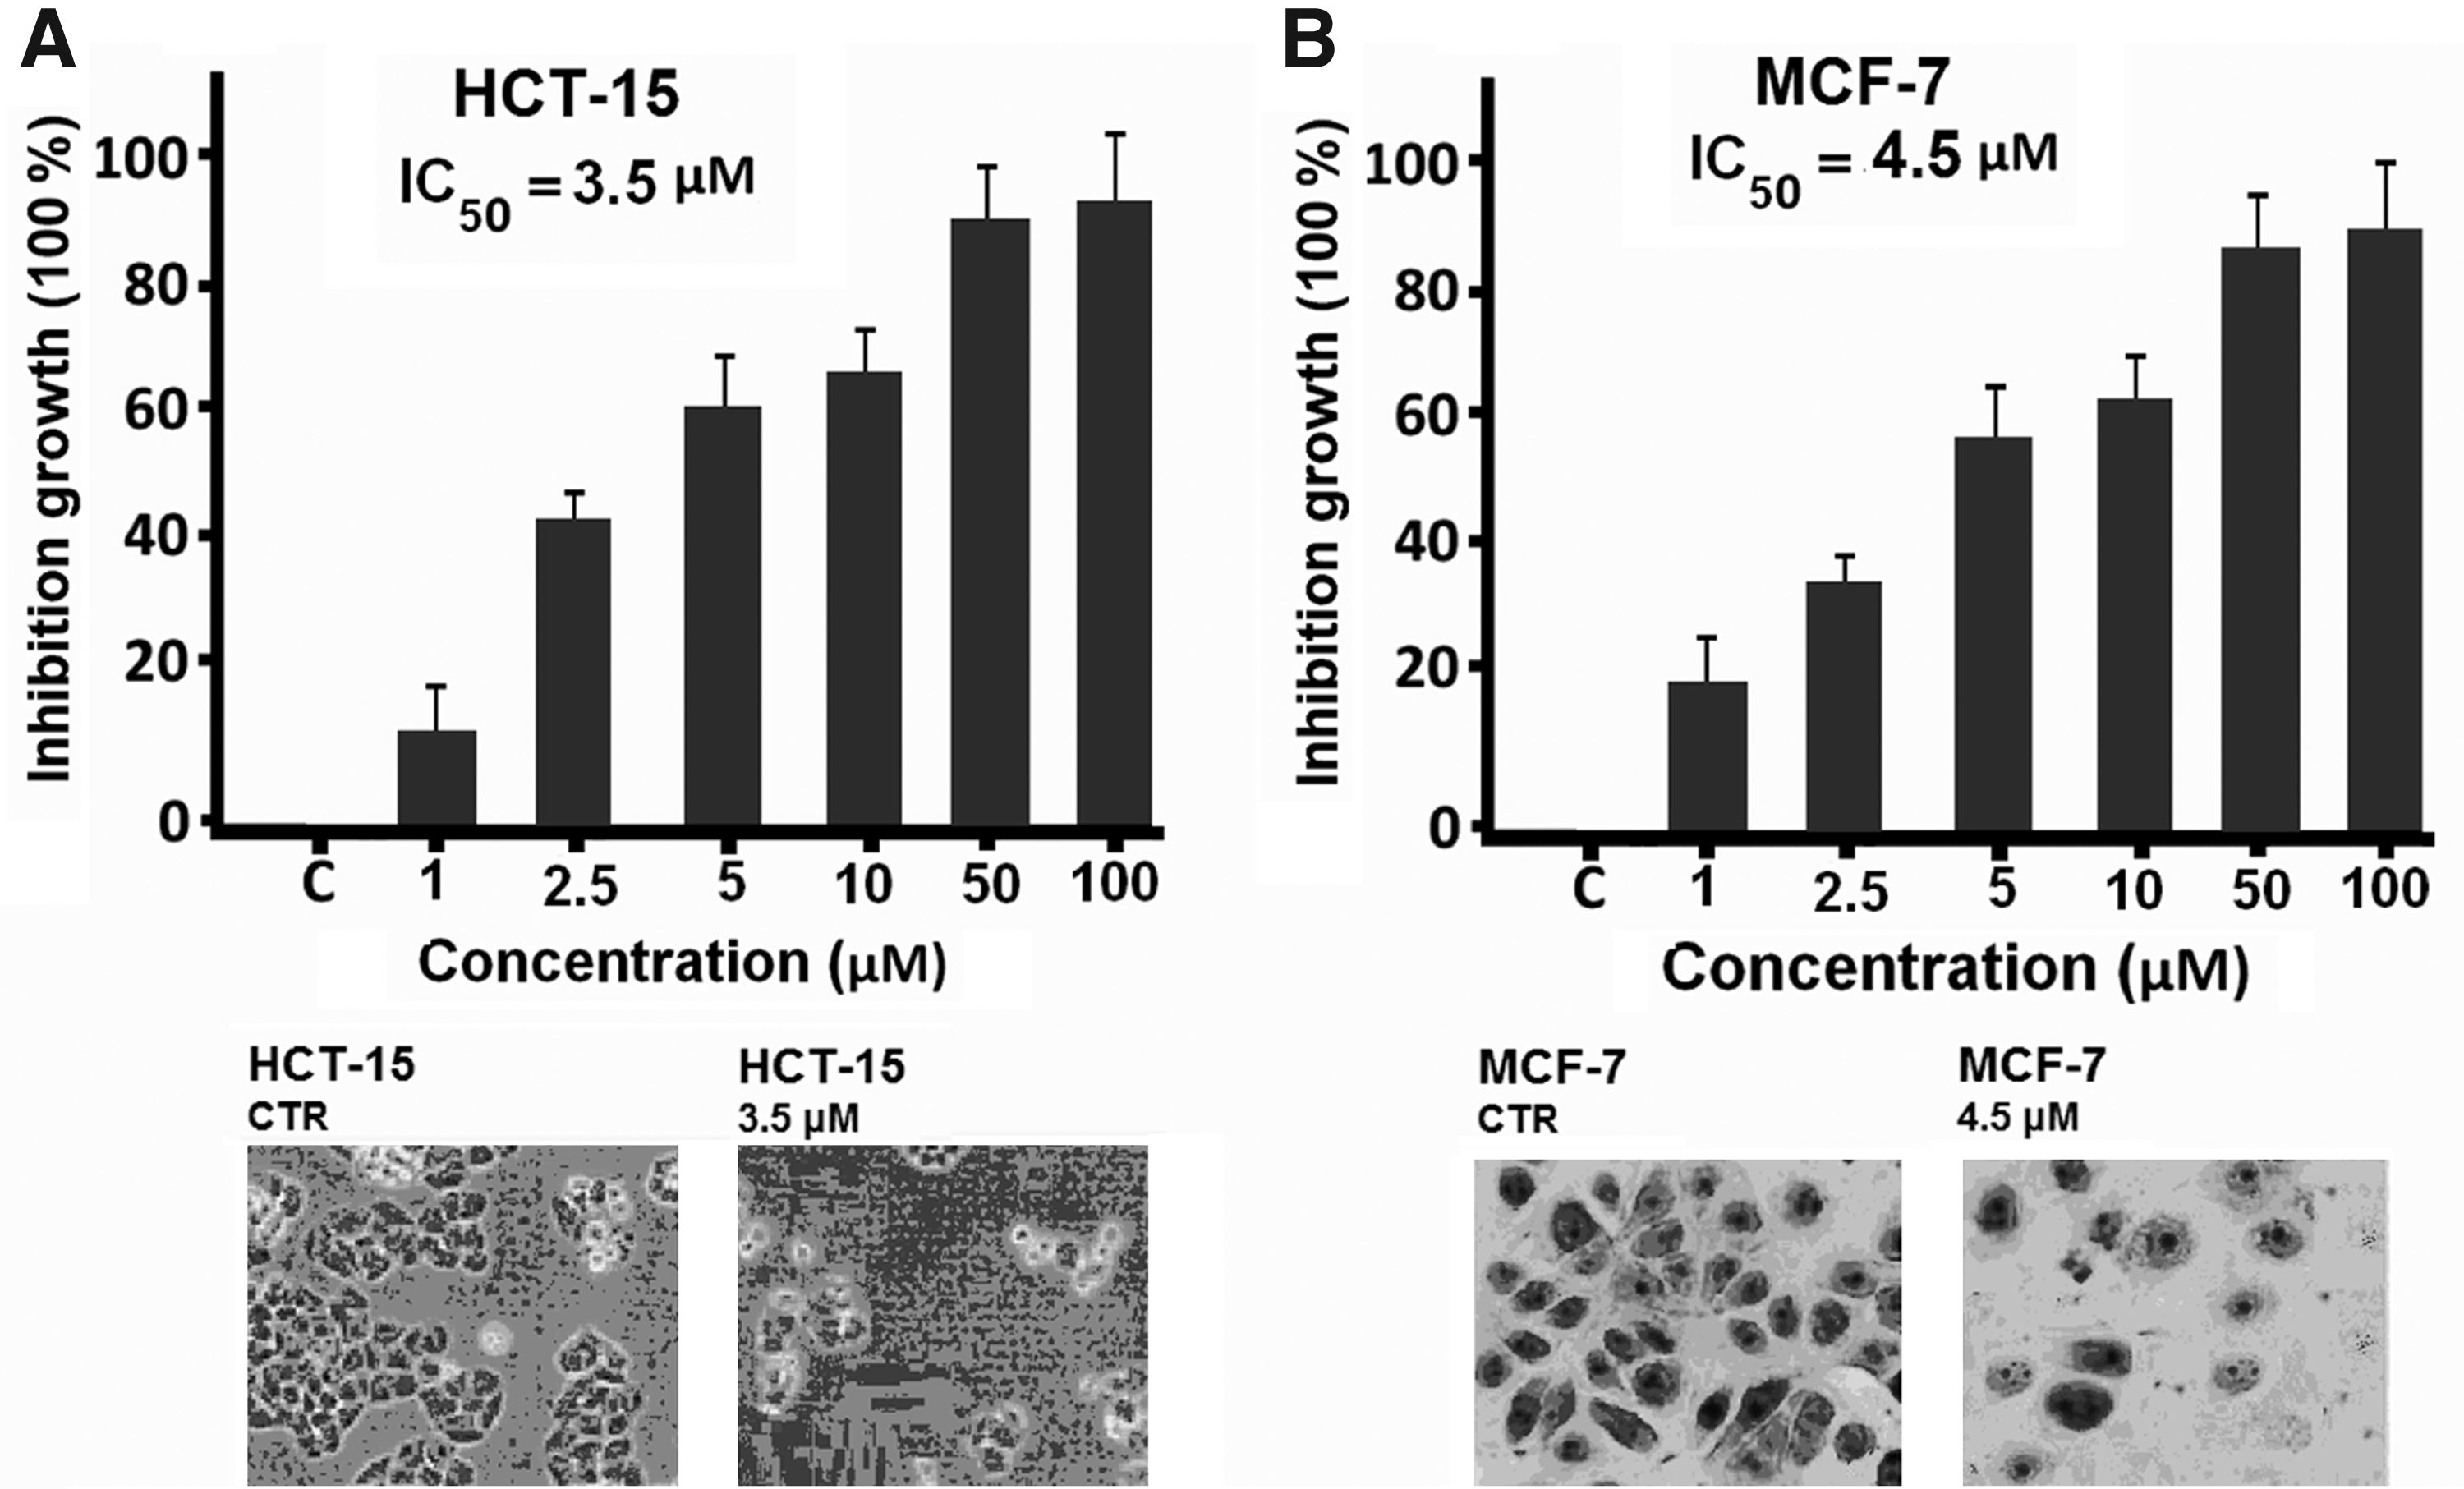
Dose of the compound required to inhibit cell growth by 50% compared to untreated cell controls; values are derived from half maximal inhibitory concentration (IC50) graphs. All experiments were done in triplicate wells and each experiment was repeated thrice.
Cell cycle analysis
In order to study the mechanism of the antiproliferative activity by
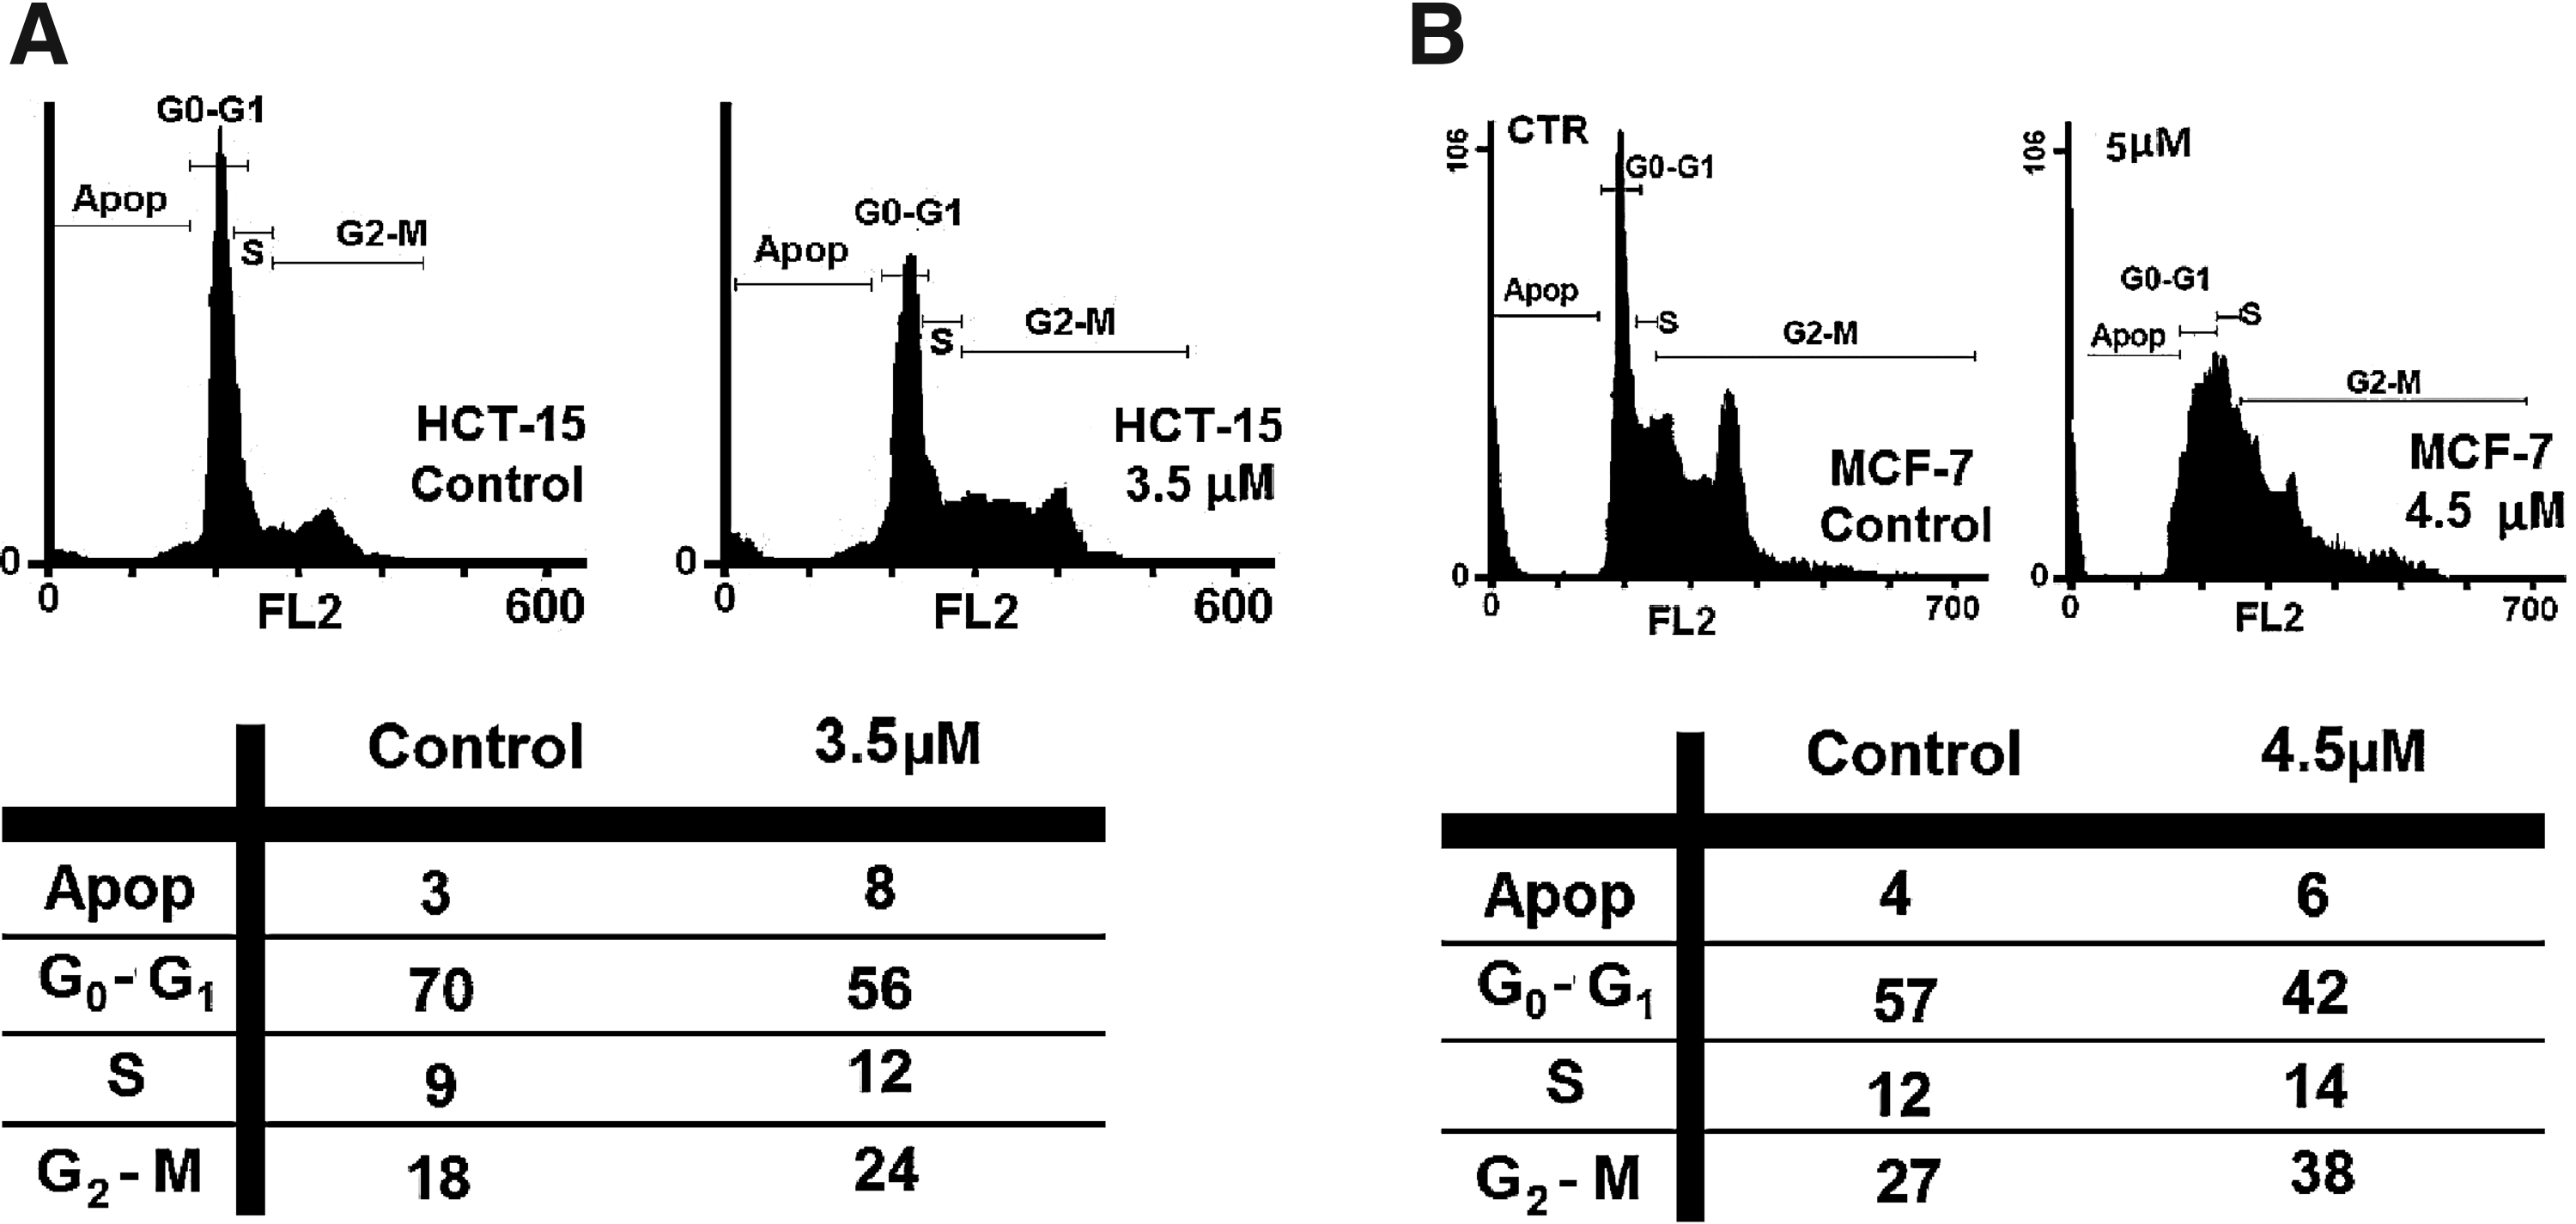
Flow cytometric analysis of
Binding of iminothiopyrans to DNA
Studying the interaction of small molecules with DNA which can modulate transcription, repair and replication both in vitro and in vivo, is one of the most important aspects of biological investigations aimed at discovering and developing new types of anti-proliferative agents (Nafisi et al., 2008; Rajabi et al., 2010; Milanese et al., 2011). DNA can provide 3 distinctive binding sites for ligands-complexes (groove binding, electrostatic binding to phosphate group, and intercalation). Additionally, DNA-binding molecules represent a valuable portion of clinically useful antitumor drugs (Palchaudhuri and Hergenrother, 2007) and most of the drugs than bind non-covalently to DNA interact selectively with the nucleic acid along the minor groove or by intercalation. The binding mode depends on structural features of these molecules and on the DNA sequences they recognize (Cortesi and Nastruzzi, 2001; Kuwabara et al., 2003). The UV spectra have been recorded for a constant DNA concentration in different [DNA]/[compound] mixing ratios (r). UV spectra of DNA in the presence of a complex derived for diverse r values are shown representatively for
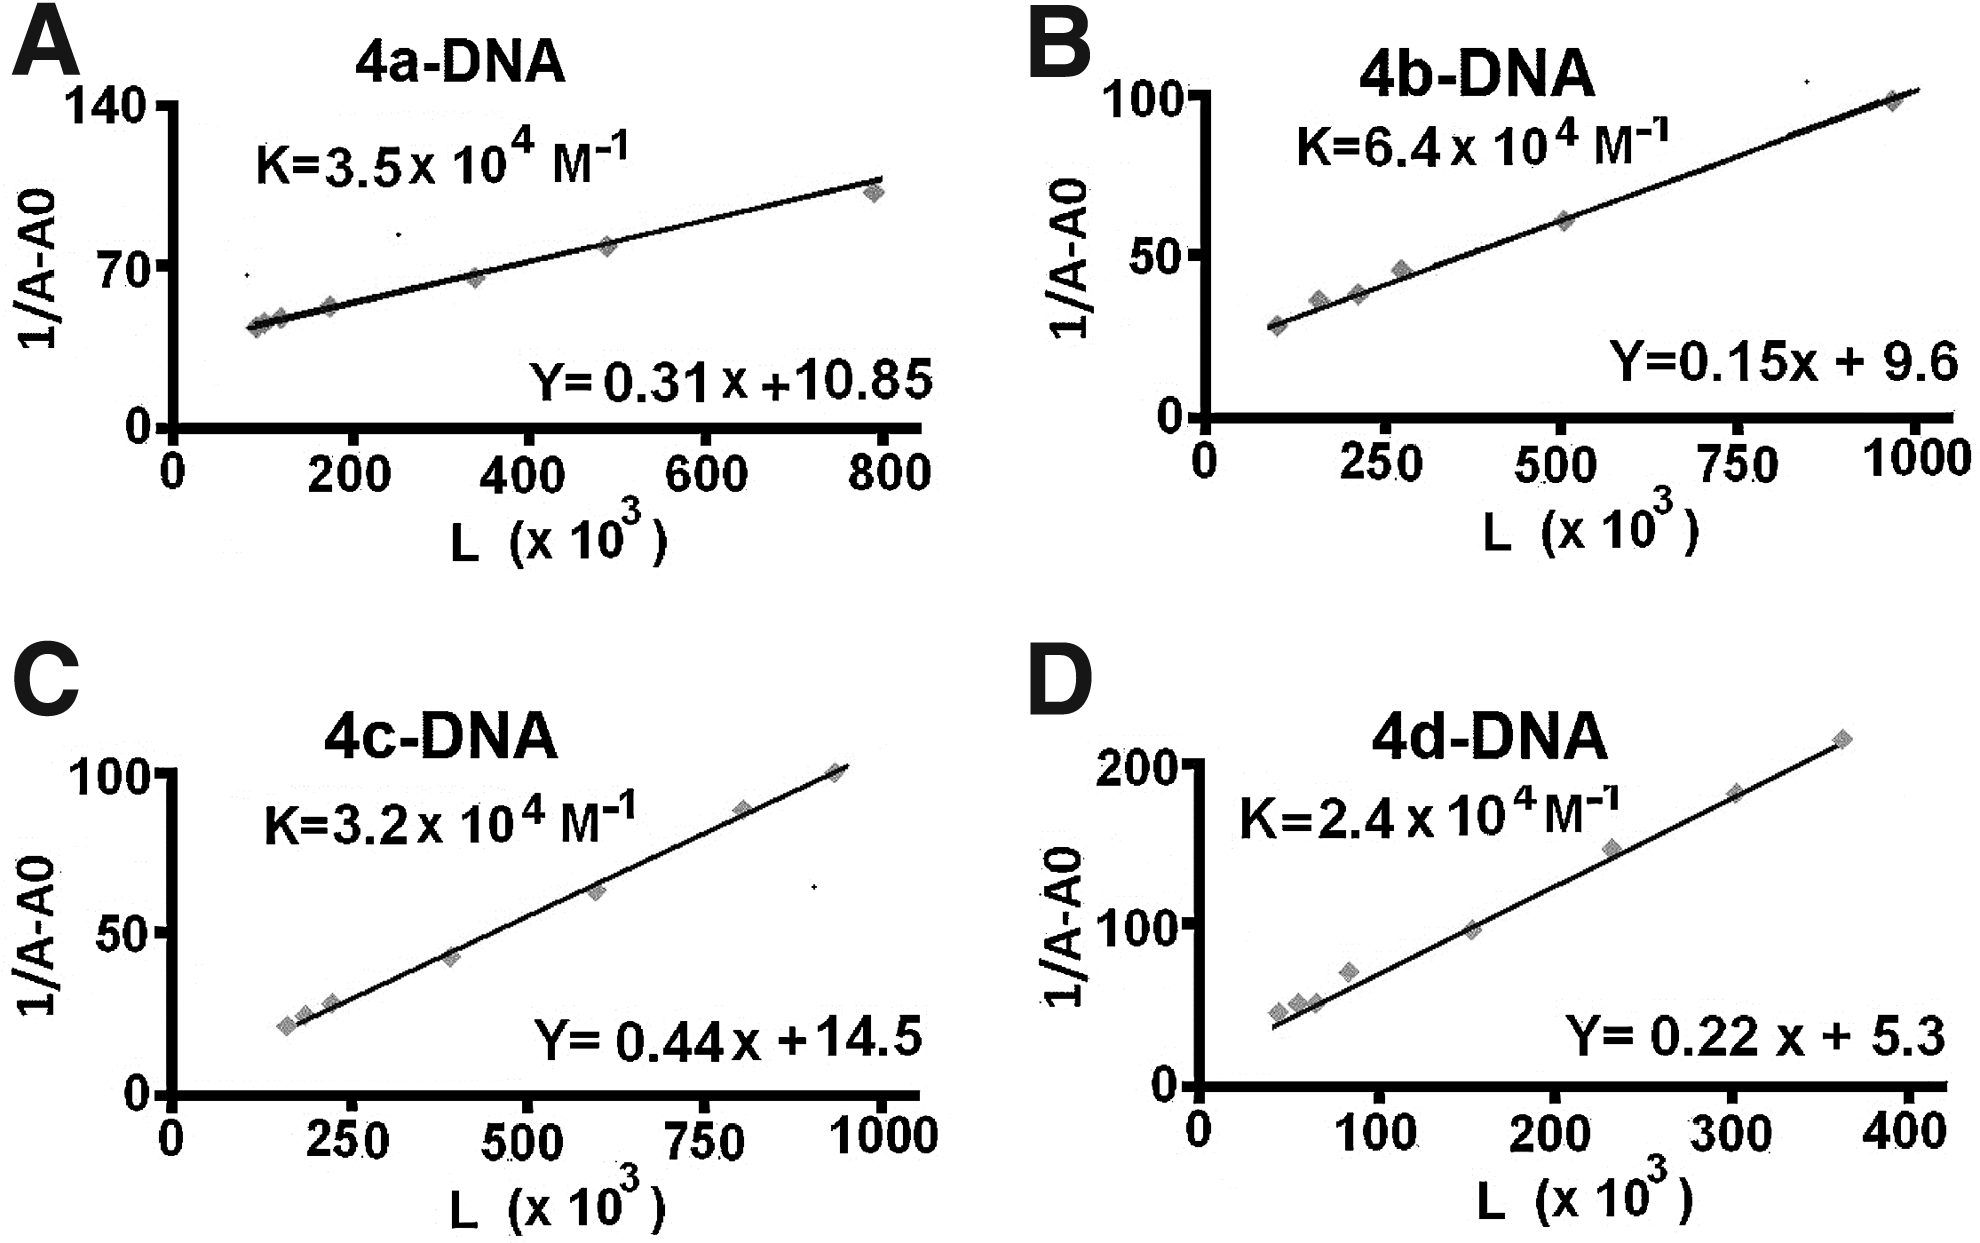
Plot of 1/[Ligand complexed] versus 1/ligand for DNA and ligand complexes at different ligand concentrations.
The double reciprocal plot of 1/[Ligand complexed] versus 1
UV–Vis spectroscopic analysis was conducted to determine the binding mode and the binding constant of the ligand, as well as the effects of ligand complexation on DNA structure with overall affinity constants of K
Footnotes
Acknowledgments
Dr. Mehdi Rajabi greatly appreciate the financial support from the Molecular Medicine Ph.D. Program at University of Milan and also thank professor Riccardo Ghidoni for allowing him to use his lab facilities.
Author Disclosure Statement
No competing financial interests exist.