




Abstract
A series of insertion patterns for chemically modified nucleotides [2′-O-methyl (2′-OMe), 2′-fluoro (2′-F), methoxyethyl (MOE), locked nucleic acid (LNA), and G-Clamp] within antisense gapmers is studied in vitro and in vivo in the context of the glucocorticoid receptor. Correlation between lipid transfection and unassisted (gymnotic—using no transfection agent) in vitro assays is seen to be dependent on the chemical modification, with the in vivo results corresponding to the unassisted assay in vitro. While in vitro mRNA knockdown assays are typically reasonable predictors of in vivo results, G-Clamp modified antisense oligonucleotides have poor in vivo mRNA knockdown as compared to transfected cell based assays. For LNA gapmers, knockdown is seen to be highly sensitive to the length of the antisense and number of LNA insertions, with longer 5LNA-10DNA-5LNA compounds giving less activity than 3LNA-10DNA-3LNA derivatives. Additionally, the degree of hepatoxicity for antisense gapmers with identical sequences was seen to vary widely with only subtle changes in the chemical modification pattern. While the optimization of knockdown and hepatic effects remains a sequence specific exercise, general trends emerge around preferred physical properties and modification patterns.
Introduction
Over the last decade, the properties of antisense oligonucleotides, including potency and pharmacokinetics, have evolved through multiple generations of compound design. (Bennett and Swayze, 2010) Initially, very simple DNA oligonucleotides were used but these compounds suffered from short half-lives due to poor nuclease stability and modest potency. This was enhanced through the use of fully phosphorothioated backbones, which improved stability to nucleases, increased binding to plasma protein, and enhanced cellular uptake. (Stein et al., 1988; Beltinger et al., 1995; Geary et al., 2001) Third generation antisense compounds increased potency through the use of gapmer designs and modified nucleotides which increased both the antisense/mRNA hybridization energy (Monia et al., 1993) and nuclease stability (Cummins et al., 1995). These third generation compounds have demonstrated some early therapeutic success. Examples include LNA gapmers from Enzon (eg, EZN-2968, an inhibitor of hypoxia inducible factor 1A (HIF1a), an oncology target) (Greenberger et al., 2008), MOE gapmers from ISIS (eg, Mipomersen targeting apolipoprotein B (ApoB) as a lipid lowering agent) (Akdim et al., 2010; Raal et al., 2010), and LNA mixmers from Santaris (eg., Miraversen, a blocker of Mir122 as a treatment for hepatitis C virus (HCV) (Lanford et al., 2010).
However, even with the excellent clinical progress of third generation antisense compounds concerns around the potential for hepatotoxicity of ASOs remain (STEIN, 1999). For example, Mipomersen has shown low levels of liver enzyme elevation in some patients, a finding that will need to be more fully understood in expanded trials. Additionally, certain LNA gapmers have been shown to greatly increase the level of liver enzymes and cause hepatic injury (Swayze et al., 2006; Seth et al., 2009). Unfortunately, the mechanism of this toxicity is poorly understood and may be due to tissue, cellular or sub-cellular distribution patterns which can vary substantially with sequence, design pattern, and chemical modifications (Fluiter et al., 2005). Very subtle changes in the ASO can have profound effects on its toxicity profile. For example simply shifting an ASO by one base along its complementary mRNA can transform a highly toxic compound to one that demonstrates only mild hepatoxicity (unpublished Pfizer results).
As seen in third generation antisense gapmers, the introduction of chemical modifications (Bell and Micklefield, 2009) into ASOs can greatly affect their biological properties. Modified nucleotides, linkages and patterns of insertions can improve ASO binding affinity and stability, resulting in an increased duration of action as compared to DNA versions of the compounds. Numerous sugar, base, and linker modifications have been studied in the context of ASOs (MANOHARAN, 1999), immune stimulatory oligonucleotides (Zhao et al., 1996), and siRNA (Bramsen et al., 2009), although the desired properties of modified nucleotides are quite different depending on the modality and the position being modified. For example, the passenger strand in siRNA is much more tolerant of chemical modification as compared to the guide strand where particular care must be taken especially for modifications introduced in the seed region (Prakash et al., 2005; Bramsen et al., 2009; Shukla et al., 2010).
The selection of a specific spatial pattern of modified nucleotides within an antisense molecule is dependent on the anticipated mechanism of action (Sohail and Southern, 2000). For example, splice blocking ASOs tend to be tolerant of extensive chemical modification, with their effectiveness correlating to the hybridization energy of the compound. In contrast, ASOs that use a ribonuclease H (RNaseH) mechanism have more specific design rules and gapmers have emerged over the last decade as a preferred pattern. (Stein et al., 1988) Gapmers have chemically modified “wings” at the 3′ and 5′ ends of the molecule and a DNA gap between the wings to allow for RNaseH recruitment, as well as phosphorothioate backbones to increase nuclease stability (Jepsen and Wengel, 2004). For antisense gapmers, effective modifications in the wings tend to enhance the DNA–RNA hybridization energy. Common examples include LNA (Koshkin et al., 1998a; Koshkin et al., 1998b; Obika et al., 1998; Wahlestedt et al., 2000; Jepsen et al., 2004; Frieden and Ørum, 2008; Straarup et al., 2010) (change in melting temperature ∼3.5°C/insertion), MOE (Sazani et al., 2003) (ΔTm ∼2.0°C/insertion), 2′-F (Uesugi et al., 1979; Kawasaki et al., 1993) (ΔTm ∼1.5°C/insertion), and 2′-OMe (Cummins et al., 1995) (ΔTm ∼1.5°C/insertion). Chemically modified nucleotides in the DNA gap region need to support RNaseH recruitment and cleavage; examples include G-Clamps (Flanagan et al., 1999; Wilds et al., 2002; Ortega et al., 2007) and 2′-deoxy-2′-fluoro-β-D-arabinonucleic acid (Lok et al., 2002). While G-Clamps have been used in hybridization probes, little has been published on their properties in vivo when inserted into ASOs. The structures of these nucleotides are shown in Fig. 1.
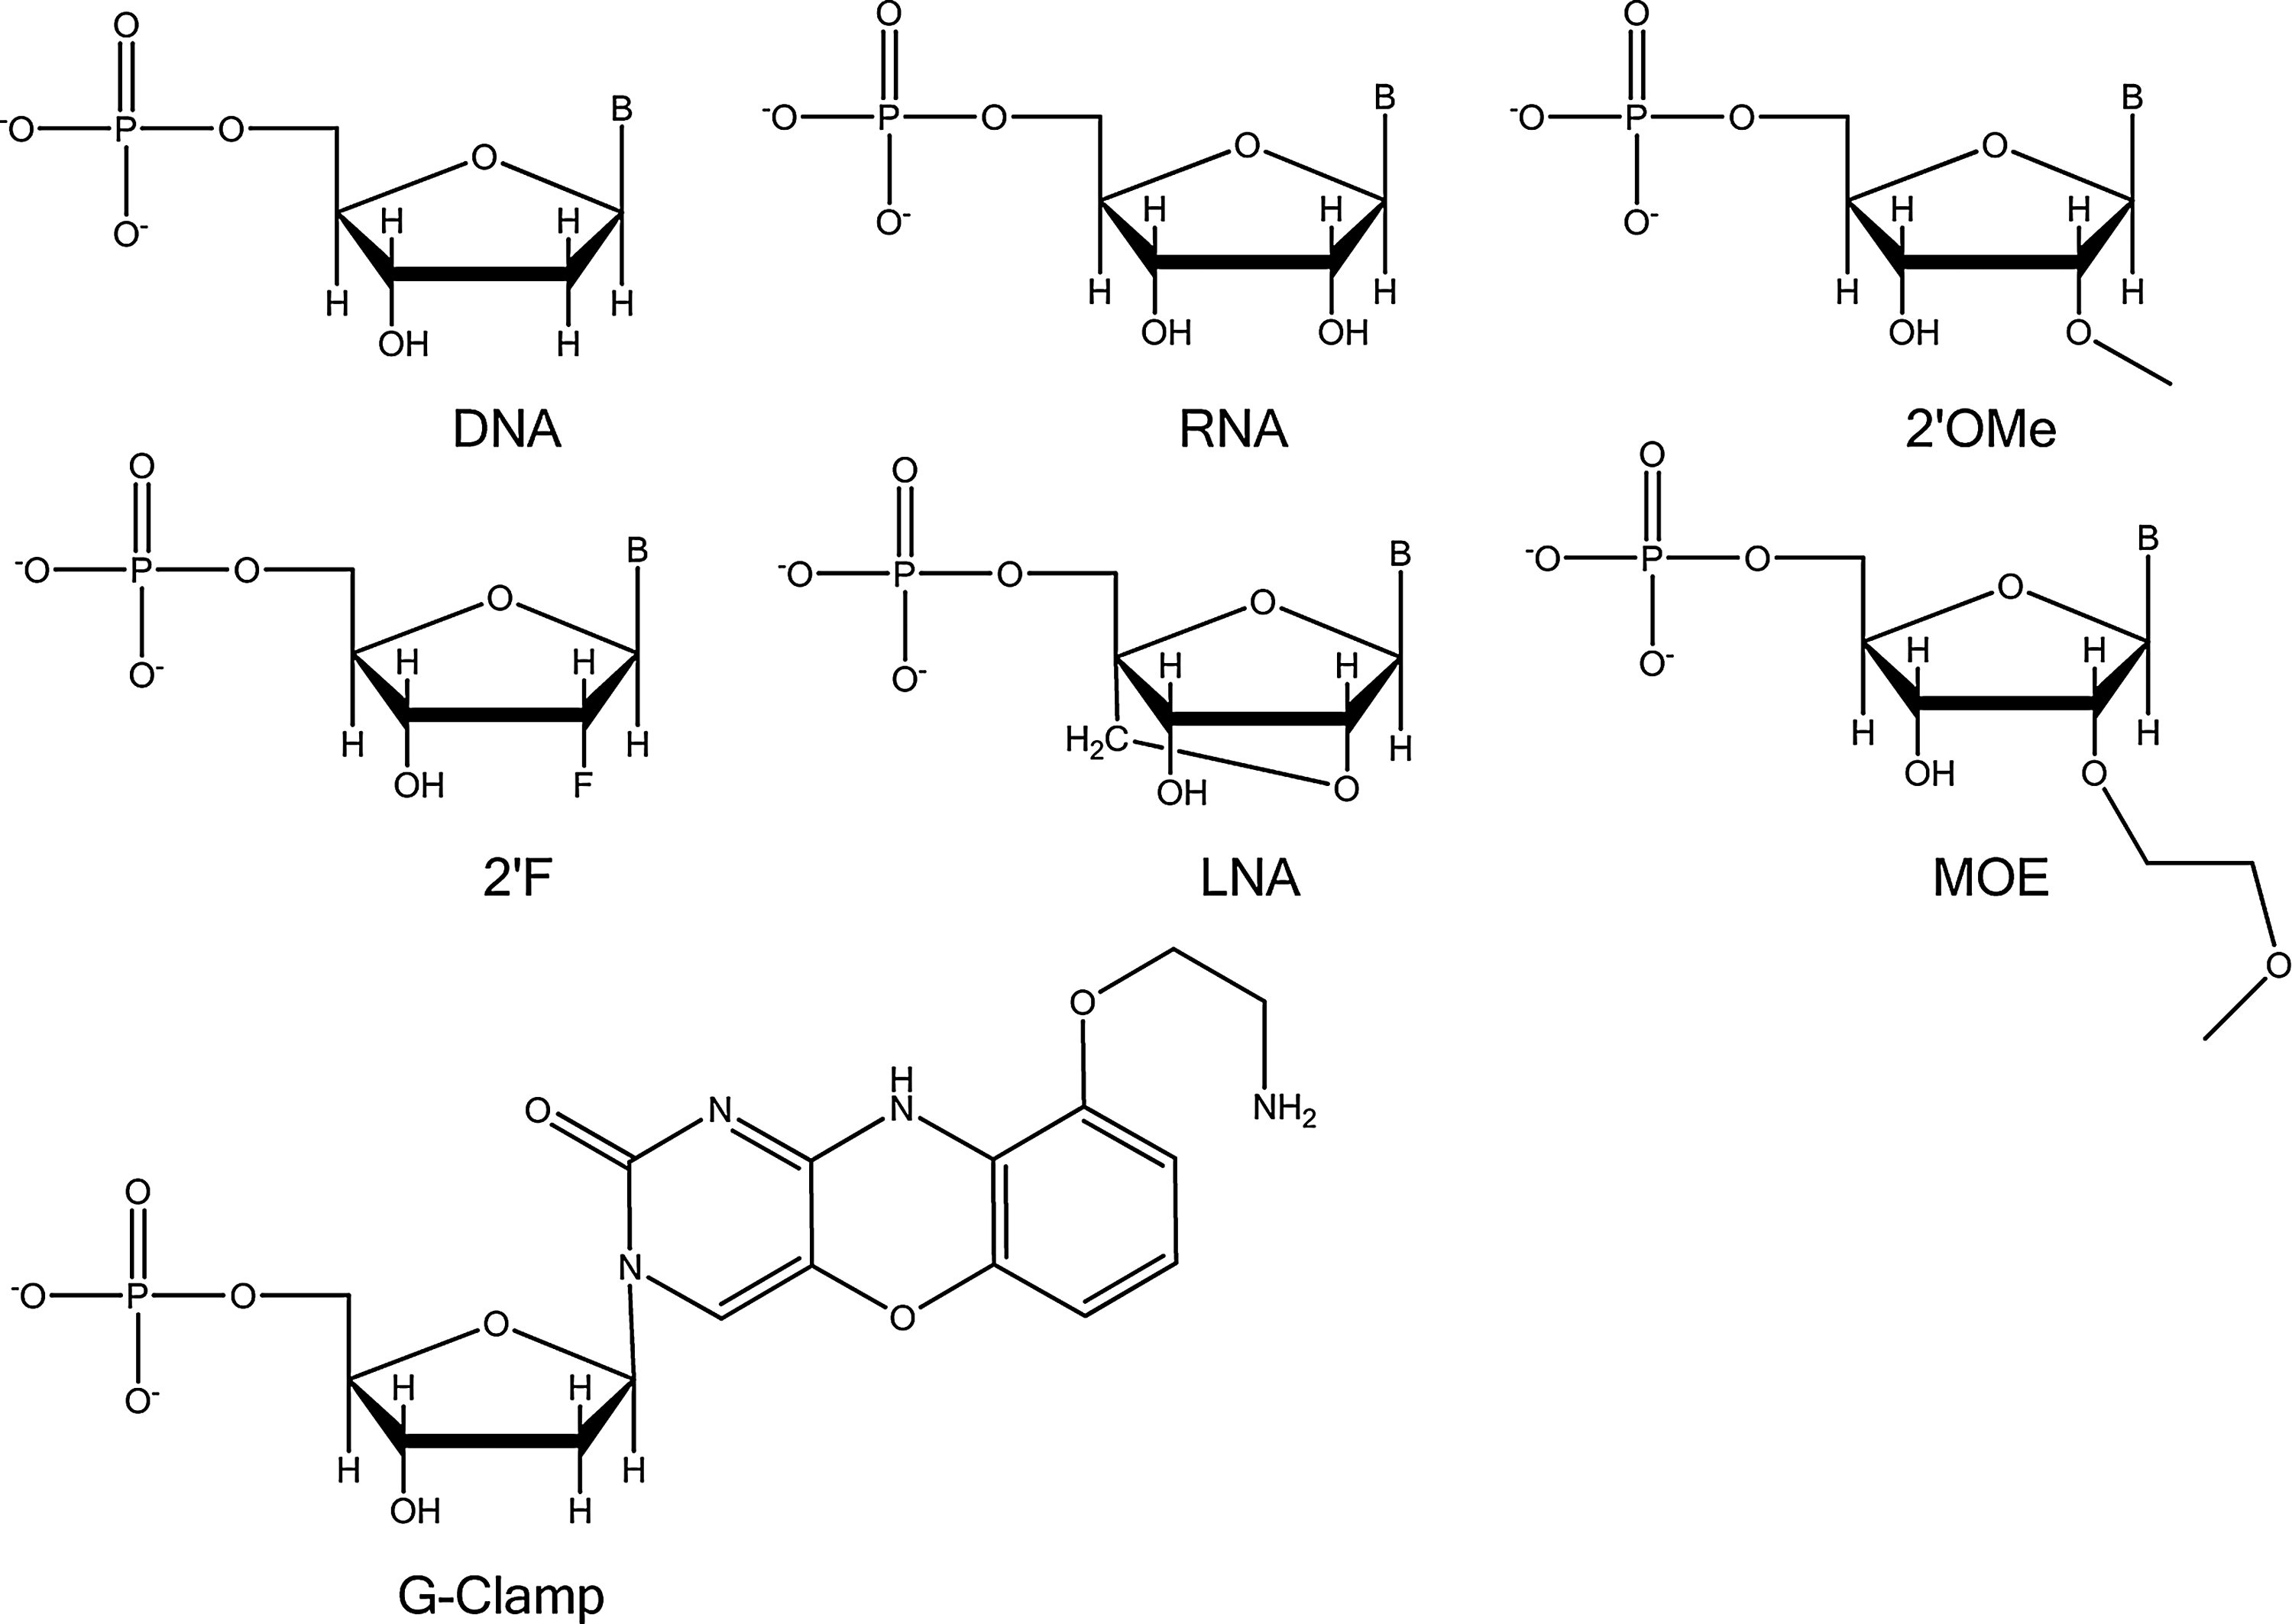
Structures for standard and modified nucleosides.
In the remainder of this paper we present a series of studies to examine the effects of chemical modifications on activity and tolerability in short antisense gapmers. The studies are each done across a set of 3 sequences to control for sequence specific results. The results are shown in the context of glucocorticoid receptor (GR), a clinically relevant target, using sequences that would be potent enough to move forward into the clinic but which are limited by their safety profile. A conservative set of well known chemically modified nucleotides are studied to focus on the changes brought about by small alterations in modification patterns, in contrast to the less predictable effects that would be introduced through the use of novel nucleotides. Finally, in vivo to in vitro correlation is studied to determine if specific in vitro assay conditions are more predictive of in vivo results.
Material and Methods
Sequences
The parent sequences used as the basis for all of the compounds studied are shown below.
Sequence 1: GTCTCTTTACCTGG
Sequence 2: ACTCCAAATCCTGC
Sequence 3: AGGTGCTTTGGTCT
Sequence 4: TTC GTCTCTTTACCTGGGGA
Oligonucleotide synthesis
All oligonucleotides, except those containing the 2′-O-methoxyethyl (2′-O-MOE) modification, were synthesized using fast-deprotecting phosphoramidite protocols on a MerMade 12 or MerMade 192 oligonucleotide synthesizer (BioAutomation) at 200- to 1,000-nmole scales employing standard CPG supports (BioSearch) or Glen UnySupport (Glen Research). The DNA, 2′-OMe, 2′-F, and G-Clamp monomers were obtained from ChemGenes Corporation or Glen Research. All linkages were phosphorothioates made with 3-((N,N-dimethylaminomethylidene)amino)-3H-1,2,4-dithiazole-5-thione as the sulfurization agent. After synthesis, the oligonucleotides were cleaved from the support and deprotected using a 50:50 mixture of ammonium hydroxide and aqueous methylamine at 65°C for 1 hour. The crude dimethoxytrityl (DMTr)-on oligonucleotides were purified via DMTr-selective cartridge purification techniques and if necessary further purified via reversed phase high performance liquid chromatography (HPLC) and desalted via cartridge-based methods. For oligonucleotides containing the MOE modification, monomers were obtained from Innovassynth Technologies (I) Ltd. After synthesis, the oligonucleotides were cleaved from the support and deprotected using aqueous ammonium hydroxide at 55°C for 8 hours.
For purification, a Waters 2796 equipped with a Waters 2996 DAD and Waters Fraction Collector III with a Phenomenex Clarity Column (10 mm×250 mm, 5-μm particles) at 60°C. Mobile phase buffer A consisted of 100 mM triethylammonium acetate in water at pH 7.4. Buffer B consisted of 50% buffer A and 50% acetonitrile. The flow rate of the mobile phase was 2.0 mL/minute. The oligonucleotides were diluted in water to a concentration of ∼5 mg/mL. Sample injection volume of 500 μL was used. Fractions were collected using Waters Fraction Lynx software triggered by minimum intensity threshold at a wavelength of 260 nm.
Characterization was done using a Waters Acquity ultra performance liquid chromatography system equipped with a binary pump, tunable ultraviolet (TUV) detector, and column heater which was connected in-line to a Waters LCT Premier Time of Flight Mass Spectrometer. The separation was carried out on a Waters Oligonucleotide Separation Technology column (2.1 mm×50 mm, 1.7μm particle size) at a column temperature of 60°C. Mobile phase buffer A consisted of 400 mM hexafluoroisopropanol (HFIP) and 14 mM triethylamine (TEA) in water at pH 7.9. Buffer B was 50% buffer A and 50% methanol. The flow rate was 0.6 mL/minute. The TUV detector was set to 260 nm and the eluent from the detector was connected directly to the electrospray probe on the LCT MS. The LCT was operated in negative mode scanning a mass range of 600–2,000 m/z with a 1-second scan time. Probe ionization was set to 3000 V and cone voltage to 40 V. The source gas was set to 450°C and source temperature at 120°C.
Two methods were used for concentration determination: (1) a Molecular Devices SpectraMax M5 absorbance reader at 260 nm and (2) a C Technologies Solo VP Slope reader equipped with Quick Slope software. Beer's Law was used to determine the final concentration, with extinction coefficients calculated using the nearest neighbor model (Cantor et al., 1970; FASMAN, 1975).
Melting temperature
Samples were raised to 95°C for 5 minutes and then dropped to 25°C slowly (over about 2 hours) to make sure of proper annealing. The melting temperature was measured using a Cary100 Bio (Varian Inc.). Data was collected and analyzed using Thermal software from Varian. Samples were diluted to 5 μM in phosphate buffered saline (PBS). The temperature range used was 25°C to 90°C and every run was done by temperature ramp up and down twice. The temperature was changed with at a rate of 0.5°C per minute and held for 3 minutes at 90° and 25°C. The wavelength used was 260 nm.
RNaseH
The RNaseH competition assay used a reaction buffer (20 mM HEPES pH 7.4, 10 mM KCl, 10 mM MgCl2, 0.5 mM EDTA, and 1 mM DTT, added fresh) and a substrate (strand 1: 5′ AlexaFluo488-GTAGATCTTGTTGTGCATCTC and strand 2: 3′ IowaBlack FQ-CAUCUAGAACAA CACGUAGAG). In 1× buffer, the substrate (duplex) was added at 120 nM, oligonucleotides (RNA/DNA duplex) at 600 nM, and RNaseH enzyme (NEB) 1–2.6 mU per sample. Data were collected using a Gemini XPS at excitation wavelength=490-nm, emission wavelength AEM=520-nm wavelength for 2 hours every 30 seconds at 25°C under the kinetics setting. Data was analyzed using softMax Pro V5. A substrate control was used for data comparison.
In vitro assays
For the in vitro assays, human hepatocellular carcinoma cell line Hep3B and mouse hepatoma cell line Hepa1-6 (ATCC) were used. Cells were maintained in Eagle's minimum essential medium (Hep3B) or Dulbecco's modified Eagle's medium (Hepa1-6) with 10% fetal bovine serum (FBS; ATCC). Subculture was done according to the provider's recommendations. The day before transfection, cells were plated at a density of 8,000 cells in 80 μL complete growth media per well in 96-well plates. On the day of transfection, antisense compounds were prepared at 10-fold of the final concentration (final 3 nM) in Opti-Mem (Invitrogen Corp.). Lipofectamine 2000 (Invitrogen Corp) was diluted at 1:25 in Opti-Mem. An equal volume of the 10× compound, and Lipofectamine 2000 (40 μL each) was mixed and incubated at room temperature for 30 minutes. Then 20 μL of the mixture was added into each well of the cells, bringing the final volume to 100 μL per well. Cells were returned to the incubator and incubated at 37°C and 5% CO2 for 24 hours before harvesting.
For the electroporation study, an Amaxa Nucleofector 96-well Shuttle System (Lonza Ltd.) was used along with the Spodoptera Frugiperda (SF) Cell Line 96-well Nucleofector Kit (VHCA-1002). Hep1-6 cells were passaged 2 days prior and were at 70% confluency on the day of transfection. First, a 96-well plate with 185 μL per well growth media was placed in the incubator at 37°C. Cells were trypsinized and counted, and then a total of 20×106 cells were spun at 90 g for 10 minutes. At the same time, a compound plate was prepared at 4-fold of final concentration in activated buffer SF. After centrifugation, the cell pellet was resuspended in 1.5 mL of buffer SF and 15 μL of suspension were added to each well (200,000 cells per well). Then 5 μL of antisense compounds were carefully added to each well. The plate was gently shaken by hand and placed on the device, where electroporation was carried out using program 96-FF-120. The plate was left at room temperature for 10 minutes before 80 μL of warm growth media was added to each well, immediately followed by up and down mixing 3 times. Finally, 15 μL of the cell mixture were transferred to the pre-warmed 96-well plate and incubated at 37°C for 24 hours.
For the unassisted delivery studies, a compound plate was prepared at 20-fold of final concentration on the day of transfection. Hepa1-6 cells were trypsinized and resuspended in Gibco Media 199 (Invitrogen #11043) with 10% FBS. A volume of 95 μL cell suspension was added to a 96-well plate at the density of 4,000 cells per well. Then 5 μL of compounds were added to each well. The plate was incubated at 37°C for 7 days.
Gene expression was measured using a QuantiGene 2.0 assay (Affymetrix Inc.). Human and mouse GR probes and housekeeping gene peptidyl-prolyl cis-trans isomerase B (PPIB) probes were purchased from Affymetrix. Standard assay procedures were carried out according to the manufacturer's recommendations. On the day of harvesting, 200 μL per well of lysis buffer (with 1:100 protease K) was added to the cells. A total of 20 μL of lysate was used for mouse GR and mouse PPIB probes, while 80 μL and 40 μL lysate was used for human GR and human PPIB probes respectively. Assay plates were read on the GloRunner Microplate Luminometer (Promega Corp.). The data reported in this study are normalized against housekeeping gene PPIB. Cytotoxicity was only observed for some of the compounds under gymnotic conditions and these are clearly shown in the figures.
Imaging
An LNA modified probe complementary to sequence 1 was synthesized by Biosynthesis, Inc. Probe details are: 5′-[DIG]-C*CAG*GTA*AAG*AGA*C-[DIG]-3′, where N=DNA, *N=LNA, and DIG=digoxigenin.
For in situ hybridization human embryonic kidney (HEK293) cells (CRL-1573; ATCC) were cultured at 37°C in a 5% CO2 atmosphere on 4-well chambered slides (#154526; Nalge Nunc International). Cells were cultured at a density of 100,000 cells per well in Eagle's minimum essential medium (#30-2003, ATCC) supplemented with a final concentration of FBS at 10% (v/v) (#12103C; SAFC Biosciences) and penicillin:streptomycin (#15070; Gibco) at 1% (w/v). Cells were plated for 24 hours in media and then incubated with an ASO at a concentration of 10 μM for 24 hours.
For target knockdown (KD) experiments, human embryonic kidney (HEK293) cells (CRL-1573; ATCC) were cultured at 37°C in a 5% CO2 atmosphere on a 96-well plate (#3596; Corning). Cells were cultured at a density of 10,000 cells per well in Eagle's minimum essential medium (#30-2003, ATCC) and supplemented with final concentration of FBS at 10% (v/v) (#12103C; SAFC Biosciences) and penicillin:streptomycin (#15070; Gibco) at 1% (w/v). Cells were plated for 24 hours in media and then incubated with an ASO at concentration of 10 μM for 24 hours. Four biological replicates were collected for each compound, along with 4 control replicates that received media only.
Cultured cells were washed with PBS (#17-512Q; Lonza) at 37°C, then fixed at room temperature for 30 minutes in a solution of 4% (w/v) formaldehyde (#252549; Sigma), 5% (v/v) acetic acid (#9508-00; J.T. Baker), and 0.9% (w/v) NaCl (A12313/L13268; Alfa Aesar). Fixed cells were then washed again with PBS at room temperature and were made permeable by treating with 0.2% Triton X-100 (T8787; Sigma) for 10 minutes at ambient temperature. The fixed and permeabilized cells were treated at 37°C with 0.1% (w/v) pepsin (#2844-01; J.T. Baker) in 0.1 N HCl (#258148; Sigma) to increase permeability to macromolecular reagents for 10 minutes and finally washed for 5 minutes with PBS before post-fixing with 1% formaldehyde for 10 minutes. They were washed again with PBS before in situ hybridization. A hybridization solution that contained 60% deionized formamide (w/v) (F9037; Sigma), 300 mM NaCl, 30 mM sodium citrate (S1804; Sigma), 10 mM EDTA (#15575-038; Life Technologies), 25 mM NaH2PO4 pH 7.4 (#21988-6; Aldrich Chemical Company), 5% dextran sulfate (#0032-007-058; Eppendorf Scientific), and 250 ng/μL sheared salmon sperm DNA (#11467140001; Roche) was prepared. The DIG-labeled Hybridization probe was denatured at 80°C shortly before use and added to the hybridization solution at a concentration of 100 nM; 200 μL of the hybridization mixture (hybridization solution plus denatured probe) was added to the fixed permeabilized cells and hybridized at 37°C in a moist heated chamber for 16 hours. As a control, 1 well of each set of chambered slides was incubated with hybridization solution only. Following hybridization, the cells were removed from the heated chamber and the cells were incubated with hybridization solution at 45°C for 20 minutes. They were then washed twice at room temperature with 2× sodium chloride, sodium citrate buffer (2× SSC, 300 mM NaCl, and 30 mM Na3C6H5O7) (#15557-044; Invitrogen). A wash solution made up of 60% formamide in 2× SSC was used to wash the cells 3 times at room temperature and once at 37°C, lastly followed by 1 wash for 5 minutes in PBS.
Detection of the hybridized probe was visualized using fluorescein conjugated anti-digoxegenin Fab fragments (#11207741910; Roche). To visualize hybridization, non-specific antibody binding was blocked by treating cells with a solution comprised of Tris buffered saline (TBS) [100 mM Tris-HCl pH 7.5 (#15567-027; Life Technologies), 150 mM NaCl], and 0.5% (w/v) blocking reagent (#11096176001; Roche); 200 μL of the blocking solution was added to each well and placed inside of the moist heated chamber for 30 minutes. Following blocking, cells were washed with PBS at ambient temperature 3 times and then incubated with a 1:50 dilution of anti-digoxegenin-fluorescein Fab fragments in blocking solution for 45 minutes in a moist chamber at 37°C. Slides were washed with 0.05% (v/v) Tween 20 in TBS (P9416; Sigma). Samples were then dehydrated with successive 5-minute incubations in 70%, 90%, and 100% ethanol. Slides were air dried and cover slipped with a ProLong Gold (P36934; Life Technologies). Images were acquired with an inverted Zeiss LSM 510 confocal microscope using a 20× lens (Zeiss Plan-APOCHROMAT 20×/0.8 objective, ∞=0.17) (NA=0.55, WD=26 mm). A laser excitation at 488 nm was used, and emission was collected with a long pass filter at 505 nm. Differential interference contrast images were also acquired using 488-nm light.
After 24 hours of incubation with the antisense oligonucleotide, the media was removed, cells were lysed, and total RNA was isolated using a RNeasy 96-well plate kit (#74181; Qiagen). Complementary DNA (cDNA) was generated using the High Capacity cDNA Reverse Transcription Kit (#4368814; Applied Biosystems,) on a Bio-Rad PTC-200 thermal cycler (Bio-Rad). KD of GR mRNA levels was assessed using a TaqMan gene expression assay for human nuclear receptor subfamily3, group C, member 1 (NR3C1) (Hs00353740_m1 NR3C1; Applied Biosystems). Results were normalized to expression of the housekeeping gene hypoxanthinephophoribosyl transferase (HPRT1) (Hs01003267_m1 HPRT1; Applied Biosystems). Amplification reactions contained: 9 μL of 1-to-10 dilution of cDNA (1 part cDNA, 9 parts molecular biology grade water), 10 μL 2× TaqMan® Gene Expression Master Mix (Applied Biosystems, Foster City, CA), and 1 μL 20× Target Assay Mix (ABI TaqMan® Gene Expression Assay). Similar 20-μL reference reactions were prepared in quadruplicate for amplification of the housekeeping gene HPRT1. Thermal cycling conditions for all reactions were as follows: 2 minutes at 50°C, 10 minutes at 95°C, then 40 cycles of 15 seconds at 95°C and 1 minute at 60°C. Data were collected on a ABI PRISM 7900HT Sequence Detection System (Applied Biosystems).
The relative mRNA expression level of the NR3C1 gene (GR) was determined by normalizing its reaction CT (threshold cycle) to the HPRT1 CT, where CT is the cycle number at which emitted fluorescence exceeds 10× the standard deviation of baseline emission (measured from cycle 3 to 15). The ΔCT value, calculated by subtracting the average HPRT1 CT from the average NR3C1 CT, was then substituted into the formula 2.0–[ΔCt] to provide the relative mRNA expression.
Animal studies
Eight-week-old, male, C57BL/6 mice were obtained from Charles River Laboratories. All mice were housed under standard conditions with a 12-hour light/dark cycle and free access to chow diet (Rodent Diet 5001, Lab Diet, PMI Nutrition International) and water. All procedures involving animals were conducted under animal use protocols approved by Pfizer's Institutional Animal Care and Use Committee in compliance with the Guide for Care and Use of Laboratory Animals, and all applicable federal regulations.
To measure acute activity, mice were administered a single dose of compound in saline at either 3 mg/kg or 10 mg/kg SC. Forty-eight hours following compound administration the mice were euthanized. Biopsies of the kidney and left lateral liver lobe were collected and flash frozen for mRNA analysis and tissue exposure. For the tolerability study, compound was administered in saline at 25 mg/kg SC 2× per week. On day 14, mice were euthanized and serum was collected from the vena cava for analysis of serum markers of liver and kidney toxicity. Tissues (liver, kidney, heart, spleen, bone marrow, and mid-jejunum) were fixed in 10% neutral buffered formalin and processed for histopathology.
Mouse liver biopsy punches (3 mm, 30 mg) were harvested into sterile 2-mL screw-capped Sarstedt tubes and flash frozen in liquid nitrogen. Following the use of Qiagen's Buffer RLT and TissueLyser (Mixer Mill MM 301) instrument for tissue disruption and homogenization, total RNA was isolated using Qiagen's RNeasy 96 Kit. RNA quality and concentration was assessed in 96-well format using Molecular Devices' SpectraMax M2 instrument, where optical density readings were taken at wavelengths of 260 nm, 280 nm, and 320 nm. A maximum of 2.0 μg high quality RNA was converted to single-stranded (s.s.) cDNA using Applied Biosystems' (ABI) High Capacity RNA-to-cDNA Master Mix in a final volume of 20 μL. Final reactions were either used immediately in real time quantitative PCR reactions or stored at −20°C.
Amplification of NR3C1 cDNA was carried out in triplicate in 384-well format, using Applied Biosystems' 7900HT Fast Real-Time PCR System and TaqMan® Gene Expression Assays (Mm00433832_m1). Employing the 5′ nuclease activity of Taq DNA polymerase to generate a real-time quantitative analysis (Heid et al., 1996), 20-μL amplification reactions contained 5 μL of 1:10 dilution of s.s. cDNA (1 part s.s. cDNA, 9 parts molecular biology grade water), 1× TaqMan® Gene Expression Master Mix (Applied Biosystems), and 1× Target Assay Mix (ABI's TaqMan® Gene Expression Assay). Similar 20-μL reference reactions were prepared in triplicate for amplification of the housekeeping gene HPRT1. Thermal cycling conditions for all reactions were as follows: 2 minutes at 50°C, 10 minutes at 95°C, then 40 cycles of 15 seconds at 95°C and 1 minute at 60°C.
The relative mRNA expression level of the NR3C1 gene was determined by normalizing its reaction CT to the HPRT1 CT, where CT is the cycle number at which emitted fluorescence exceeds 10× the standard deviation of baseline emission (measured from cycle 3 to cycle 15). The ΔCT value, calculated by subtracting the average HPRT1 CT from the average NR3C1 CT, was then substituted into the formula 2.0–[ΔCt] to provide the relative mRNA expression. (See Meijerink et al., 2001 for the CT method.)
Tissue concentration determination
Liver and kidney samples were analyzed for oligonucleotide concentrations using a liquid chromatography/mass spectrometry/mass spectrometry (LC/MS/MS) based method. A portion of liver and kidney tissue was sectioned, weighed, and homogenized (1 part tissue in 4 parts water; w/v) using a BioSpec Beadbeater for up to 5 minutes with 2-mm Zirconia beads in a cooled block. Calibration and quality control standards were prepared in control tissue homogenate. Samples were further diluted with control homogenate in order for concentrations to fall within the dynamic range of the assay. One hundred microliters of homogenate was added to 96-well plate wells followed by the addition of 15 μL of internal standard at 5 μg/mL in K2EDTA plasma. Twenty microliters of chloroform:phenol (1:2; v/w) was added to each well; the plate was gently vortexed for 1 minute and then centrifuged at 1,500 g for 1 hour. Next, 60 μL of supernatant was removed and added to 60 μL water in a 96-well plate containing silanized q-glass vials. Injections of 10 μL were made with a CTL PAL leap auto-injector onto a Hypersil Gold 50 mm×2.1 mm; 1.9-mm column at 60°C with a flow rate of 0.180 mL/min delivered by a Shimadzu HPLC system. Mobile phase A (MP A)=1.7 mM TEA, 100 mM HFIP in water, and mobile phase B=methanol. LC conditions: start 5% MP B, gradient to 30% MP B by 10 minutes, and re-equilibrate to 5% MP B by 14 minutes. LC flow was directed to the MS from 5.0 to 8.0 minutes. Multiple reaction monitoring in negative ion mode was done using a Sciex API 4000 Q-Trap. Sample concentrations were determined by interpolation from a standard curve with a linear 1/(x2) fit using Analyst 1.4.2. Resulting values in ng/mL were multiplied by 5 in order to obtain ng/g tissue concentrations.
Results and Discussion
Our studies were performed using ASOs designed against the GR as a representative target. The GR has been of therapeutic interest for many years in the pharmaceutical industry as hyperglycemia driven by increased hepatic glucose output is a prevalent pathophysiology associated with insulin resistance ultimately contributing to the development of type 2 diabetes mellitus (T2DM) (Consoli et al., 1989). Glucocorticoid (GC) hormones are synthesized through a signaling cascade involving the hypothalamus, pituitary, and adrenal glands (HPA). Upon exposure to target tissues, these hormones exert their biological effect through association, with GR promoting the translocation of the activated receptor to the nucleus where it regulates the expression of a variety of target genes (Gagner and Drouin, 1987; TATA, 2002). Within the liver, activated GR increases the transcription levels of key enzymes involved in gluconeogenesis including phosphoenolpyruvate carboxykinase and glucose-6-phosphatase together enhancing the production of glucose (Barthel and Schmoll, 2003). Genetic data from animal models as well as in human disease has clearly demonstrated a link between increased GC levels as well as GR function in the pathogenesis of T2DM and as such development of GR antagonists represents an attractive mechanism to treat the disease (VAN DEN BERGHE, 1996; Opherk et al., 2004). Although systemic inhibition by small molecules (eg, RU-486) has been shown to improve glucose homeostasis, the safety profile, including activation of the HPA axis, makes chronic use of these molecules as a pharmacological agent for T2DM an unfeasible approach (Chu et al., 2001).
Recent advances in antisense oligonucleotide design and the use of targeting moieties with systemic GR small molecule antagonists, allowing more efficient liver delivery, has afforded a generation of GR inhibitors that pre-clinically have demonstrated an improved safety profile while maintaining efficacy. Specifically, GR 2′-MOE ASO molecules administered to rodent models of diabetes improve glucose metabolism and reduce circulating plasma triglycerides. Additionally, a bile acid conjugate of RU-486 decreases hepatic glucose output in fasted conscious normal dogs. Importantly, both approaches showed no apparent activation of the HPA axis (Jacobson et al., 2005; Liang et al., 2005; Watts et al., 2005).
After an initial screening campaign for antisense inhibitors for GR (data not shown), 3 potent leads were identified, sequences 1–3. Each of these sequences was designed as a 3-8-3 LNA gapmer with fully phosphorothioated linkages. The gapmers have 3 LNAs placed on each end, or “wings,” while the central 8 nucleotides are DNA to allow for RNaseH activity. The initial in vivo and in vitro profiling of these compounds is presented in Table 1, with the results of an in vivo tolerability study given in Table 2. Overall the transfected in vitro activity of sequences 1 and 2 in both mouse (Hepa1-6) and human (Hep3B) cell lines was excellent, with half maximal inhibitory concentrations (IC50s) in the low nanomolar range. In comparison, sequence 3 was approximately 10-fold less active with an IC50 in Hepa1-6 of 270 nM and Hep3B of 90 nM. This difference in in vitro potency translated into the in vivo result with the 3-8-3 LNA versions of sequences
IC50, half maximal inhibitory concentration.
Two-week studies with biweekly subcutaneous injections of 25 mg/kg for 100 mg/kg cumulative dose.
ALT, alamine transaminase; AST, aspartate transaminase.
While potent, these compounds had substantial toxicity liabilities, summarized in Table 2. Here the 3-8-3 LNA derivatives were studied for 2 weeks in mice, dosing 25 mg/kg twice weekly delivering a cumulative 100 mg/kg dose. All 3 compounds had significant liver toxicity, while sequences 1 and 3 also demonstrated strong kidney toxicity as well. The toxicity of compounds 1 and 3 was severe enough to result in early morbidity for several of the animals after only the second dose. In an effort to reduce the toxicity while maintaining the activity of these sequences a series of chemical modification patterns was introduced into each sequence (1–3). Each of the modified compounds maintained the sequence of its parent but differed in the pattern of nucleoside chemical modification. The modifications fell into 3 general classes: (1) LNA limiting, (2) G-Clamp introduction, and (3) MOE comparison. The LNA limiting compounds were designed as 2LNA-10DNA-2LNA, 1LNA-12DNA-1LNA, 2LNA-1(2′F,2′OMe)-8DNA-1(2′F,2′OMe)-2LNA, 1(2′F,2′OMe)-1LNA-1(2′F,2′OMe)-8DNA-1(2′F,2′OMe)-1LNA-1(2′F,2′OMe), 1(2′F,2′OMe)-2LNA-8DNA-2LNA-1(2′F,2′OMe), 1LNA-2(2′F,2′OMe)-8DNA-2(2′F,2′OMe)-1LNA, 2(2′F,2′OMe)-1LNA-8DNA-1LNA-2(2′F,2′OMe), 2(LNA, 2′F, 2′OMe, MOE)-8DNA-2(LNA, 2′F, 2′OMe, MOE), and for comparison, 4(LNA, F, 2′OMe, MOE)-6DNA-4(LNA, F, 2′OMe, MOE). In this notation, lists of modifications in parenthesis indicate alternatives. For example, a pattern listed as 3(LNA, 2′F, 2′OMe)-8DNA-3(LNA, 2′F, 2′OMe) represents 3 potential compounds, one with LNA wings, one with 2′F wings and one with 2′OMe in the wings. These modifications patterns are shown graphically in Fig. 2. The G-Clamp compounds were designed to make use of the available cytosines in each sequence, allowing for the placement of between 1 and 3 G-Clamps. Additionally within each sequence, identical G-Clamp placements were tested in the context of 3-8-3 gapmers in which the wings were LNA, 2′F, 2′OMe, or DNA (shown explicitly in Fig. 3). A separate set of compounds was designed to span between the 5MOE-10DNA-5MOE (used in Mipomerson and typical of MOE modified gapmers) and a shorter 3LNA-8DNA-3LNA design used with LNA gapmers. For these compounds, sequence 2 was used as the 14mer for the comparison and then extended 3 bases from each end to obtain the 20mer, sequence 4. See Fig. 1 for nucleotide chemical modification abbreviations and Fig. 4 for a graphical illustration of these ASOs.

In vitro percent knockdown (KD) of glucocorticoid receptor (GR) using transfection in Hep3B cells at 0.3nM (blue) and 3nM (red) for sequences 1–3 with various patterns of chemically modified nucleotides. Only the pattern of modification is shown with the KD for each sequence shown to the right of the modification pattern.
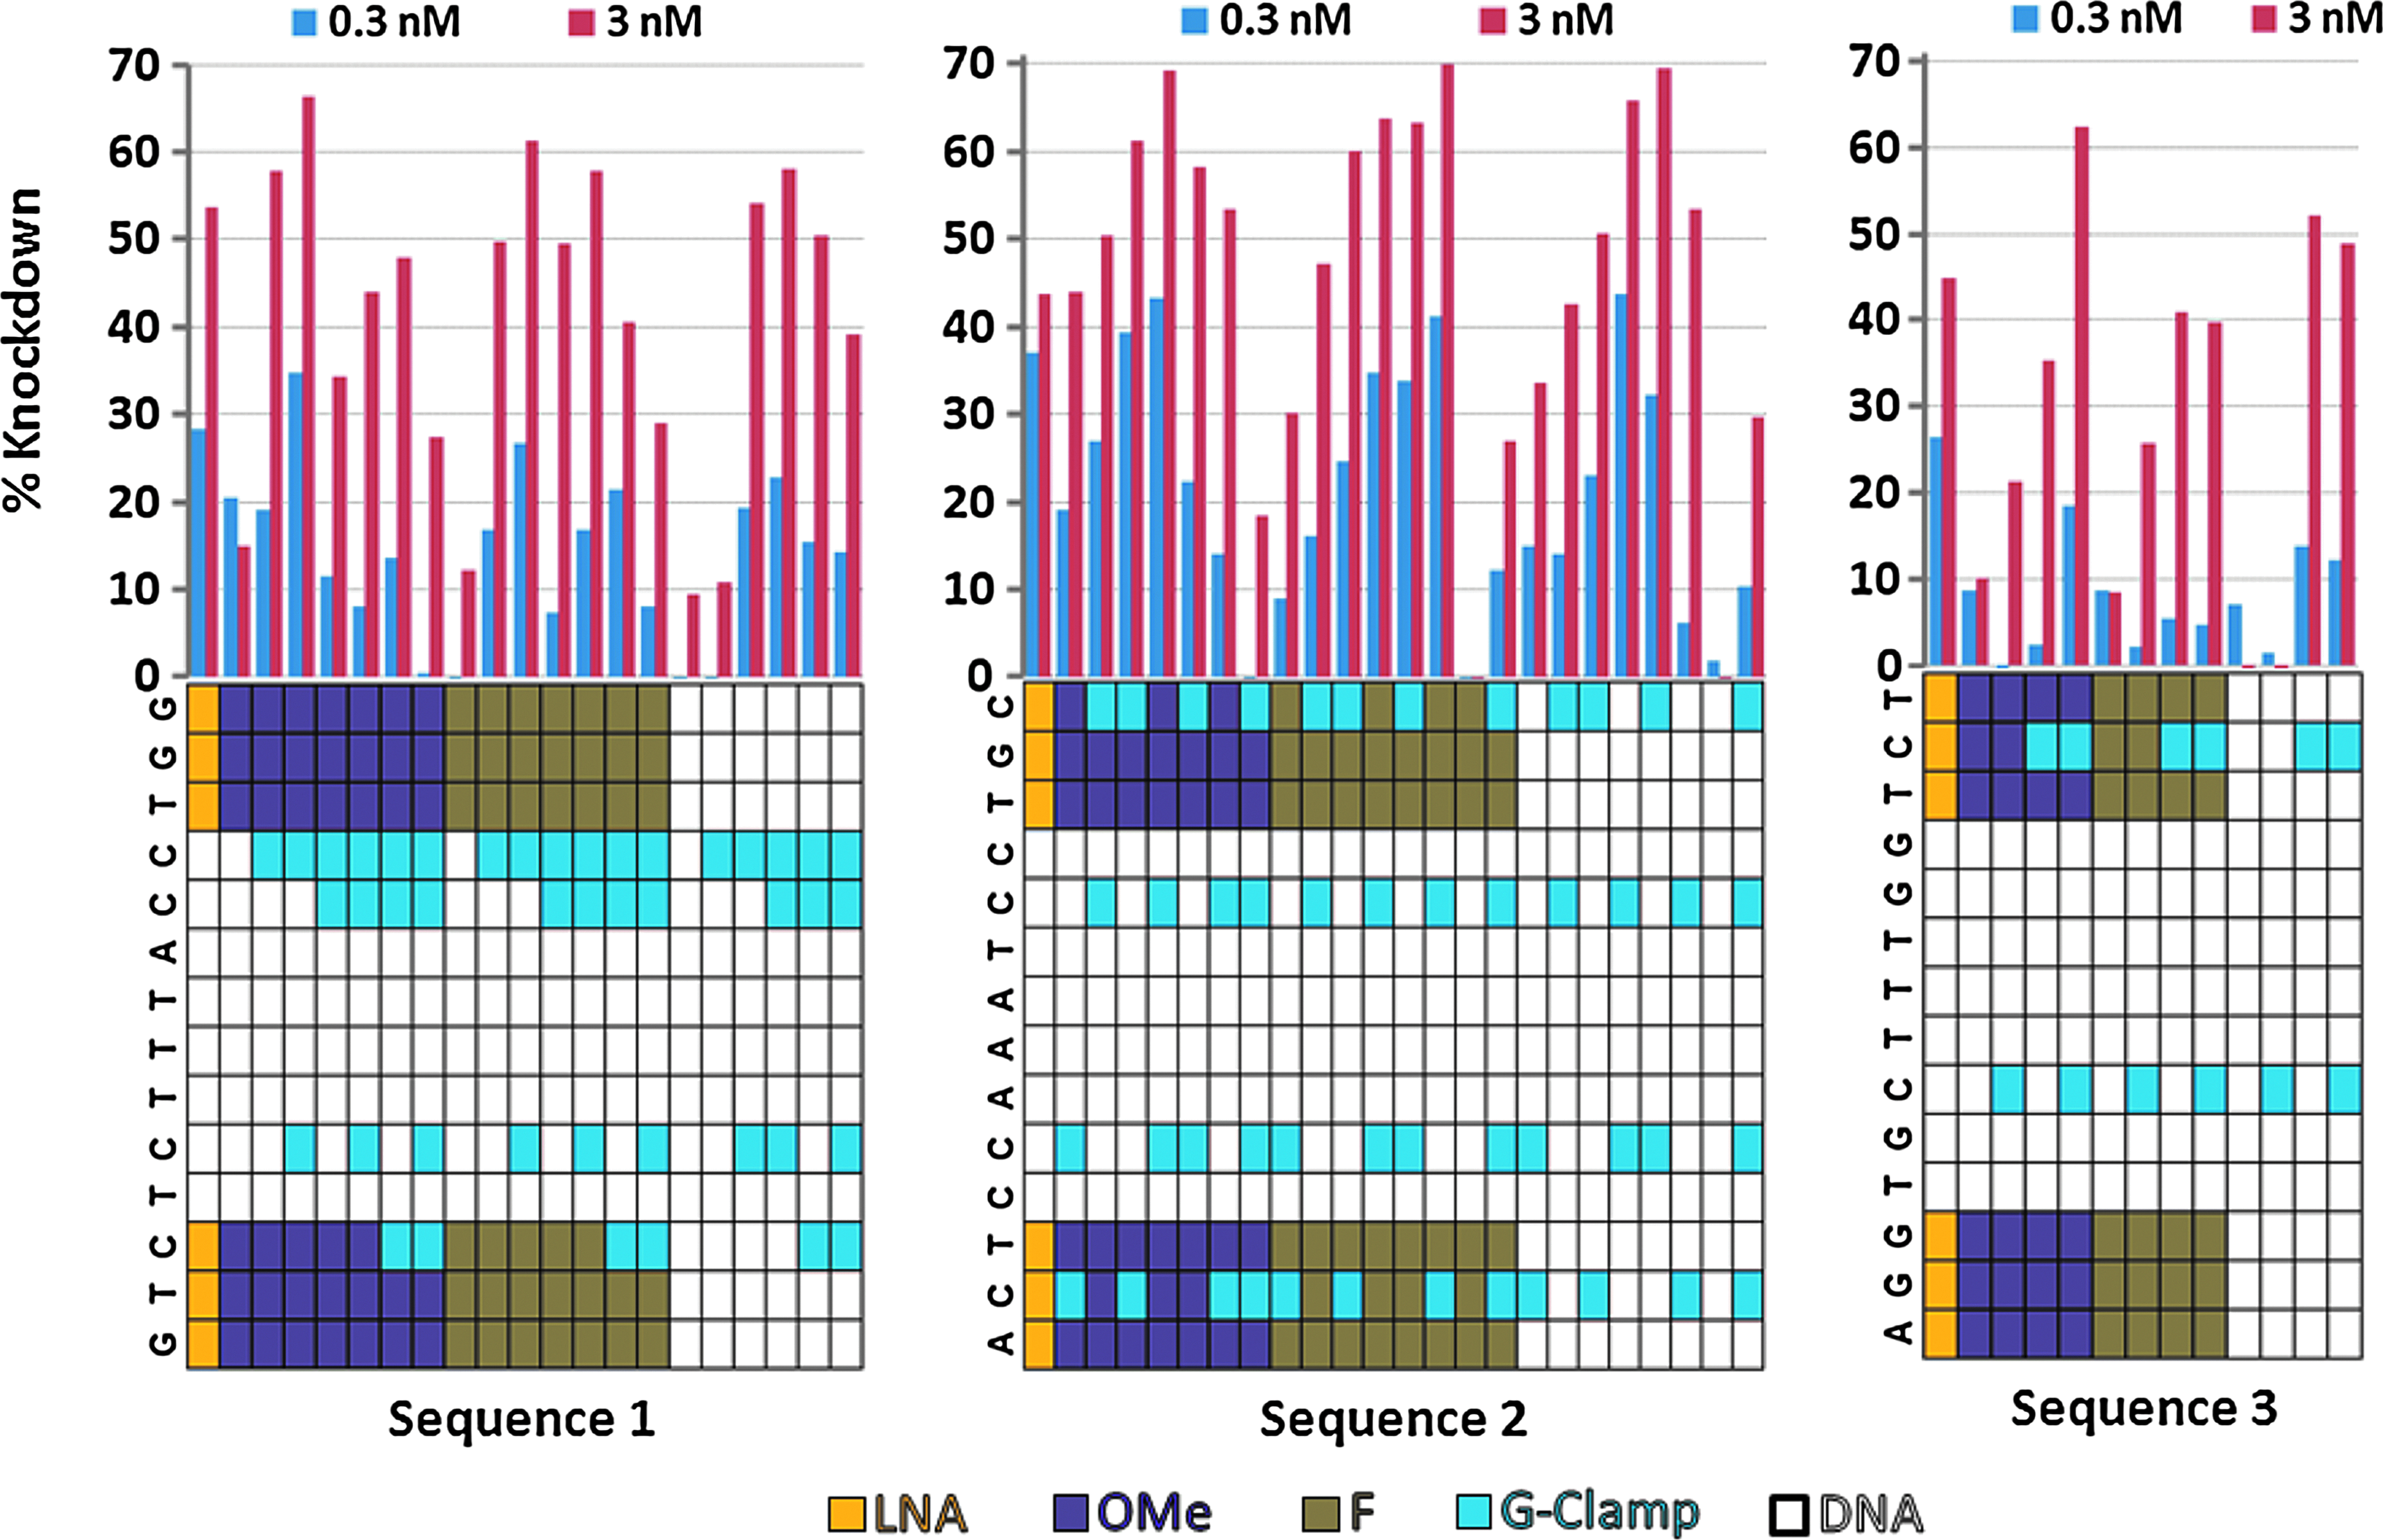
In vitro percent KD of GR using transfection in Hep3B cells at 0.3nM (blue) and 3nM (red) for the G-Clamp modified sequences 1–3 analogs. Each block of compounds represents one sequence (shown at the top of the block) with multiple nucleotide modification patterns, which are shown through the color coding given in the legend.

In vitro percent KD of GR down using transfection in human (Hep3B) and mouse (Hepa1-6) cells at 0.3nM and 3nM for a series of compounds that transition between a 5MOE-10DNA-5MOE modification pattern to a 3LNA-8DNA-3LNA pattern in both mouse and human cell lines. The 2 blocks of sequences are the same transition of modifications but using the mouse and human sequences respectively.
The in vitro KD of the G-Clamp modified sequences using transfection conditions in Hep3B cells is shown in Fig. 3, while the data for the LNA-limiting compounds is shown in Fig. 2. Several of the G-Clamp derivatives show substantially improved in vitro KD as compared with the 3LNA-8DNA-3LNA parent compound (shown for reference as the first compound in Figs. 2 and 3). This is in contrast to the 3(F,MeO,DNA)-8DNA-3(F,MeO,DNA) derivatives without G-Clamps, which showed little or no activity. Interestingly, the level of activity was not directly proportional to the number of G-Clamps (although interpretation is complicated by neighbor dependence of the G-Clamp). Two G-Clamps appear to be the optimal number for in vitro KD, with decreased activity seen for those compounds with 3 or 4 G-Clamps (this observation will be discussed at more length in the context of the compound's melting temperatures). As observed previously, the G-Clamps can be positioned in the central DNA portion of the molecule without an adverse affect on activity, demonstrating their ability to recruit RNaseH (see Fig. 5 for examples of sequences with multiple G-Clamps that retain excellent RNaseH recruitment). Transfected IC50s in Hep3B cells for select G-Clamp compounds are shown in Fig. 6, confirming that several of the 2 and 3 G-Clamp substitution patterns have improved the in vitro potency as compared with their 3LNA-8DNA-3LNA parent sequence.

RNaseH data for the chemically modified derivatives of sequences 1–3. The alphabetic labels correspond to those given in Fig. 6 when combined with the sequence number for which individual lines are drawn.

In vitro half maximal inhibitory concentrations (IC50s) for KD of GR in HEP3B cells using transfection conditions for select G-Clamp modified compounds. Each block of compounds represents a single sequence shown at the top of the block, with nucleotide modification patterns for each compound shown using the color coding given in the key.
The transfection data for the LNA limiting compounds (Fig. 2) shows several trends. First, independent of modification, the 2-8-2 compounds show greatly decreased activity from the 3LNA-8DNA-3LNA parent sequence. The only outlier is the 2LNA-8DNA-2LNA analog of sequence 3, which exhibits activity nearly equivalent to the parent. For the 4(LNA,MOE,F,Me)-6DNA-4(LNA,MOE,F,Me) variants, only the 4MOE-6DNA-4MOE derivative (data only available for sequence 1) shows modest activity. For the series of compounds that reduce the number of LNAs in the wings and increase the size of the DNA gap, the activity is seen to decrease with the reduced number of LNAs (3LNA-8DNA-3LNA>2LNA-10DNA-2LNA>1LNA-12DNA-1LNA) for each of the 3 sequences. Activity is restored somewhat when the LNAs are replaced with 2′OMe or 2′F, and the 2LNA-1(F,OMe)-8DNA-1(F,OMe)-2LNA analogs show equivalent or improved activities over the parent compounds. The pattern of the wing modifications plays an important role in the activity of the compounds. The trend across the 3 sequences when the wings contained 2 LNAs and 1 2′OMe or 2′F modification was 2LNA-1(F,OMe)>1LNA-1(F,OMe)-1LNA>2(F,OMe)-1LNA.
The in vitro KD data for the series of compounds that stepwise convert a MOE 20mer (sequence 4) to LNA 14mer (sequence 2) is shown in Fig. 4. The data is given using lipid transfection conditions at compound concentrations of 3.0 and 0.3 nM in both human and mouse cell lines. Under these assay conditions, the 14mer LNA shows equivalent activity to the 20mer MOE compound within experimental error. In contrast, the 20mer LNA (5LNA-10DNA-5LNA) and the 14mer MOE (3MOE-8DNA-3MOE) only show modest activity at the higher concentration (3 nM). The results correlate well across the mouse and human cells lines, and the compounds designed to span the space between the 20mer MOE and 14mer LNA show a consistent trend of lower activity as the compound patterns are switched. This difference may again point to an optimal hybridization energy, with the affinity of the 20mer LNA being too high and the 14mer MOE too low.
To further study, the correlation between hybridization energy and activity, melting temperatures (with a complimentary RNA strand) and RNaseH recruitment were measured for the majority of compounds in the study, with the results shown in Figs. 5 and 7. The melting temperatures for the compounds are largely what might have been predicted given their chemical modification and range from ∼50°C for the purely DNA compounds to >87°C for a compound with 4 G-Clamp insertions. Fig. 8 shows a plot of the melting temperature versus the in vitro KD at a 3-nM dose using lipid transfection in the Hepa1-6 mouse cell line. Overall, there is a moderate association between KD and melting temperature, with a correlation coefficient R=0.56 (p<0.0001, significant). Although significant, the moderate association between Tm and in vitro KD seems to be driven by compounds with intermediate melting temperatures (between 55 and 80°C) and it is independent of parent sequence. Compounds with Tm's lower than 55°C do not appear to have the necessary binding affinity, at these concentrations, to reduce the target mRNA expression. Likewise, a Tm of greater than 80°C results in low activity, possibly due to an inability to recycle the antisense sequence after RNaseH cleavage or undesired binding (off-target effects), resulting in lower ASO concentration at the target site. Compounds with melting temperatures between 55 and 80°C show a stronger association with KD, as suggested by the improved correlation coefficient R=0.66. Supplementary Table S1 (Supplementary Data are available online at www.liebertpub.com/nat) shows the average variation in Tm upon multiple insertions of chemically modified nucleosides. Although the ΔTm for LNA, 2′-OMe, 2′-F and MOE are in alignment with what has been previously reported in the literature, a significant cooperative effect was observed in the case of LNA. The average ΔTm per LNA modification increased with the number of insertions until reaching a plateau around 6 LNAs in a sequence. This behavior was unique to LNA and was not observed for the 2′-F, 2′-OMe and MOE modifications. As expected, strong sequence dependence was found for G-Clamp modifications (Ortega et al., 2007), with Tm changes in the range of 2–12 °C per insertion depending on nearest neighbor differences.
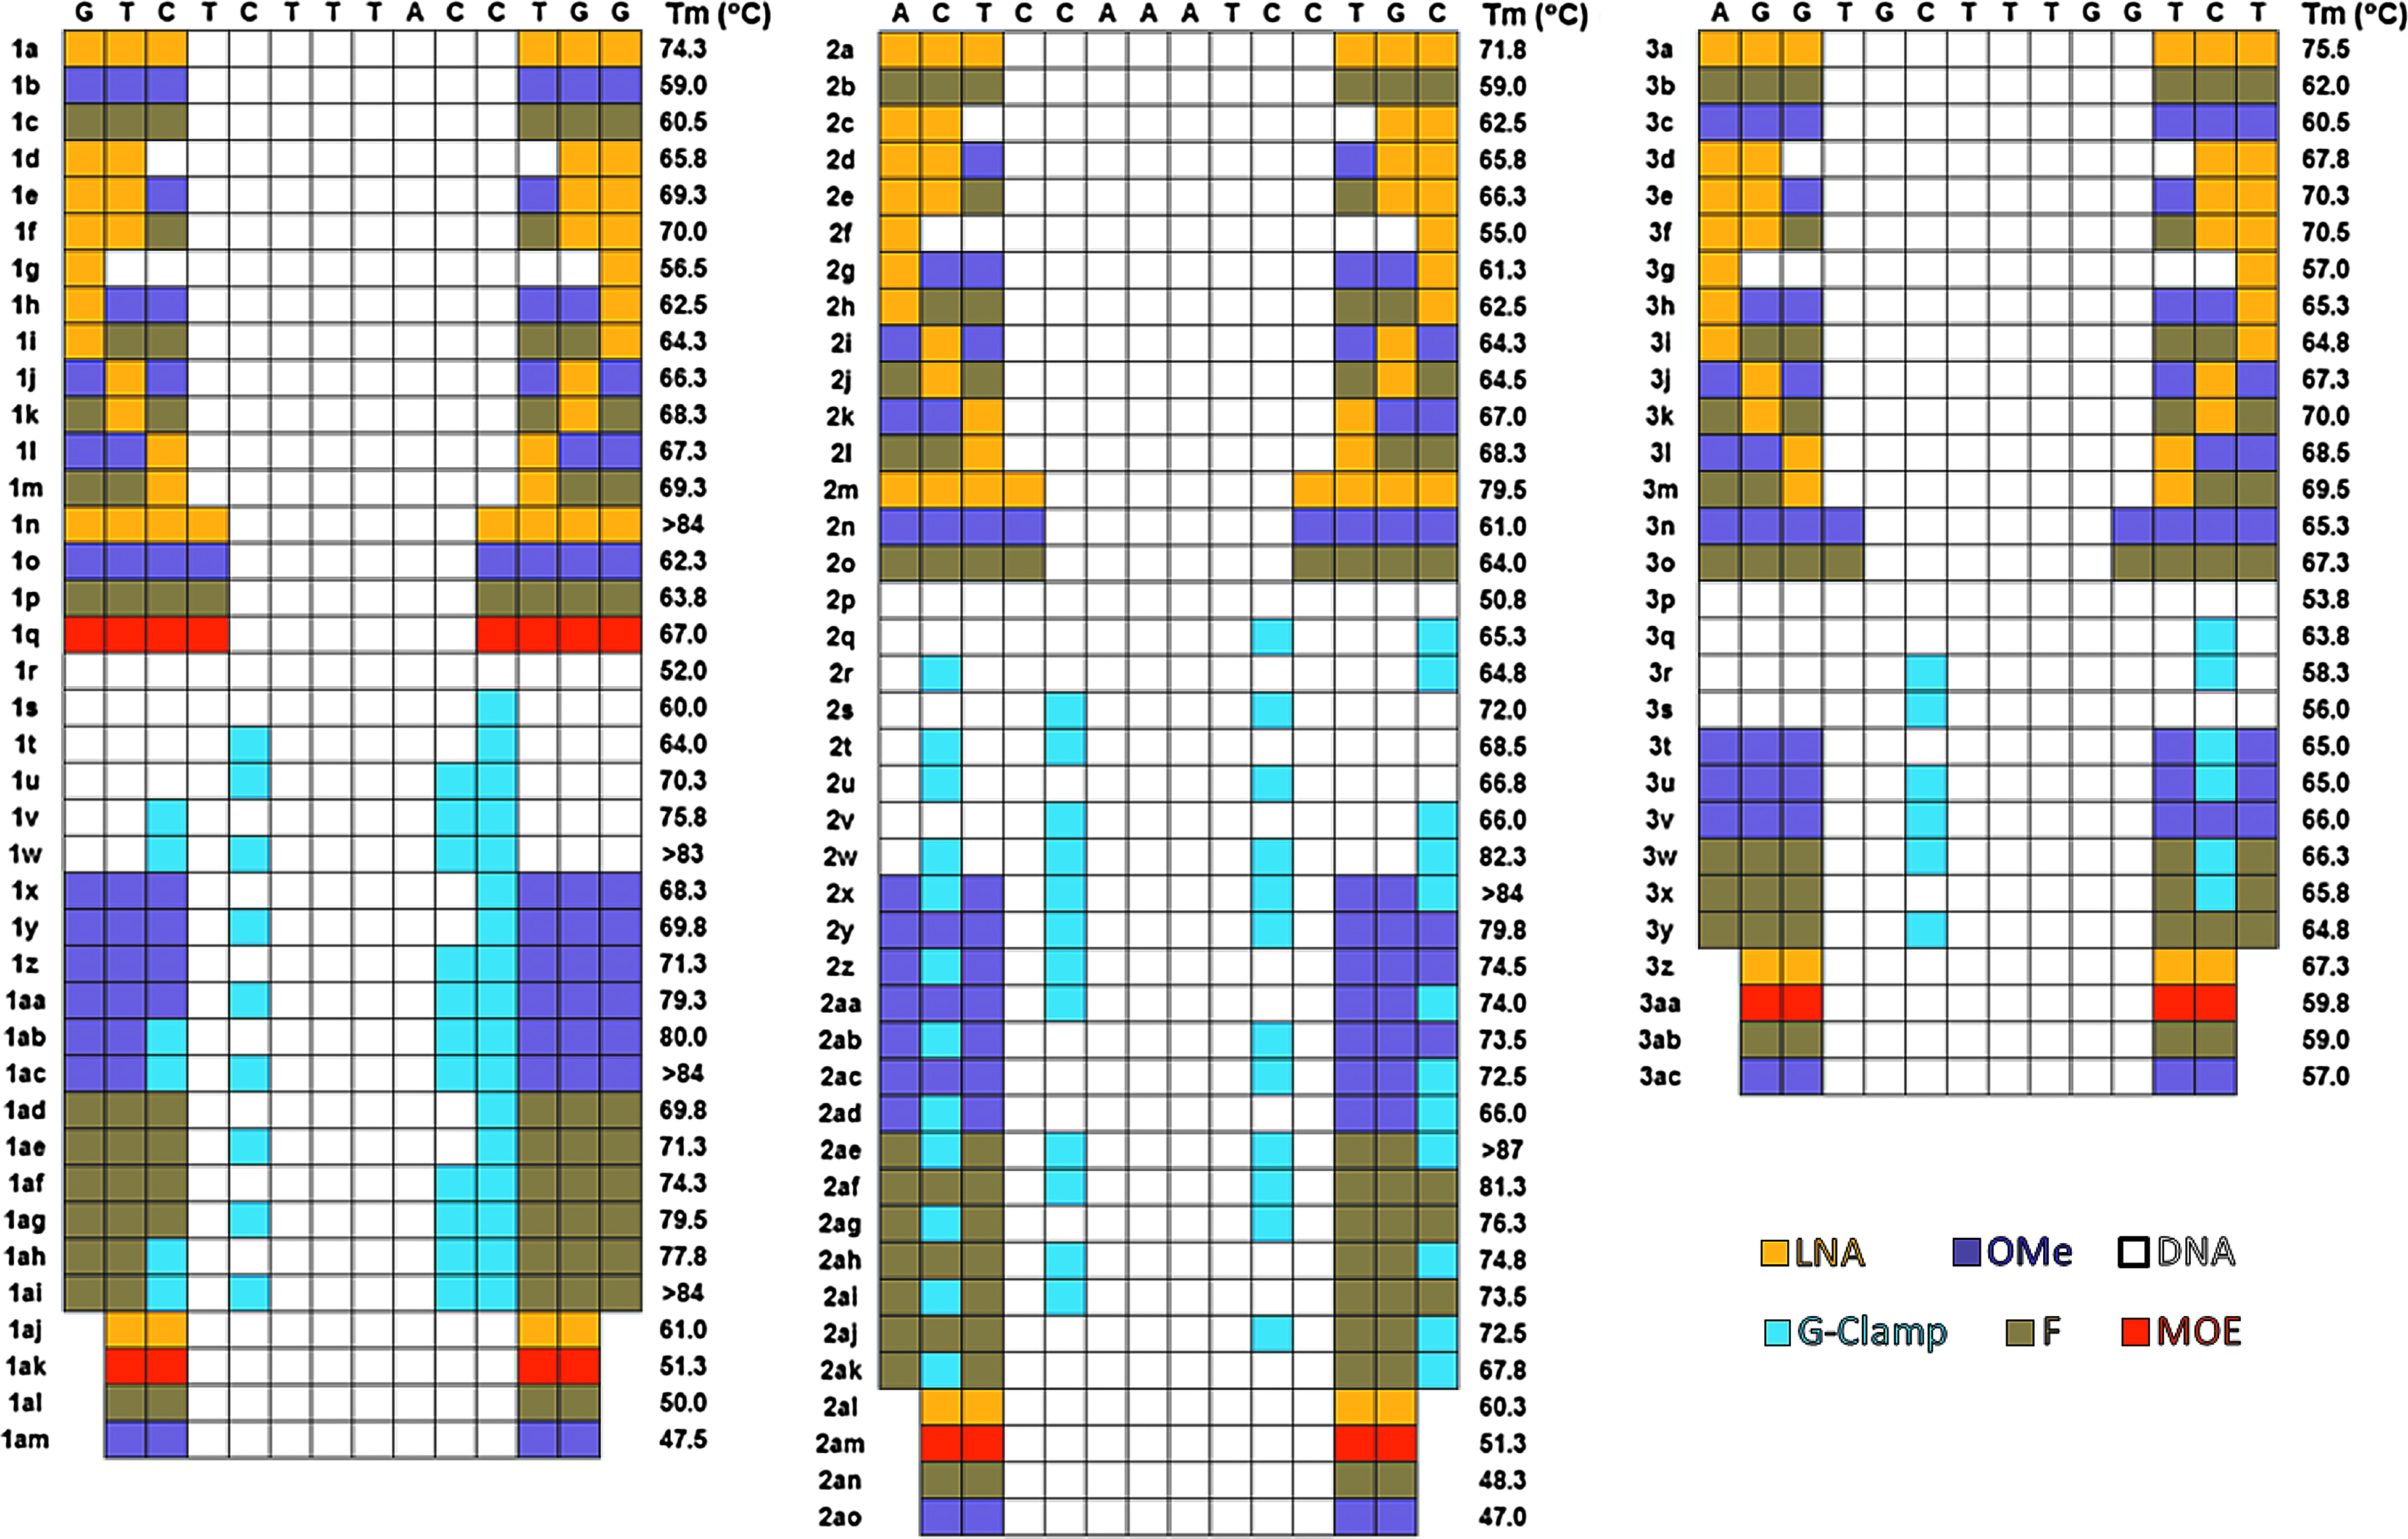
Melting point data in °C for sequences 1–3 with various chemical modifications when annealed with their RNA compliment. Each sequence is shown at the top of the block, with the modification patterns for each compound indicated by the color coding given in the key.

Melting points (°C) for the chemically modified analogs of sequences 1–3 versus percent KD of GR at 3 nM transfected into mouse Hepa1-6 cells. Lines representing the R-value for the entire data set (red) and the data between 55°C and 80°C (blue) are shown. GR, glucocorticoid receptor.
There is little correlation between RNaseH and KD activity, as shown in Fig. 5. While some of the potent compounds do show higher RNaseH recruitment (in comparison to the other analogs, eg., 3LNA-8DNA-3LNA), there are compounds which demonstrate an equal ability to recruit RNaseH that show little mRNA KD (eg, 1LNA-2′OMe-8DNA-2′OMe-1LNA). The comparison of RNaseH data across sequences is also challenging, as there is no correlation with the relative activities of the parent compounds. The 3LNA-8DNA-3LNA parent compounds of sequences 1–3 demonstrated in vitro transfected KD activities that compare as 1=2>> 3. In comparison, these same compounds in the RNaseH recruitment assay show a relation of 1>> 2≈3, with the results for the analogs of these compounds showing consistent trends across the sequences.
A subset of the most active compounds according to the lipid transfection data was further profiled in vitro using unassisted delivery conditions. Unassisted delivery (sometimes referred to as gymnotic delivery) does not use a transfection agent but instead allows the compounds to “self-deliver” with higher oligonucleotide concentrations and longer assay time. The mouse cell line (Hepa1-6) and human cell line (Hep3B) KD data at 2.5 and 10 μM concentrations is shown in Fig. 9. Also shown in this figure is the cell proliferation data, which can serve as a surrogate indicator of cytotoxicity (a particularly important factor to monitor given the assay conditions). Any KD data from an assay in which the cell proliferation was lower than 50% must be interpreted with caution.
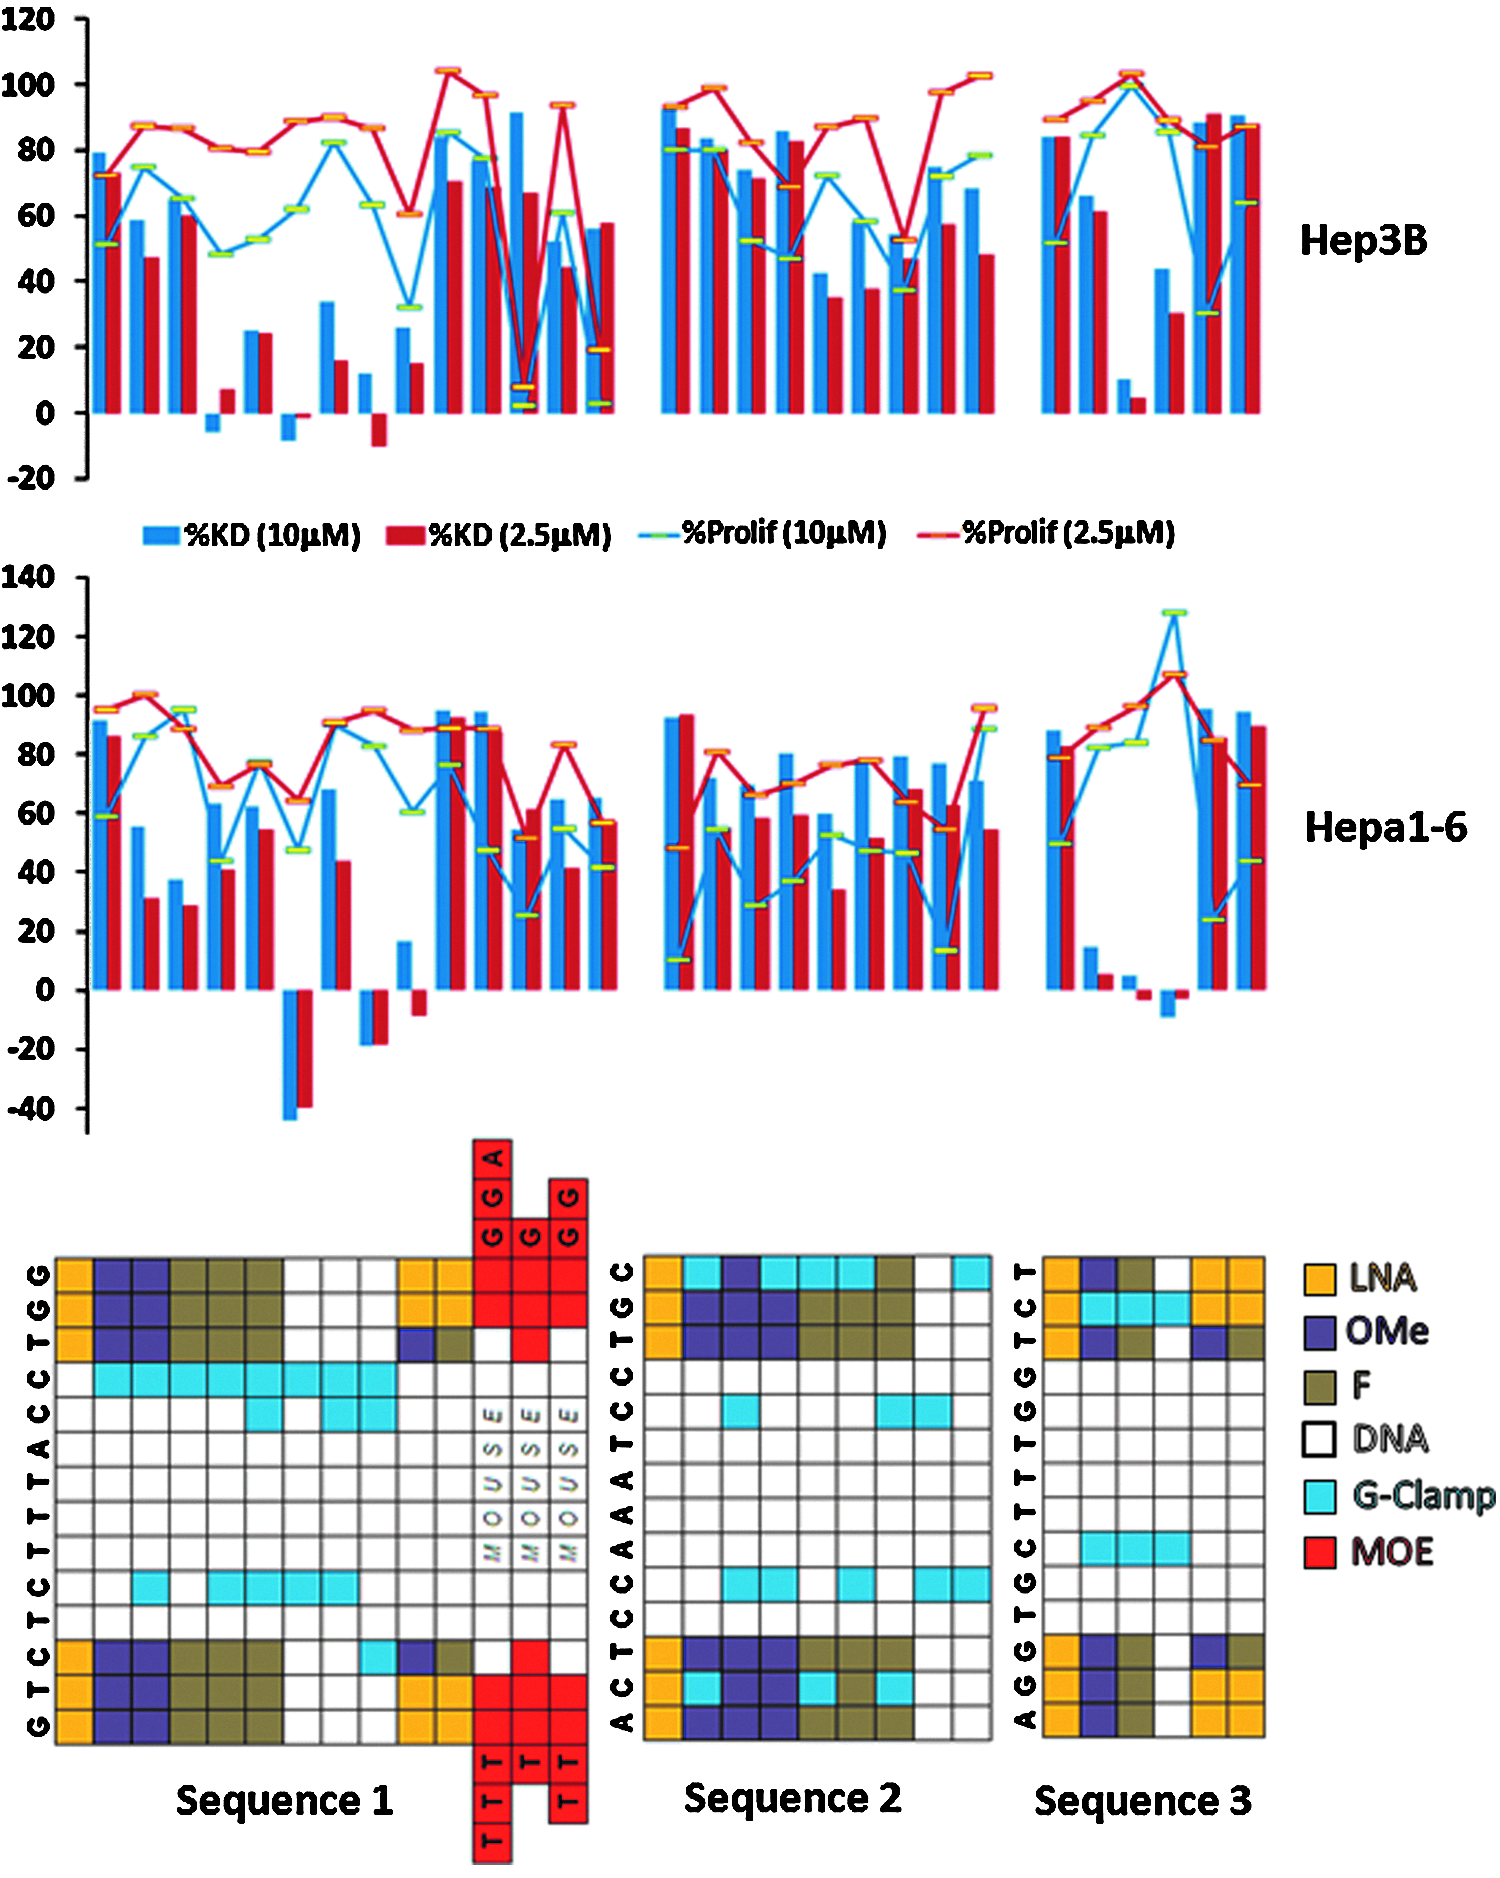
Unassisted (no transfection agent) in vitro percent KD in Hep3B and Hep1-6 cell lines at 10 μM (blue) and 2.5 μM (red) for sequences 1–3. Each block of compounds represents one sequence (shown at the top of the block) with multiple nucleotide modification patterns, which are shown through the color coding given in the legend. Also included are lines representing the cell proliferation values for each concentration as compared to the peptidyl-prolyl cis-trans isomerase (PPIB) control.
While the data for mouse and human cell lines was similar, several trends emerge from the in vitro unassisted delivery data. In particular, the G-Clamp derivatives for all the sequences are much less potent in the unassisted assay than had been seen in the lipid transfection data. While this is particularly stark for sequence 3 G-Clamp analogs, the same trend is seen for the G-Clamp analogs of the other 2 sequences. By lipid transfection several of these compounds were equipotent or better as compared with the 3LNA-8DNA-3LNA parent, while by unassisted delivery they are inactive or only marginally potent. In comparison, KD was maintained under unassisted conditions in the two LNA limiting designs tested 2LNA-1(F,OMe)-8DNA-1(F,OMe)-2LNA (only tested for sequences 1 and 3), with activity equivalent or slightly better than the 3LNA-8DNA-3LNA parent.
For the MOE compounds, only analogs of sequence 1 were tested using unassisted conditions. Unfortunately, this complicates interpretation as when sequence 1 is extended by 3 bases at each end (sequence 4), there is no longer complete homology between the mouse and the human sequence. In consequence, the compounds were designed to perfectly match the mouse sequence and have one mismatch to the human. While it might be expected that the mismatch to the human mRNA would result in a decrease of activity in the human cell line versus the mouse cell line, this is difficult to confirm given the poor cell proliferation seen for two of the 3 MOE compounds tested in the human cell line. In the mouse cell line, the cell proliferation readings for the MOE analogs are quite good, although even the 5MOE-10DNA-5MOE analog, which had been nearly equipotent by transfection in comparison to the 3LNA-8DNA-3LNA parent (data not shown) is less active by unassisted delivery. Additionally, the relative in vivo potency of the 2 compounds will also depend on their protein binding and cellular uptake. Even the difference of only 5 nucleotides in length can fundamentally change the protein binding, absolute liver concentration and relative kidney versus liver ratio (Seth et al., 2009).
Given the in vitro KD differences of G-Clamp analogs between the lipid transfection and unassisted protocols, a small set of compounds was further studied using electroporation. This was done to remove any bias that might have been created by differential transfection efficiency of the various chemical modifications or difficulty in interpretation of unassisted results due to changes in cell proliferation. The results show an excellent correlation of the KD data between lipid transfection and electroporation (Supplementary Fig. S1; Supplementary Data are available online at www.liebertpub.com/nat). The correlation is seen between the electroporation pIC50 and the lipid transfection results at both 3.0 and 0.3 nM, suggesting that the G-Clamps are somehow inhibiting the cellular uptake or endosomal/lysosomal escape of the compounds.
A subset of G-Clamp and gapmer compounds was further studied in a series of imaging experiments, to determine cellular and subcellular localization of the chemically modified derivatives of sequence 1. In situ hybridization probes were prepared for sequence 1 and confocal microscopy was applied to determine cellular uptake of the chemically modified variants. As the imaging studies were run in HEK293 cells in contrast to the Hep3B and Hepa1-6 used for the in vitro results reported so far in this work, the GR KD was evaluated in the cell line and assay conditions used for the imaging. Fig. 10 demonstrates the chemical modification patterns of sequence 1 that were studied along with the unassisted KD in HEK293 cells, and representative images indicating intracellular antisense accumulation. A strong correlation is seen between the KD and the amount of intracellular antisense seen to fluoresce, with the G-Clamp compounds demonstrating little cell penetration, while the 3-8-3 LNA and 2LNA-1(2′F,2′MeO)-8DNA-2LNA(2′F,2′MeO) gapmers show significant amounts of compound in the cell. These results support the premise that the difference in KD is driven by differential cell uptake of the compound and not absolute “potency.”

Effect of modification upon compound uptake and target KD in vitro.
To test if the in vivo KD better correlated with the transfected or unassisted in vitro results, two of the G-Clamp derivatives (G-Clamp-1—DNA with G-Clamps at the 3, 10, and 11; G-Clamp-2—3(2′F)-8DNA-3(2′F) gapmer of sequence 1 with G-Clamps at the 5 and 11 positions) were taken into an acute in vivo KD study. The data for this study are summarized in Fig. 11, where the GR KD was measured in mouse livers 72 hours after a 10 mg/kg subcutaneous injection. The results indicate that while the sequence 1 parent 3LNA-8DNA-3LNA compound shows excellent KD of GR, the G-Clamp derivatives have little or no activity. The results demonstrate the challenges of predicting in vivo response from in vitro assays. The G-Clamp modifies the cytosine base into (9-(aminoethoxy)phenoxazine) such that it both creates a fourth hydrogen bond to guanine as well as improves hydrophobic stacking interactions with neighboring base pairs (Flanagan et al., 1999; Wilds et al., 2002; Ortega et al., 2007) The binding contribution obtained from hydrophobic stacking is reliant on the neighboring base pairs creating a sequence dependent affect on the binding energy resulting in ΔTm's ranging from 4 to 14°C. The ability of G-Clamps not to interfere with the recruitment of RnaseH allows for flexibility in their placement into short antisense compounds, which is not true with the RNA sugar conformation mimics used in gapmers (LNA, MOE, 2′F, etc.) In vitro, with facilitated cell entry through either lipid transfection or electroporation, the G-Clamp derivatives for all 3 sequences tested are seen to have activity in line with their mRNA affinity. This trend (Tm vs. in vitro %KD) is even roughly linear between 60 and 80°C before dropping off for compounds with high Tm's greater than 80°C (3 or 4 G-Clamp insertions). However, in vivo and in the unassisted assay format, the G-Clamp analogs no longer show strong activity (Fig. 9), suggesting that there is a difference in either the cellular uptake or the intracellular functional release of the compounds into the cytoplasm.
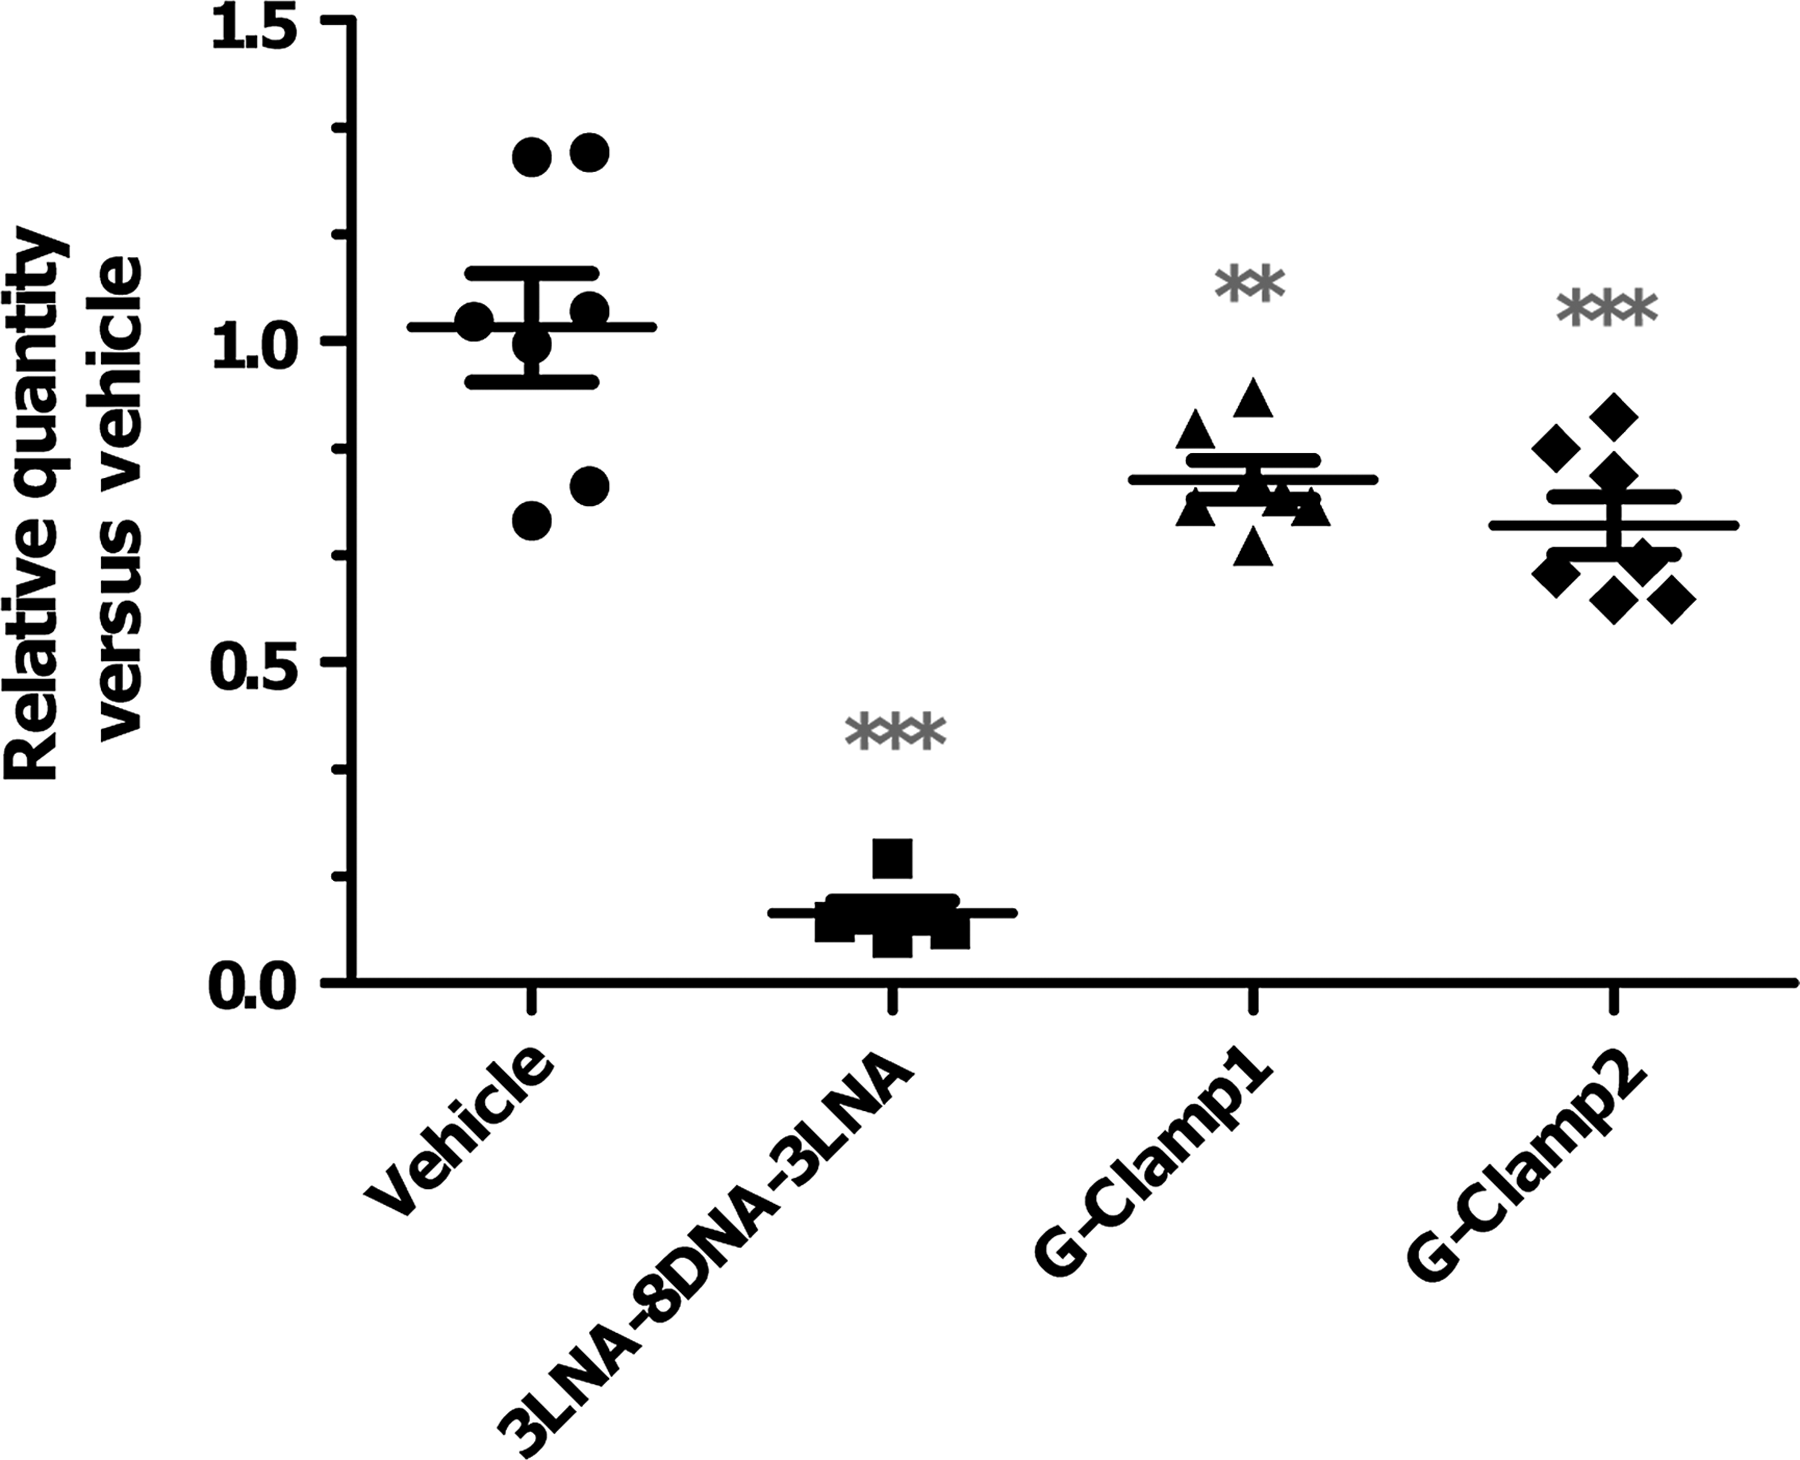
Glucocorticoid mRNA levels in liver of C57BL6 mice 72 hours post 10 mg/kg dose. All compounds derived from sequence 1 with fully phosphothioated linkages. G-Clamp 1, DNA with G-Clamps at positions 3, 10, and 11. G-Clamp
As the 2LNA-1(F,OMe)-8DNA-1(F,OMe)-2LNA derivates of sequence 1 (referred to as Gapmer-1 for the 2′OMe version and Gapmer-2 for the 2′F in Fig. 12) showed excellent activity in vitro using both unassisted and transfection protocols they were also profiled in acute in vivo KD studies. The analogs were compared head to head with their 3LNA-8DNA-3LNA parent (sequence 1) in mice using a 5 mg/kg subcutaneous dose where the activity was assessed in livers 2 and 7 days post dose. As summarized in Fig. 12, the KD in the liver for the gapmers was slightly improved over the parent 3LNA-8DNA-3LNA compound at both time points. At 2 days, the analogs showed an average KD of >85% to 90% as compared to 75% to 80% for the 3-8-3 LNA gapmer. At 7 days post dose, a robust reduction of mRNA expression remained for the 2LNA-1(F,OMe)-8DNA-1(F,OMe)-2LNA analogs where mRNA levels were reduced ∼60%–70% as compared to 40%–50% for the parent LNA gapmer.
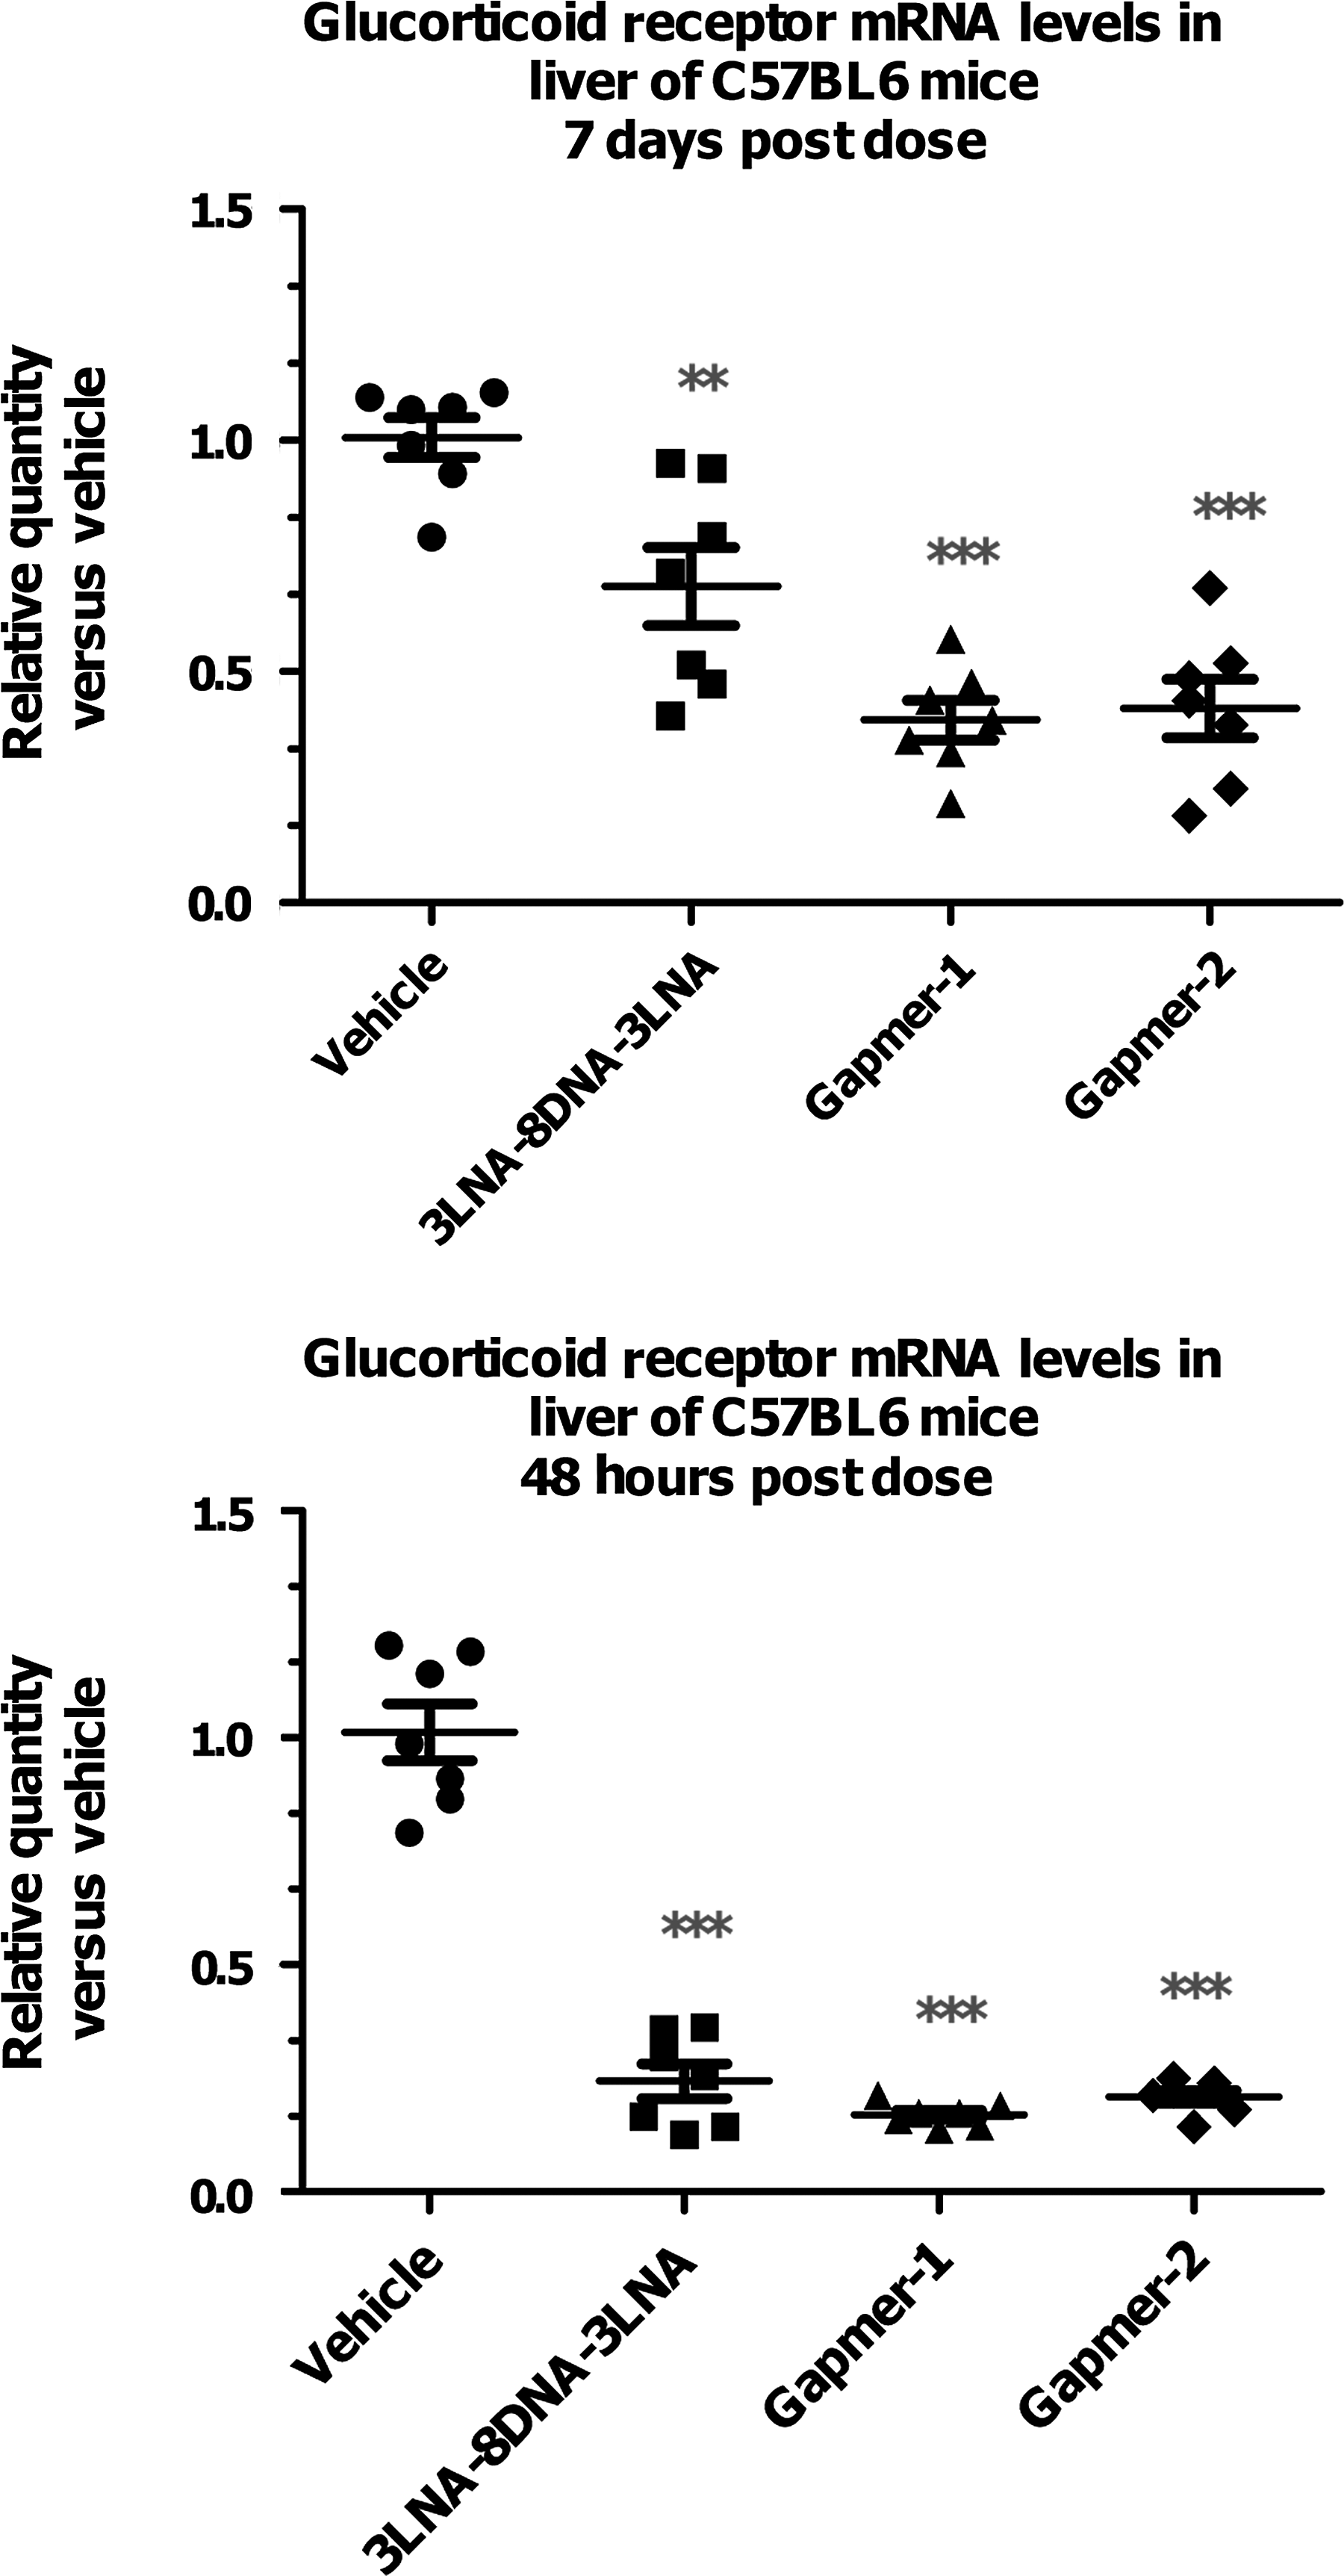
Glucocorticoid mRNA levels in liver of C57BL6 mice 2 and 7 days post 10 mg/kg dose. All compounds derived from sequence 1 with fully phosphothioated linkages. Gapmer-1 has a 2LNA-1(OMe)-8DNA-1(OMe)-2LNA design and Gapmer-2 a 2LNA-1F-8DNA-1F-2LNA design.
This slightly improved in vivo duration of effect is hard to explain purely based on binding efficiency or stability. The kinetics of mRNA reduction is a critical factor for chemically modified oligonucleotides. Several studies have shown a delayed onset of activity for chemically modified siRNAs, and poor compound stability could easily lead to a shortened in vivo half-life and KD activity (Ohrt and Schwille, 2008). The improved duration of KD for Gapmer-1 and Gapmer-2 highlights the complexity of the antisense mechanism. Elements such as cellular uptake, lysosomal escape, nuclease stability, protein binding, RNaseH recruitment, clearance, and subcellular localization all play major roles in determining the in vivo activity of an antisense compound. For example, the overall and relative distributions of Gapmer-1, Gapmer-2, and the 3-8-3 LNA gapmer were determined. The 3-8-3 LNA was seen to have nearly twice the concentration of the other derivatives in the liver, while the relative kidney to liver (k:l) concentration ratio was ∼6 for the 3-8-3 LNA, 15 for Gapmer-1 (2′OMe) and 13 for Gapmer-2 (2′F).
Given the potent in vivo KD of the 2LNA-1(F,OMe)-8DNA-1(F,OMe)-2LNA analogs they were moved into a two week tolerability study identical to that originally used to evaluate the 3LNA-8DNA-3LNA sequence 1 parent compound (Table 2). The altered substitution pattern resulted in a significantly improved safety profile for the compounds. While treatment with the 3-8-3 LNA compound produced severe histological findings in both liver and kidney, as well as early morbidity after the second dose, both 2LNA-1(F,OMe)-8DNA-1(F,OMe)-2LNA analogs demonstrated only low to moderate toxicity, which is summarized in Table 3.
Two-week studies with biweekly subcutaneous injections of 25 mg/kg for 100 mg/kg cumulative dose.
The work presented has clearly shown the significant impact that subtle changes in chemical design and modification patterns can have on the activity, physical properties, and toxicity of short antisense gapmers. While there was some sequence dependent variations, the trends were remarkably consistent across the three sequences studied. Although well known modifications were used, much of what has been presented can be extended to help design compounds and studies for novel chemical modifications. Additionally, we presented acute in vivo KD results for G-Clamp derivatives. In this case while no KD was seen in vivo, the correlation of these in vivo results with the in vitro unassisted assays stand in contrast to those seen under electroporation or lipid transfection conditions and may begin to suggest a mechanistic argument.
The factors involved in toxicity are likely even more complex than those that drive gene KD and include off-target effects, non-specific binding, excessive local concentration, and tissue distribution. It is important to note that the toxicity of ASO gapmers can be highly dependent on the sequence. Beyond altering the toxicity of compounds with identical sequence through chemical modifications, we have also encountered pairs of sequences that differ only by a single base (ie, move a 14mer gapmer by one base along an mRNA sequence) that have fundamentally different toxicity profiles (Pfizer, unpublished data). These results emphasize the need to carefully evaluate sequence modification combinations on a case-by-case basis.
Footnotes
Acknowledgement
The authors would like to thank Eugen Uhlmann for his support during this research.
Author Disclosure Statement
No competing financial interests exist.
References
Supplementary Material
Please find the following supplemental material available below.
For Open Access articles published under a Creative Commons License, all supplemental material carries the same license as the article it is associated with.
For non-Open Access articles published, all supplemental material carries a non-exclusive license, and permission requests for re-use of supplemental material or any part of supplemental material shall be sent directly to the copyright owner as specified in the copyright notice associated with the article.
